![]()
I last reviewed Nasdaq (NDAQ) in this January 30, 2026 post at which time the most current financial information was for Q4 and FY2025. With the release of Q1 2026 results on April 23, 2026, this is an opportune time to revisit this existing holding.
Industry Overview
The equity exchange business is increasingly competitive and NDAQ has gradually been losing market share over the past few years. This pressure is likely to continue as the MEMX (Members Exchange) and the MIAX Pearl Equities are relatively new, technology-driven U.S. stock exchanges both launched in September 2020. They were created to compete with established venues by offering faster, lower-cost trading.
- MEMX (Members Exchange) is designed for efficiency and backed by major financial firms. This exchange expanded into options in 2023.
- MIAX Pearl Equities is part of Miami International Holdings, focusing on high-speed, automated trading.
Both exchanges are contributing to increased competition and fragmentation in U.S. equity trading.
In addition to these 2 new exchanges, the Texas Stock Exchange plans to launch in 2026.
Business Overview
The best way to learn about NDAQ is to review its website. Part 1 Items 1 (Business) and 1A (Risk Factors) in the FY2025 Form 10-K are also a great sources of information.
NDAQ’s market services business comprises transaction-based services, clearing, settlement, and depository services across North American and European markets. It operates multiple exchanges for trading cash equities, derivatives, fixed income, commodities, structured products, and ETFs.
Volatile markets have led to strong industry-wide trading volume with option exchanges performing particularly well. The increased prevalence of $0 commission trading platforms and a shift toward higher option volume bodes well for NDAQ’s exchange business.
Given the increasingly competitive nature of the exchange industry, however, NDAQ has gradually been transitioning away from its exchange business to become a diversified technology company. NDAQ is pursuing opportunities with large and growing total addressable markets (ie. anti-fraud services and financial compliance). Management anticipates its solutions business will grow ~8% – ~11% organically over the next ~3 – ~5 years. In addition to this organic growth, NDAQ has made some meaningful acquisitions with the $10.5B Adenza acquisition being the most recent.
Financials
Q1 2026 Results
Material related to NDAQ’s Q1 2026 Earnings Release is accessible here.
Volatile markets are contributing to NDAQ’s strong results in its exchange business. Although trading volume growth has slowed, the increased prevalence of $0 commission trading platforms and a shift toward higher option volume should benefit NDAQ’s exchanges.
Despite the additional competition noted at the outset of this post, I invested in NDAQ because I agreed with the strategy of transitioning away from the exchange business to become a diversified technology company.
As part this reorientation, NDAQ is focusing on the growth potential of its solutions businesses (ie. Anti-fraud services and financial compliance) which it expects to grow organically by 8% – 11% over the next 3 years. Although the ~$10.5B acquisition of financial technology company Adenza was concerning given the scale and premium paid, NDAQ is achieving its synergy and debt-reduction goals ahead of schedule.
Conventional And Modified Free Cash Flow (FCF) Calculations (FY2020 – FY2025 and Q1 2026)
FCF is a non-GAAP measure, and therefore, its method of calculation is inconsistent. Many investors deduct CAPEX from OCF to arrive at FCF. In my How Stock Based Compensation Distorts Free Cash Flow post, I explain why I now also deduct stock based compensation (SBC) that is found in the Consolidated Statements of Cash Flows to determine FCF.
The variance in the FCF results NDAQ presents differs from online sources. This is because NDAQ makes a moderate adjustment to account for mandatory net Section 31 fees.
We add back net Section 31 fees when determining FCF because FCF should represent cash generation from a company’s core operations. We should, therefore, exclude fees and charges that are either non-operating or not reflective of the company’s ongoing cash-generating ability.
Section 31 fees are regulatory transaction fees imposed by the SEC on certain securities transactions to fund its oversight activities. These fees are operating outflows but are non-core or pass-through items, not regular operating expenses manageable by the business’s own cost structure.
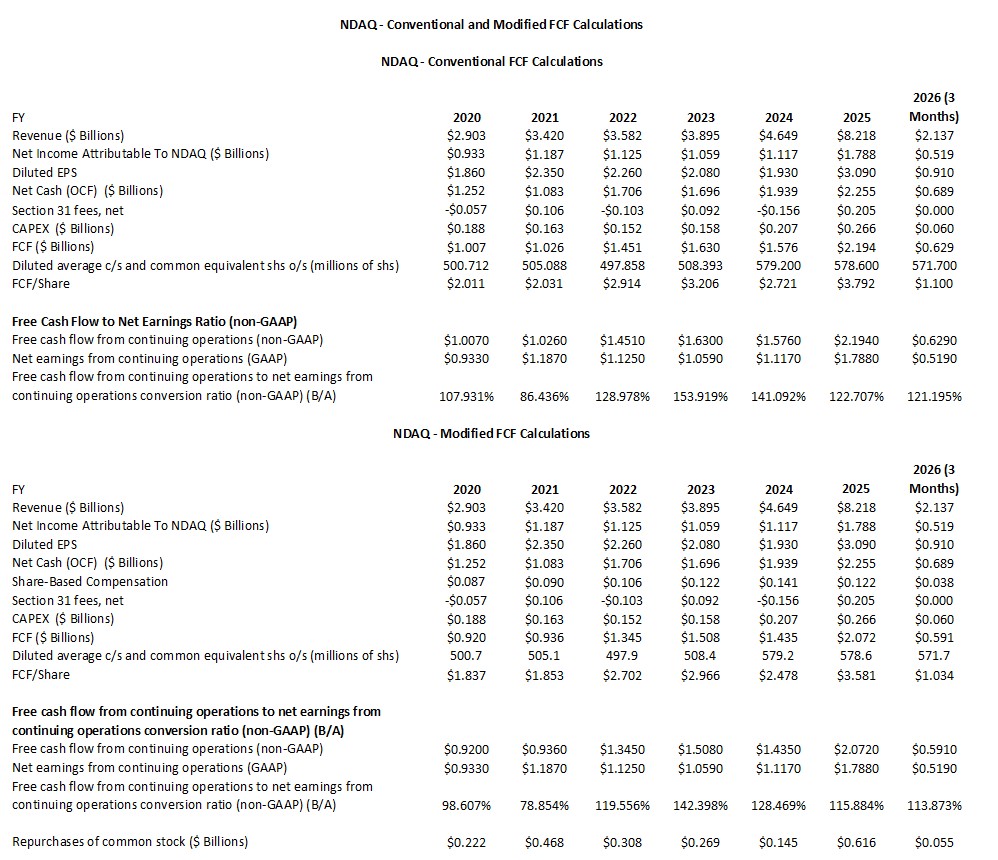
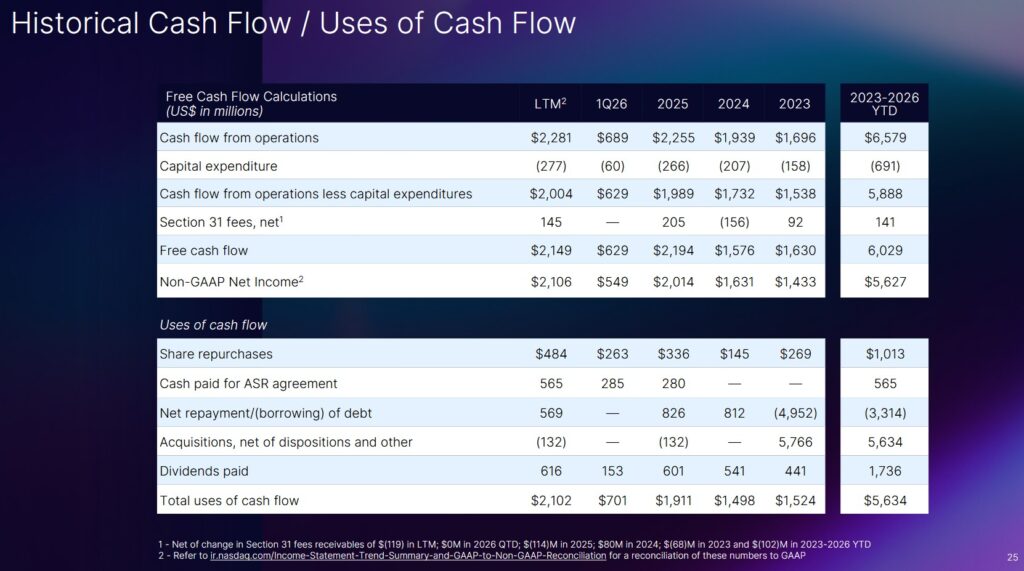
NOTE: Caution is warranted when comparing NDAQ’s Q1 2026 results (3 months) with those of prior fiscal years.
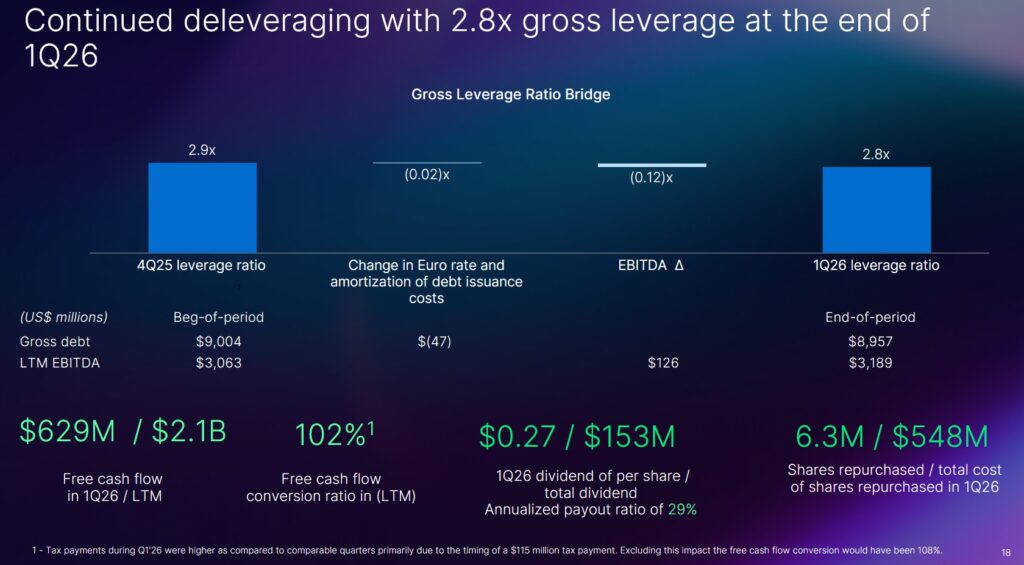
Based on NDAQ’s method of calculating FCF, it generated ~$0.629B in Q1 and $2.1B over the last 12 months. This, however, overstates the degree to which it generated FCF since it does not deduct SBC.
The following tables reflect NDAQ’s method of calculating FCF.
Return On Invested Capital (ROIC)
ROIC is calculated as (
High quality companies often generate a high ROIC. If a company generates a high ROIC, it needs to invest less to achieve a certain growth rate thus reducing the need for external capital.
When a company consistently generates a high ROIC over the long term and it is growing its revenue, it can reinvest a portion of its profits under favorable conditions thereby leading to a compounding effect. I would much rather invest in a growing company that can reinvest to create greater shareholder value than to invest in a company that has limited growth opportunities and thus chooses to distribute a growing dividend.
NDAQ’s financial performance over the last few fiscal years reveals a company in transition as it has shifted from a traditional exchange operator to a high-growth financial technology firm.
Below is the Return on Invested Capital (ROIC) and the estimated Weighted Average Cost of Capital (WACC).
| FY | ROIC (%) | WACC (%) | Economic Value Added (Spread) |
| 2025 | 12.50% | 9.20% | 3.30% |
| 2024 | 11.20% | 8.80% | 2.40% |
| 2023 | 10.80% | 8.10% | 2.70% |
| 2022 | 15.40% | 7.40% | 8.00% |
| 2021 | 17.20% | 5.30% | 11.90% |
| 2020 | 16.50% | 6.10% | 10.40% |
In FY2023 and FY2024, NDAQ’s ROIC dipped primarily because of the massive capital outlay for the $10.5B Adenza acquisition which I cover in prior posts. This significantly increased the ‘Invested Capital’ denominator of the ROIC formula while net operating profit (NOPAT) took time to scale, temporarily compressing returns.
Prior to 2023, NDAQ’s debt-to-equity was in the low 20% range. This, however, spiked to the mid 30% range with new notes having coupon rates in the 5.35% to 6.10% range.
Similar to other tech-heavy financial firms, NDAQ’s WACC rose from a low of 5.3% in 2021 to over 9% by 2025. This increase was driven by the global hike in interest rates and larger debt load.
The firm’s focus on an ‘accelerated deleveraging plan’, however, bodes well for an improvement in ROIC.
FY2026 Guidance
The following reflects NDAQ’s FY2026 guidance.
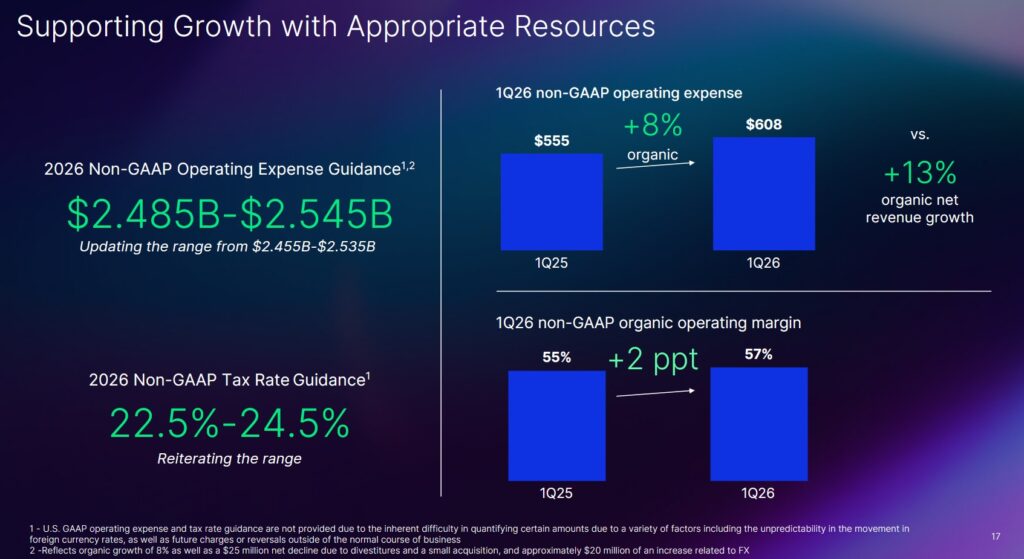
As noted in my prior post, the 2026 non-GAAP operating expense guidance reflects a non-GAAP organic growth rate of 7% at the midpoint. This includes the in-year benefit of net synergies action under NDAQ’s expanded cost program, a $25 million net decline due to divestiture and a small acquisition, and a nearly $20 million increase from FX, as well as a strong level of investments in growth and innovation, including AI.
The higher expense growth rate in Q2 versus Q1 is driven in part by the timing of NDAQ’s annual compensation cycle. This is consistent with the prior year.
Risk Assessment
NDAQ provides debt information on its website.
Moody’s lowered NDAQ’s long-term issuer rating to Baa2 from Baa1 in June 2023 when NDAQ announced it had signed an agreement to acquire Adenza Group. On March 31, 2025, Moody’s upgraded NDAQ’s domestic unsecured long-term debt credit rating from Baa2 to Baa1 with a stable outlook.
In November 2021, S&P Global raised NDAQ’s domestic unsecured long-term debt credit rating from BBB to BBB+ but then lowered it to BBB on June 12, 2023 for the same reason as Moody’s. On August 12, 2025, S&P Global raised NDAQ’s local currency long-term rating to BBB+ with a stable outlook from BBB with a positive outlook. The last review date is April 21, 2026.
Both ratings are the top tier of the lower medium grade investment grade category. The ratings define NDAQ as having adequate capacity to meet its financial commitments. However, adverse economic conditions or changing circumstances are more likely to lead to a weakened capacity of the obligor to meet its financial commitments.
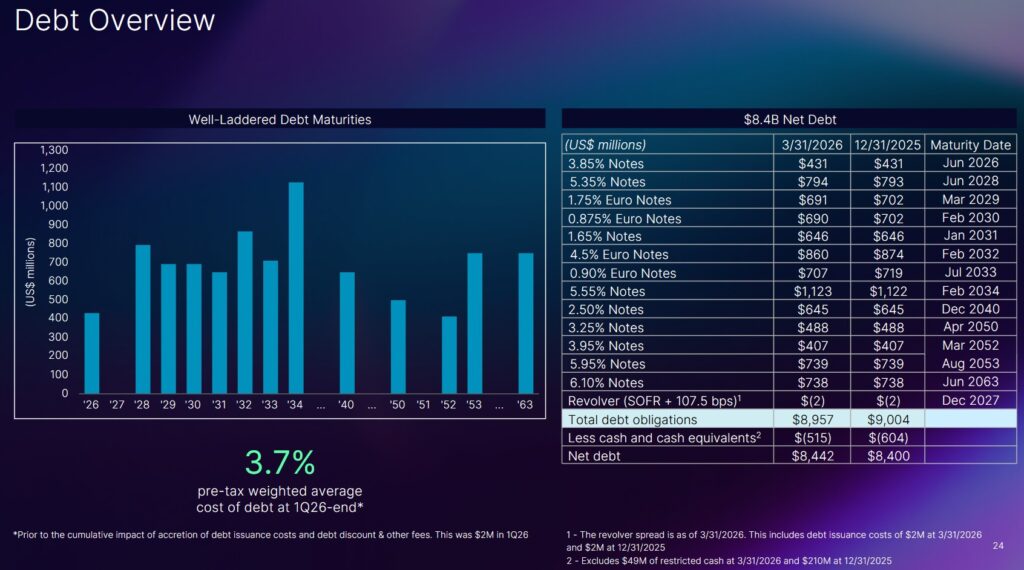
The following reflects NDAQ’s net debt position. On June 30, 2026, NDAQ will repay ~$0.431B of its debt. The next debt maturity is not until June 28, 2028.
Dividends, Share Repurchases, and Stock Splits
Dividend and Dividend Yield
NDAQ’s dividend history is accessible here.
NDAQ’s Board has just declared a $0.04/share increase in the regular quarterly dividend to $0.31/share. This dividend will be payable on June 26, 2026 to shareholders of record at the close of business on June 12, 2026.
Some investors pay particularly close attention to dividend metrics. The focus, however, should be ‘total potential investment return’.
Share Repurchases
The weighted-average common shares outstanding in FY2020 was 500.7 million. In Q4 2025 it was 576.5 and in Q1 2026 it was 571.7. The increase from FY2020 is the result of the issuance of shares to fund the major Verafin and Adenza acquisitions.
In February 2026, NDAQ’s Board authorized an increase to the share repurchase program, bringing the aggregate authorized amount to $3.0B. As of March 31, 2026, the remaining aggregate authorized amount under the existing share repurchase program was $2.9B.
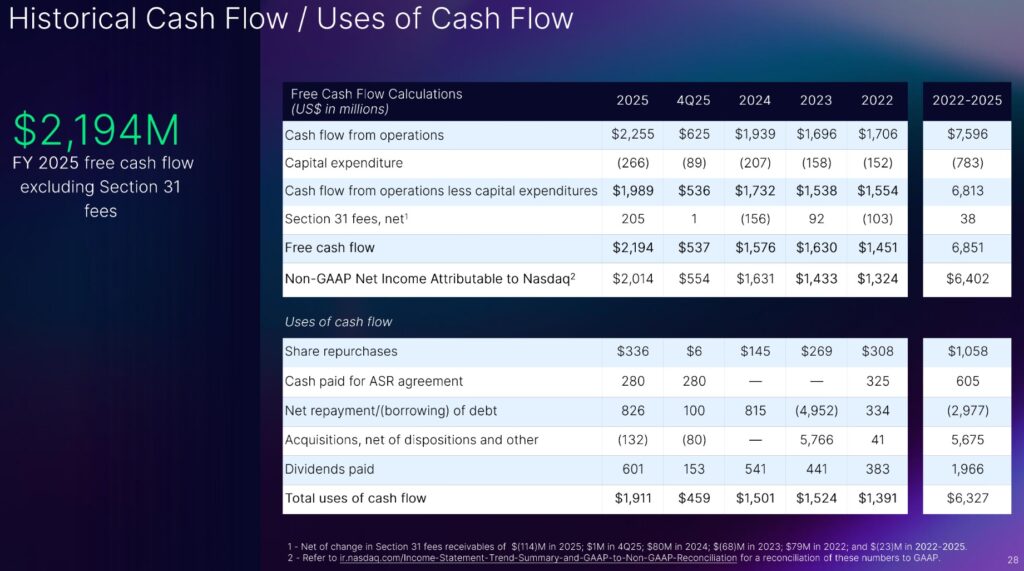
In Q1 2026, NDAQ took advantage of market volatility and accelerated its share repurchases. It repurchased $0.548B as compared to a total of $0.616B of repurchases in all of FY2025.
The table within the Conventional And Modified Free Cash Flow (FCF) Calculations (FY2020 – FY2025) section of this post reflects annual share repurchases in FY2020 – FY2025. In FY 2017 – FY2019, annual share repurchases amounted to ~$0.203B, ~$0.394B, and ~$0.2B.
Debt reduction has been a priority following the Adenza acquisition. NDAQ, however, has continued its share repurchases to offset employee stock compensation.
Now that the leverage target level has been reached, the vast majority of remaining FCF is to be applied toward share buybacks. In addition, management does not anticipate making any significant acquisition-related capital allocation decisions that would deter the company from sizable stock buybacks over the coming years.
Stock Splits
NDAQ initiated a 3 for 1 stock split in 2022.
Valuation
With shares currently trading at ~$89, NDAQ’s forward adjusted diluted PE levels are:
- FY2026 – 17 brokers – mean of $3.92 and low/high of $3.80 – $4.03. Using the mean estimate, the forward-adjusted diluted PE is ~22.7.
- FY2027 – 17 brokers – mean of $4.41 and low/high of $4.33 – $4.50. Using the mean estimate, the forward-adjusted diluted PE is ~20.2.
- FY2028 – 9 brokers – mean of $5.01 and low/high of $4.85 – $5.16. Using the mean estimate, the forward-adjusted diluted PE is ~17.8.
In FY2025, NDAQ generated ~$3.79 and $3.58 of FCF/share calculated using the conventional and modified methods. If NDAQ can generate ~$3.90 and ~$3.65 in FY2026, the forward P/FCF using a ~$89 share price is ~22.8 and ~24.9.
NDAQ’s FCF conversion ratio has been greater than GAAP and non-GAAP earnings in recent years. It is not surprising, therefore, that NDAQ’s valuation using FCF is slightly superior.
In my January 30, 2026 post I wrote:
NDAQ’s January 29, 2026 closing share price is ~$98.09. Using the current forward adjusted diluted EPS broker estimates, NDAQ’s forward adjusted diluted PE levels are:
- FY2026 – 16 brokers – mean of $3.87 and low/high of $3.73 – $4.07. Using the mean estimate, the forward-adjusted diluted PE is ~25.3.
- FY2027 – 14 brokers – mean of $4.34 and low/high of $4.13 – $4.55. Using the mean estimate, the forward-adjusted diluted PE is ~22.6.
- FY2028 – 4 brokers – mean of $4.96 and low/high of $4.75 – $5.19. Using the mean estimate, the forward-adjusted diluted PE is ~19.8.
In FY2025, NDAQ generated ~$3.79 and $3.58 of FCF/share calculated using the conventional and modified methods. If NDAQ can generate ~$3.90 and ~$3.65 in FY2026, the forward P/FCF using a ~$98.09 share price is ~25.2 and ~26.9.
NDAQ’s FCF conversion ratio has been greater than GAAP and non-GAAP earnings in recent years. It is not surprising, therefore, that NDAQ’s valuation using FCF is slightly superior.
Final Thoughts
My final thoughts are unchanged from those in my January 30, 2026 post. The only difference is that my NDAQ exposure currently consists of 616.17445 shares in a ‘Core’ account in the FFJ Portfolio versus the prior 614.4797 shares. The automatic reinvestment of dividend income explains the reason for the nominal increase.
Shares have generally been overvalued for at least a decade with the exception of a brief period in 2022 and most of 2023 when shares were slightly undervalued.
NDAQ’s leverage target level has been reached and a larger percentage of excess FCF is available for deployment toward share repurchases.
I consider NDAQ’s current valuation to be fair but have no immediate plans to increase my exposure.
I wish you much success on your journey to financial freedom!
Note: Please send any feedback, corrections, or questions to finfreejourney@gmail.com.
Disclosure: I am long NDAQ.
Disclaimer: I do not know your circumstances and do not provide individualized advice or recommendations. I encourage you to make investment decisions by conducting your research and due diligence. Consult your financial advisor about your specific situation.
I wrote this article myself and it expresses my own opinions. I do not receive compensation for it and have no business relationship with any company mentioned in this article.