![]()
I last reviewed Moody’s (MCO) in this February 25, 2026 post at which time the most current financial information was for Q4 and FY2025. On April 22, 2026, MCO released its Q1 2026 results and revised FY2026 outlook making this an opportune time to revisit this existing holding.
Business Overview
Moody’s Analytics (MA)
- research and insights;
- data and information; and
- decision solutions
Moody’s Investor Services (MIS)
MIS includes MCO’s ratings business. It makes up ~66% of the firm’s adjusted operating income.
This business segment publishes credit ratings and provides assessment services on a wide range of debt obligations, programs and facilities, and the entities that issue such obligations in markets worldwide, including various corporate, financial institution and governmental obligations, and structured finance securities.
Bond issuance volume is a key driver for this business segment. A reasonable expectation for this business segment over the long-term is for high-single-digit revenue growth that is driven by GDP and pricing.
NOTE: A more comprehensive explanation of MCO’s operations are found in Part 1 Item 1 in the FY2025 Form 10-K (SEC Filings section of the company’s website).
Financials
Q1 2026 Results
Material pertaining to MCO’s Q1 2026 results is accessible here.
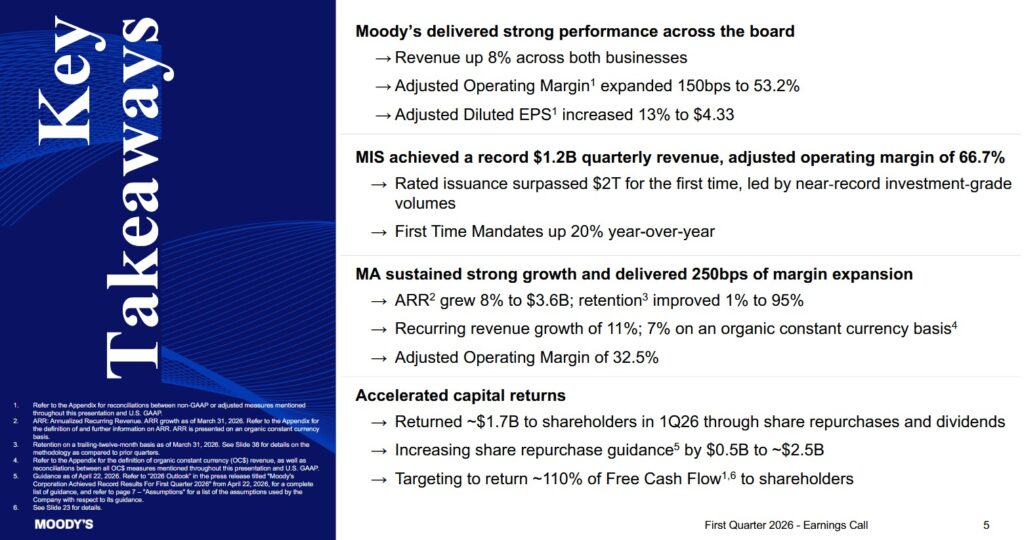
The following is a very high level overview of MCO’s Q1 2026 results.
Strategic Divestiture
MCO has executed a strategic divestiture of its Learning Solutions business (formerly known as Omega Performance and MA Knowledge Services) and is in the final stages of exiting its Regulatory Solutions business (scheduled to occur on April 30, 2026). These moves are part of a broader portfolio-shaping strategy to pivot Moody’s Analytics (MA) away from transactional, legacy services toward high-margin, AI-driven subscription models.
During the FYE2025 Earnings Call on February 18, 2026, management clarified that these units no longer aligned with the company’s focus on decision-grade connected intelligence.
The financial impact of these divestitures is the reason behind the 54% drop in MA transactional revenue reported in Q1 2026. While they reduce total revenue in the short term, the changes result in MCO expanding its Adjusted Operating Margin to 53.2% by removing lower-margin, labor-intensive business lines.
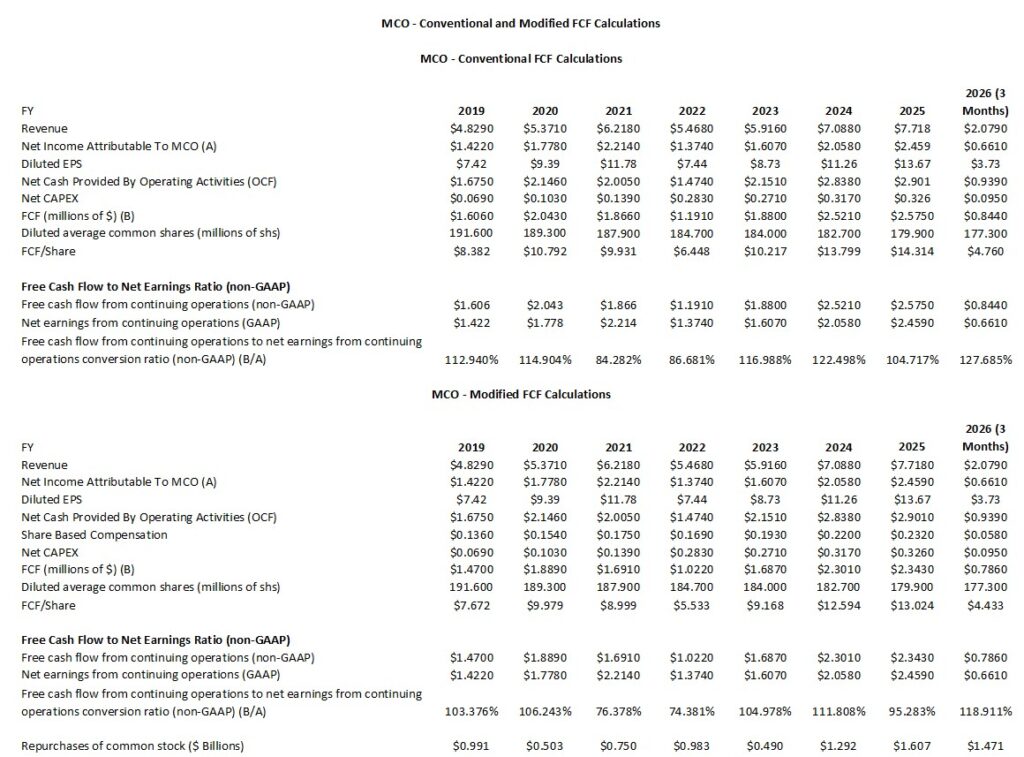
Conventional And Modified Free Cash Flow (FCF) Calculations (FY2019 – FY2025 and Q1 2026)
Since FCF is a non-GAAP measure, there is no consistency in its calculation. In several previous posts I explain my rationale for deducting stock-based compensation (SBC) to determine a company’s FCF. I, therefore, provide calculations using the:
- conventional method where only CAPEX is deducted from OCF; and
- more conservative modified method where I also deduct SBC.
Capital Allocation
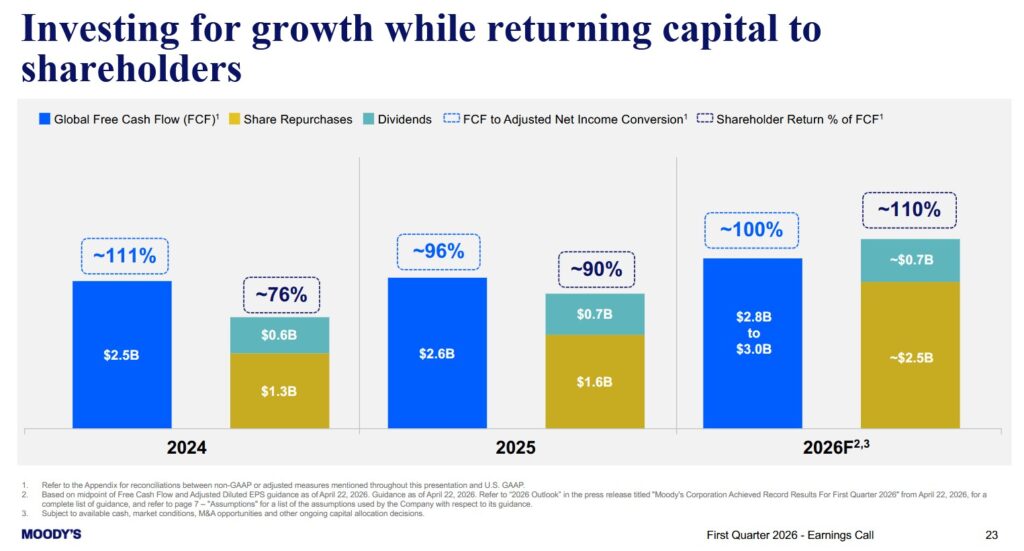
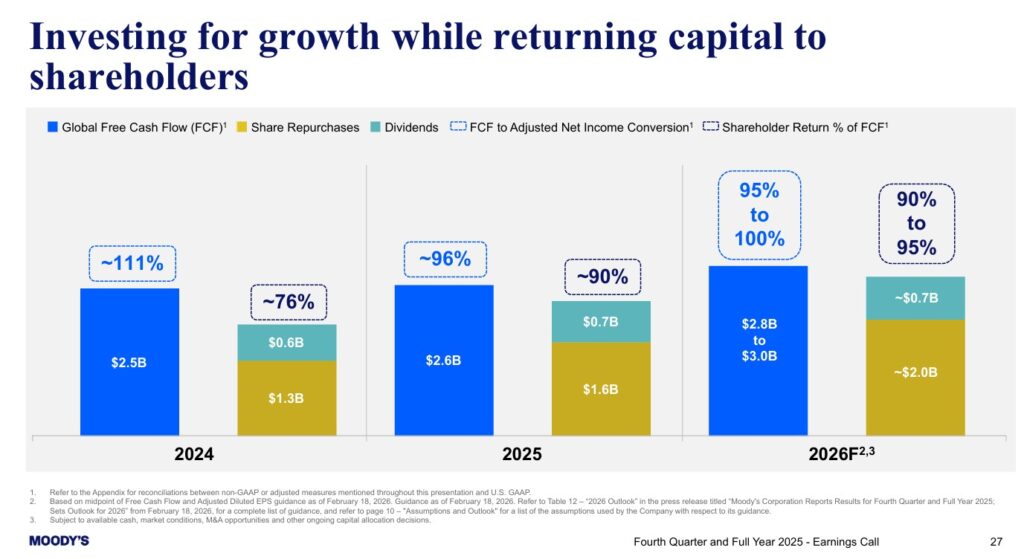
The following reflects MCO’s capital allocation in FY2024 and FY2025 and the FY2026 forecast. MCO does not deduct SBC when calculating FCF.
The following reflects what MCO provided with the release of FY2025 results.
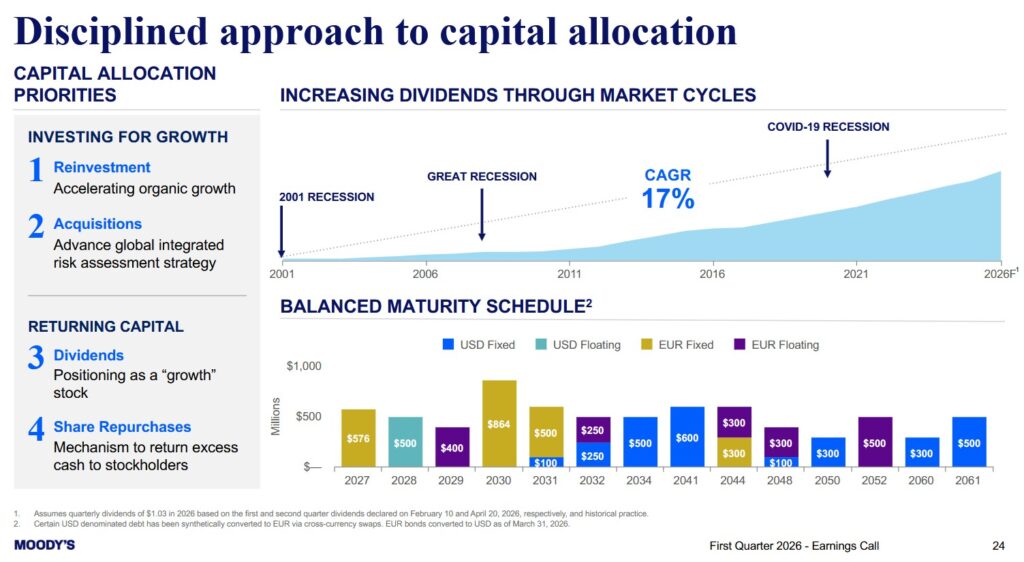
The following reflects MCO’s capital allocation priorities.
ROIC and WACC
Return on Invested Capital (ROIC) provides an indication of a company’s efficiency. In essence, is a company actually creating value or ‘burning’ cash for the sake of growth?
A company with a higher ROIC is mathematically worth more because it requires less reinvestment to achieve that growth.
A good indication of how well a company is performing is to compare ROIC to the Weighted Average Cost of Capital (WACC). WACC, however, is not a metric officially reported by MCO but it can be roughly estimated based on the company’s credit profile and market conditions.
The generally accepted high-level formula used by Wall Street is:
ROIC = NOPAT/Average Invested Capital
with the Net Operating Profit After Tax (NOPAT) formula being Operating Income (EBIT) x (1-tax rate)
This shows how much profit the core business makes while ignoring how much debt the company has.
The Average Invested Capital is the total money tied up in the business.
- The Operating Approach formula is
- The Financing Approach is
One shortcoming with ROIC is that it is a non-GAAP metric meaning the input data plugged into the ROIC formula is inconsistent.
MCO consistently maintains a positive ROIC spread, meaning it generates returns significantly higher than its cost of capital. The 2019 – 2025 time frame, however, has been marked by significant volatility in capital markets thus directly impacting MCO.
A freeze in debt issuance following aggressive interest rate hikes led to a plunge in MCO’s economic spread in 2022. In FY2024 and FY2025, however, MCO experienced a recovery. This resurgence was driven by companies needing to refinance existing debt, which boosted MCO’s ROIC above 20%.
MCO’s FY2025 ROIC has stabilized near its historical mean as the Moody’s Analytics (MA) segment continues its streak of over 68 consecutive quarters of expansion, providing a high-margin recurring revenue hedge against the more cyclical ratings business.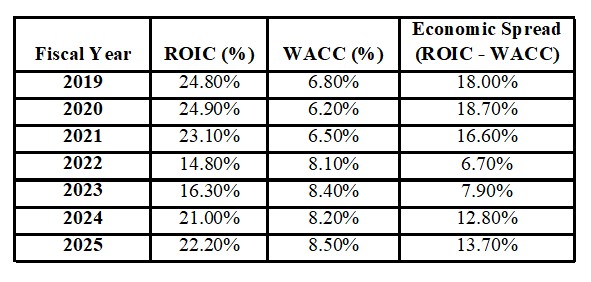
FY2026 Guidance
The following reflects MCO’s current and prior FY2026 guidance. The significant changes in FY2026 guidance is primarily attributed to an expected gain from the anticipated divestiture of the MA Regulatory Solutions business which is expected to close at the end of April 2026.
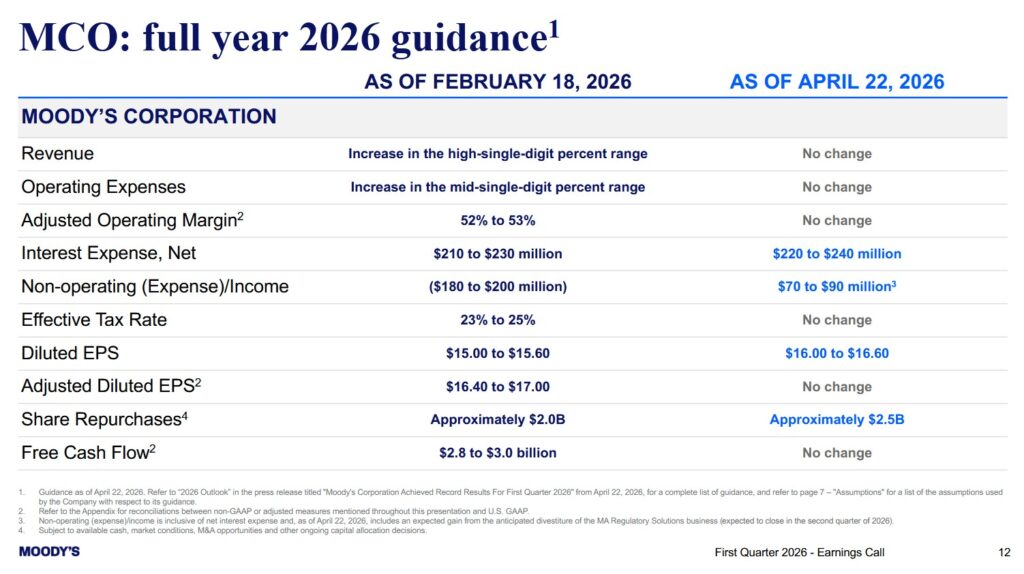
MCO’s FY2026 CAPEX will increase by ~$0.1B from ~$0.326B in FY2025. This increase is primarily for the build-out of new headquarters in New York and London.
On the Q4 2025 earnings call, management provided an upbeat forecast for the coming year, signaling that they expect the ‘refinancing wall’ and AI investments to continue fueling growth. The expectation is that 2026 issuance will be front-loaded with ~55% of the year’s total issuance occurring in the first half of the year.
In response to analysts questioning how AI engagement is translating into actual revenue, management responded that while AI is currently ‘deepening share of wallet’ with large strategic clients, they expect broader monetization as modular ‘AI agents’ are rolled out.
Some in the investment community have concerns about AI firms replicating MCO’s business. On the earnings call, management emphasized that regulated institutions require ‘trusted, decision-grade data’ that AI startups lack.
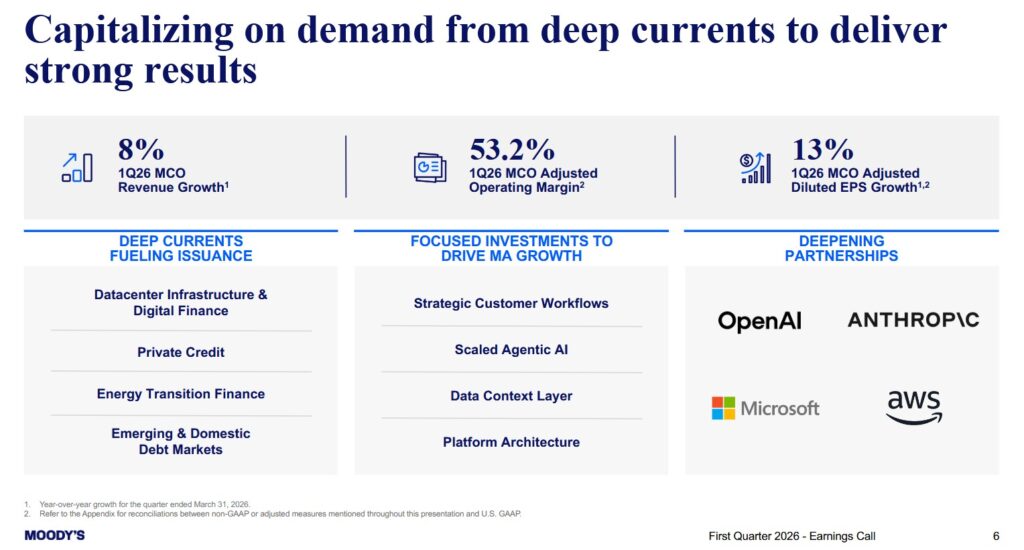
Despite the near-term dynamics, MCO remains confident about the demand for its solutions. The deep currents that underpin the demand for its solutions are the:
- evolution of capital markets including private credit;
- digital transformation and automation in financial services industries;
- need to know more about with whom you are conducting business;
- financial impact of extreme weather events; and
- transformative power of generative AI and the tremendous opportunities available from proprietary data.
Risk Assessment
There is no change to MCO’s senior unsecured domestic long-term debt ratings and outlook.
- S&P Global – A- with a stable outlook upgraded from BBB+ on December 23, 2025 and last reviewed on January 20, 2026; and
- Fitch – BBB+ with a stable outlook (last reviewed and affirmed on February 12, 2026)
S&P Global’s rating is one tier higher than that accorded by Fitch.
S&P Global’s rating is the bottom tier of the upper medium grade investment grade category. This rating defines MCO as having a strong capacity to meet its financial commitments. It is, however, somewhat more susceptible to the adverse effects of changes in circumstances and economic conditions than obligors in higher-rated categories.
Fitch’s rating is the top tier of the lower medium grade investment grade category. It defines MCO as having an adequate capacity to meet its financial commitments. However, adverse economic conditions or changing circumstances are more likely to lead to a weakened capacity of the obligor to meet its financial commitments.
The following schedule of total indebtedness is from page 32 of 72 in the Q1 2026 Form 10-Q.
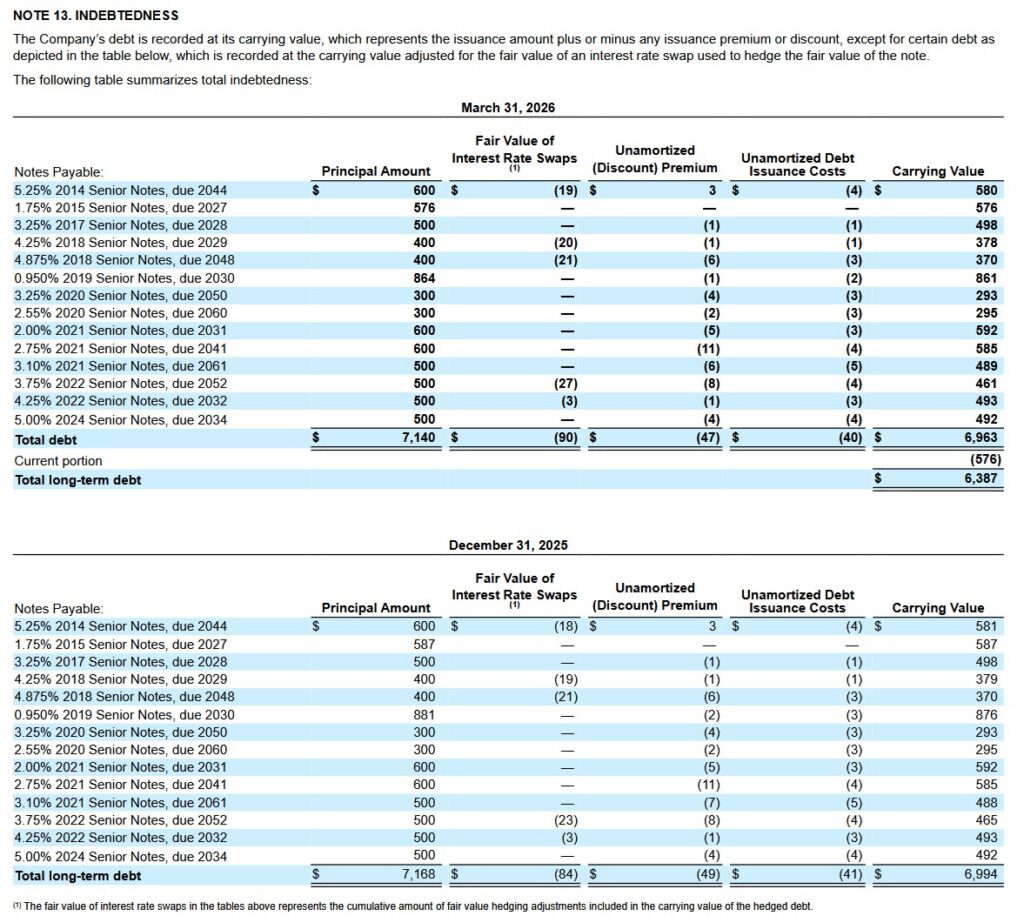
The rating assigned to each indebtedness is accessible here.
MCO’s credit risk is acceptable from my perspective.
Dividend and Dividend Yield
Dividend distributions are MCO’s 3rd capital allocation priority.
On April 22, 2026, MCO’s Board declared its second consecutive quarterly dividend of $1.03/share payable on June 5, 2026.
MCO’s dividend history reflects annual dividend increases starting in 2011 following a dividend freeze that was precipitated by challenging business conditions during The Financial Crisis.
MCO is a ‘growth’ stock. The unappealing dividend metrics, therefore, may dissuade some investors from investing in the company. Investors, however, should focus on an investment’s total potential return.
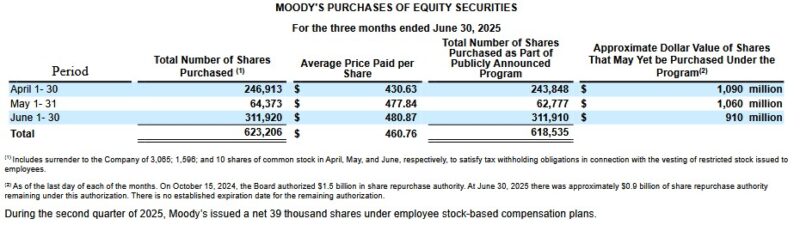
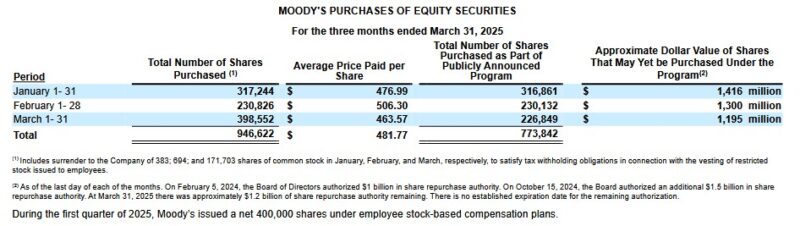
MCO actively repurchased shares in Q1 2026. It returned ~$1.7B to shareholders through a combination of share repurchases and dividends. Following shares repurchases of ~$1.5B in Q1, MCO is increasing its FY2026 repurchase guidance from $2B to $2.5B with ~110% of FCF to be returned to shareholders by FYE2026.
By offloading the Learning Solutions and Regulatory Solutions segments, MCO is reallocating capital toward its $2.5B share buyback program and its integration with enterprise AI platforms like Microsoft 365 Copilot and Claude.
MCO’s diluted weighted average number of shares outstanding during FY2019 – FY2025 (in millions of shares) are reflected in the table provided in the Conventional And Modified Free Cash Flow (FCF) Calculations (FY2019 – FY2025) section of this post.
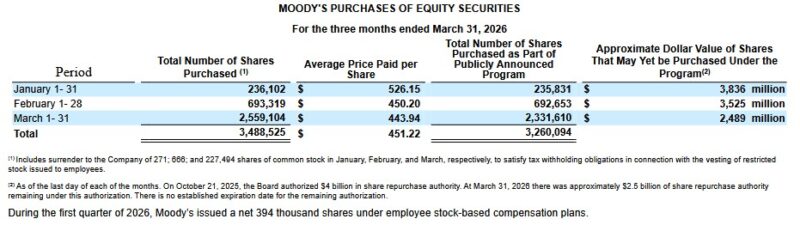
On October 21, 2025, MCO’s Board authorized $4.0B in share repurchase authority.
At March 31, 2026, MCO had ~$2.489B of remaining authority under this authorization. There is no established expiration date for the remaining authorization.
Within the next couple of quarters, I anticipate MCO’s Board will authorize an increase in the share repurchase authority.
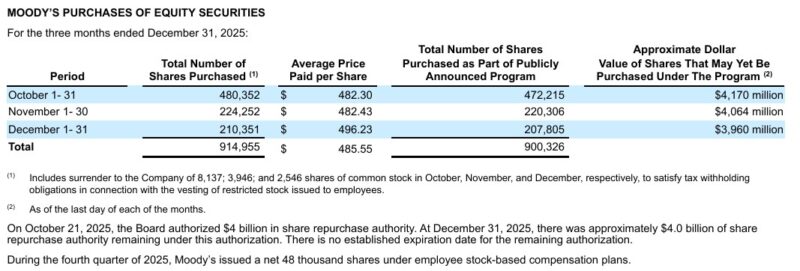
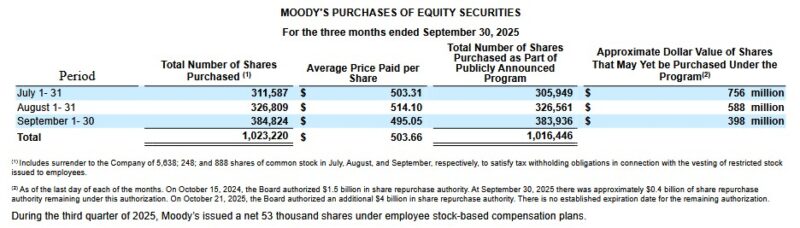
The following reflects MCO’s share repurchases in recent quarters.
Valuation
On April 27, 2026, MCO’s share price closed at $460.74. Using management’s FY2026 $16.00 – $16.60 diluted EPS outlook, the forward diluted PE range is ~27.8 – ~28.8. The FY2026 adjusted diluted EPS outlook is $16.40 – $17.00 giving us a ~27.1 – ~28.1 forward adjusted diluted PE range.
The forward valuations using the currently available adjusted diluted broker estimates are:
- FY2026 – 24 brokers – mean of $16.67 and low/high of $16.03 – $16.86. Using the mean estimate, the forward adjusted diluted PE is ~27.6.
- FY2027 – 24 brokers – mean of $18.61 and low/high of $17.74 – $19.78. Using the mean estimate, the forward adjusted diluted PE is ~24.8.
- FY2028 – 13 brokers – mean of $20.62 and low/high of $19.05 – $22.24. Using the mean estimate, the forward adjusted diluted PE is ~22.3.
Management’s FY2026 FCF guidance is ~$2.8B – ~$3.0B. Using the ~$2.9B mid-point and my FY2026 ~$0.255B SBC estimate, the modified FCF is $2.645B.
The diluted weighted average number of outstanding shares in FY2025 was 179.9 million. MCO’s FY2026 forecast calls for share repurchases totaling $2.5B, up from the prior ~$2B. If it repurchases shares at an average purchase price of ~$500, this amounts to 5 million shares. The timing of the purchases, the average purchase price, and the number of shares issued as part of MCO’s various employee compensation programs will impact the weighted average diluted shares outstanding.
The weighted average diluted shares outstanding in FY2025 was 179.9 million and 177.3 million in Q1 2026. If MCO repurchases $2B of its shares at an average price of $480, this amounts to ~4.167 million shares. SBC in FY2026 is likely to be ~$0.255B (up from ~$0.232B in FY2025). It is quite possible that MCO’s weighted average diluted shares outstanding in FY2026 could be ~174 million.
Using the ~$2.9B mid-point of management’s FY2026 FCF guidance and 174 million shares, MCO could generate ~$16.67 of FCF/share. Divide the current ~$460.74 share price by ~$16.67 and the P/FCF estimate is ~27.6.
If we deduct ~$0.255B of SBC from $2.9B, we get ~$2.645B of modified FCF. Assuming 174 million outstanding shares and we get giving us ~$15.20 of FCF/share. Divide the current ~$460.74 share price by ~$15.20 and the P/FCF estimate is ~30.3.
In my February 25, 2026 post I wrote:
On February 25, 2026, MCO’s share price closed at $463.37. Using management’s FY2026 $15.00 – $15.60 diluted EPS outlook, the forward diluted PE range is ~29.7 – ~30.9. The FY2026 adjusted diluted EPS outlook is $16.40 – $17.00 giving us a ~27.3 – ~28.3 forward adjusted diluted PE range.
The forward valuations using the currently available adjusted diluted broker estimates are:
- FY2026 – 24 brokers – mean of $16.67 and low/high of $16.03 – $16.92. Using the mean estimate, the forward adjusted diluted PE is ~27.8.
- FY2027 – 23 brokers – mean of $18.68 and low/high of $17.94 – $19.65. Using the mean estimate, the forward adjusted diluted PE is ~24.8.
- FY2028 – 11 brokers – mean of $20.52 and low/high of $19.09 – $22.29. Using the mean estimate, the forward adjusted diluted PE is ~22.6.
Management’s FY2026 FCF guidance is ~$2.8B – ~$3.0B. Using the ~$2.9B mid-point and my FY2026 ~$0.255B SBC estimate, the modified FCF is $2.645B.
The diluted weighted average number of outstanding shares in FY2025 was 179.9 million. MCO’s FY2026 forecast calls for share repurchases totaling at least ~$2B. If it repurchases shares at an average purchase price of ~$500, this amounts to 4 million shares. The timing of the purchases, the average purchase price, and the number of shares issued as part of MCO’s various employee compensation programs will impact the weighted average diluted shares outstanding.
I prefer to err on the side of caution and estimate the weighted average diluted shares outstanding will only drop by 2 million shares. This is reasonably consistent with the reduction in the diluted weighted average shares outstanding over the past few years.
Using the ~$2.9B mid-point of management’s FY2026 FCF guidance and 177 million shares, I anticipate MCO will generate ~$16.38 of FCF/share. Divide the current ~$463.37 share price by ~$16.38 and the P/FCF estimate is ~28.3.
If we deduct ~$0.255B of SBC from $2.9B, we get ~$2.645B of modified FCF and 177 million shares giving us ~$14.94 of FCF/share. Divide the current ~$463.37 share price by ~$14.94 and the P/FCF estimate is ~31.
Final Thoughts
At the time of my 2025 Year-End Investment Holdings Review, MCO’s share price was $510.85. I held 410 shares in a ‘Core’ account in the FFJ Portfolio and it was my 21st largest holding.
In the early weeks of 2026, MCO’s share price experienced a pullback that was driven primarily driven by high valuations, geopolitical shocks, and negative analyst sentiment regarding the broader ratings sector. As mentioned in my prior post, MCO’s share price plunged from a 52 week high of $546.88 reached in mid-January 2026 to ~$412 on February 11 before recovering to $463.37 at the February 25, 2026 market close.
Given the improvement in MCO’s valuation I opportunistically acquired:
- 100 shares @ $463.88128 on February 4, 2026 in the same ‘Core’ account; and
- 40 shares @ $412.63 on February 11, 2026 in the same account.
bringing my MCO exposure to 550 shares. With the subsequent automatic reinvestment of dividend income my MCO exposure is now 551.11729 shares.
At the time of my prior review, I considered ~$530 – ~$540 to be a fair price range. Given the heightened level of volatility and uncertainty that has arisen subsequent to my prior post, I am lowering my fair value estimate to ~$490 – ~$500.
I wish you much success on your journey to financial freedom!
Note: Thanks for reading this article. Please send any feedback, corrections, or questions to finfreejourney@gmail.com.
Disclosure: I am long MCO.
Disclaimer: I do not know your circumstances and am not providing individualized advice or recommendations. I encourage you not to make any investment decisions without conducting your research and due diligence. You should also consult your financial advisor about your specific situation.
I wrote this article myself and it expresses my own opinions. I am not receiving compensation for it and have no business relationship with any company whose stock is mentioned in this article.