![]()
In this December 7, 2024 post I disclose the sale of 162 Broadridge Financial Solutions (BR) shares @ $231.4316/share on December 3, 2024 as part of our Registered Retirement Savings Plans (RRSP) meltdown strategy. I sold shares because I considered them to be richly valued.
Following this sale, BR went from being my 9th largest holding when I completed my 2023 Year End FFJ Portfolio Review to not being a top 30 holding when I completed my 2024 Mid Year FFJ Portfolio Review nor when I completed subsequent semi-annual reviews. The most recent semi-annual review (December 31, 2025) is accessible here.
Following that December 3, 2024 sale, BR’s share price experienced a run-up to ~$272 in August 2025. Fast forward to February 5, 2026, however, and the closing share price is ~$193.50.
We now have BR’s Q2 and YTD2026 financial results and FY2026 outlook thus prompting me to revisit this existing holding.
Business Overview
BR has two business segments:
- Investor Communication Solutions (ICS); and
- Global Technology and Operations (GTO).
Both segments are highly competitive.
The majority of BR’s clients operate in the financial services industry. Its largest single client in FY2021, FY2022, FY2023, FY2024, and FY2025 accounted for ~6%, ~7%, ~7%, ~8%, and ~7% of consolidated revenues.
Part 1 Item 1 in the FY2025 Form 10-K is a good source of information to learn about the company.
The November 3, 2025 Investor Presentation is also an excellent source of information.
Acquisitions
BR has grown organically and through a series of acquisitions following its spin-off from Automatic Data Processing (ADP) on March 30, 2007. These acquisitions have focused on expanding BR’s wealth management footprint in Canada, enhancing digital communications in Europe, and integrating ‘agentic’ AI into post-trade workflows.
The following are key acquisitions and strategic investments in FY2024 – YTD206.
FY2024 (July 1, 2023 – June 30, 2024)
- AdvisorTarget: The acquisition of a market leader in financial advisor behavioral data has enabled BR to combine advisor intent data with its existing asset-holding insights, helping asset managers target sales more effectively.
- Kyndryl Securities Industry Services (SIS): BR reached an agreement to acquire this Canadian wealth and capital markets technology platform. This was a major strategic move to strengthen its position as a leading technology provider in the Canadian financial services market.
FY2025 (July 1, 2024 – June 30, 2025)
- CompSci Resources: This was acquired at the very start of FY2025. CompSci provides cloud-based SEC disclosure and XBRL tagging software. It was integrated into BR’s regulatory filing suite to simplify complex reporting for public companies and funds.
- Kyndryl SIS: The acquisition of the SIS platform from Kyndryl resulted in moving thousands of accounts and significant back-office processing for Canadian brokerages into BR’s ecosystem.
- Uptiq: BR made a strategic minority investment in this AI platform to enhance its ‘Wealth Lending Network’, using AI to automate securities-based lending workflows.
FY2026 (July 1, 2025 – Present)
- Acolin: A major acquisition of a Zurich-based leader in European cross-border fund distribution and regulatory services significantly expands BR’s capabilities for asset managers looking to enter new European markets.
- iJoin: BR acquired this retirement plan technology provider to enhance its 401(k) and retirement servicing capabilities, specifically focusing on participant onboarding and data-driven engagement.
- Signal: The acquisition of this UK-based customer communications specialist will globalize BR’s digital communications solutions beyond North America and into the UK and European financial sectors.
- DeepSee: BR made a strategic investment in DeepSee to harness ‘Agentic AI’. This partnership aims to automate complex post-trade operations and manual workflows using AI agents.
Financials
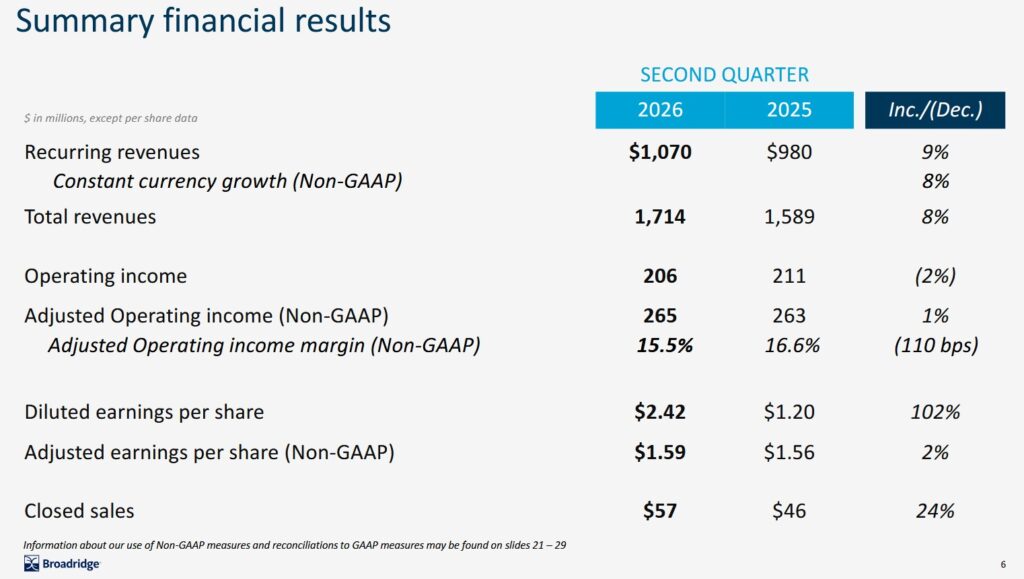
Q2 and YTD2026 Results
Material related to BR’s Q2 and YTD2026 is accessible here. The second half of BR’s fiscal year is typically much stronger, and therefore, investors should not read too much into these results.
Conventional And Modified Free Cash Flow (FCF) Calculations (FY2019 – YTD2026)
Free Cash Flow (FCF) is a non-GAAP metric meaning there is no standardization in its calculation. In several posts I express my thoughts on the method by which many companies calculate it. Most companies merely deduct net CAPEX from net cash flows from operating activities. I, however, think it is also necessary to deduct share based compensation (SBC).
Many companies employ SBC as part of their employee compensation plans. Because SBC involves no cash outlay, companies add back SBC to determine net cash flows from operating activities in the Condensed Consolidated Statement of Cash Flows.
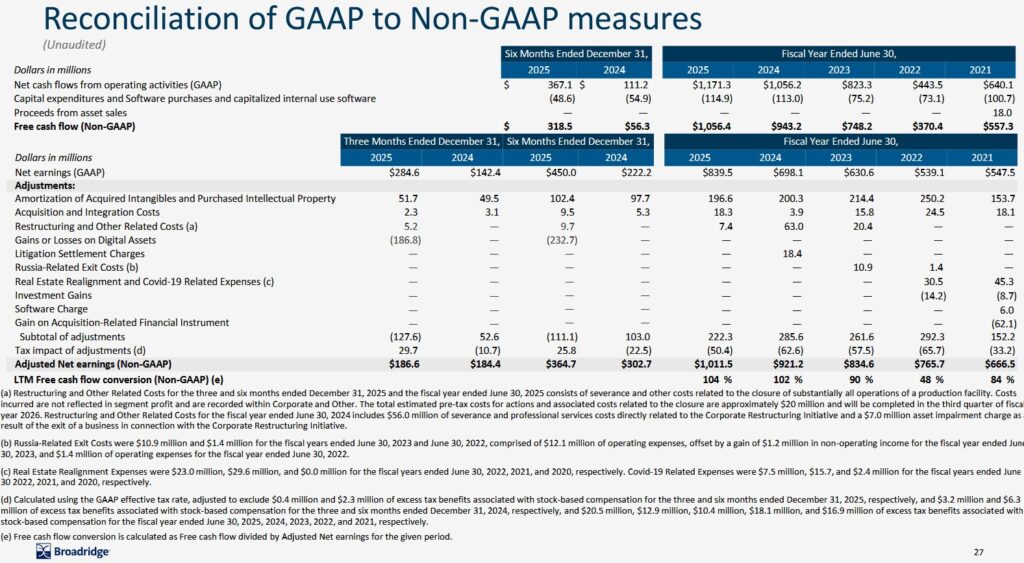
The following table reflects data extracted from the FY2019 – YTD2026 SEC Filings that are accessible here. The modified FCF calculations deduct share based compensation (SBC) from total operating cash provided by continuing operations.
Many companies employ the use of share based compensation (SBC) as part of their employee compensation plans. This cost is reflected in the Income Statement. Because SBC involves no cash outlay, however, we add back SBC to determine Net cash flows from operating activities.
Suppose, BR were to compensate their employees 100% by way of SBC. Since there is no cash outlay, we must add back the full amount of its employee compensation in the Condensed Consolidated Statement of Cash Flows to determine Net cash flows from operating activities.
If, on the other hand, BR were to have no SBC and were to disburse funds to pay its employees, we would add nothing back in the Condensed Consolidated Statement of Cash Flows.
By merely changing the manner in which it compensates its employees we get very different Net cash flows from operating activities! How does this make any sense? Is the use of SBC not a form of ‘financing’? Would it be more proper to reflect SBC within the Cash Flows From Financing Activities section of the Condensed Consolidated Statement of Cash Flows? This way, FCF would not be distorted.
In the Q2 2026 Form 10-Q we see the following on page 27 of 64.
The following reflects FCF using the ‘conventional’ method and my ‘modified’ version.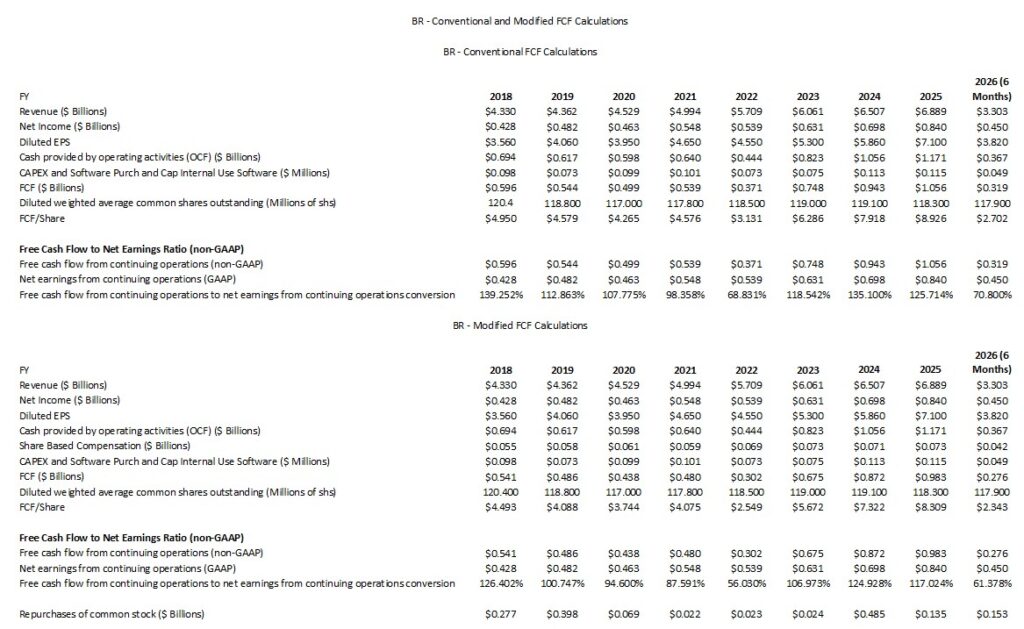
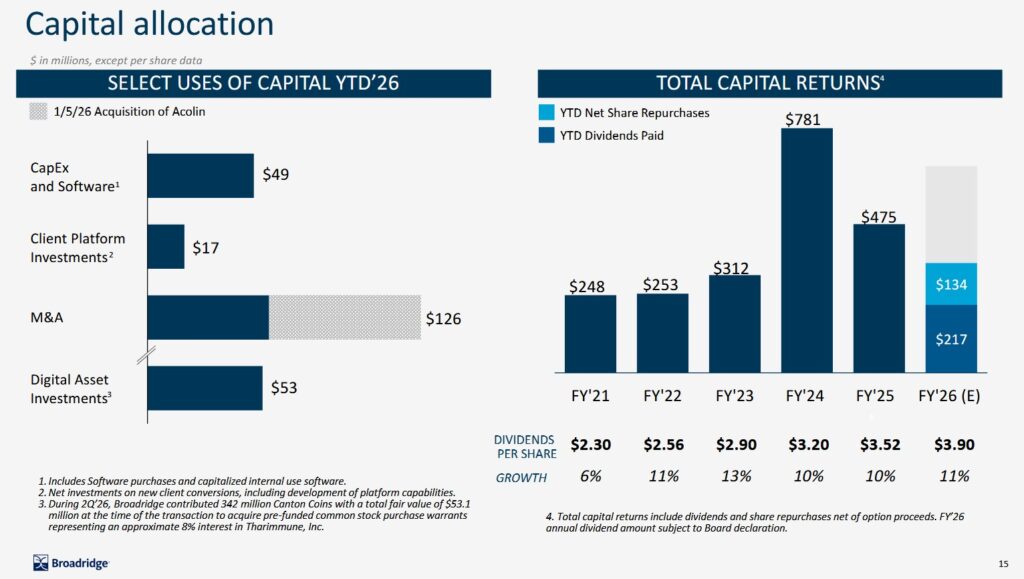
Capital Allocation
The following reflects BR’s capital allocation in FY2021 – YTD2026.
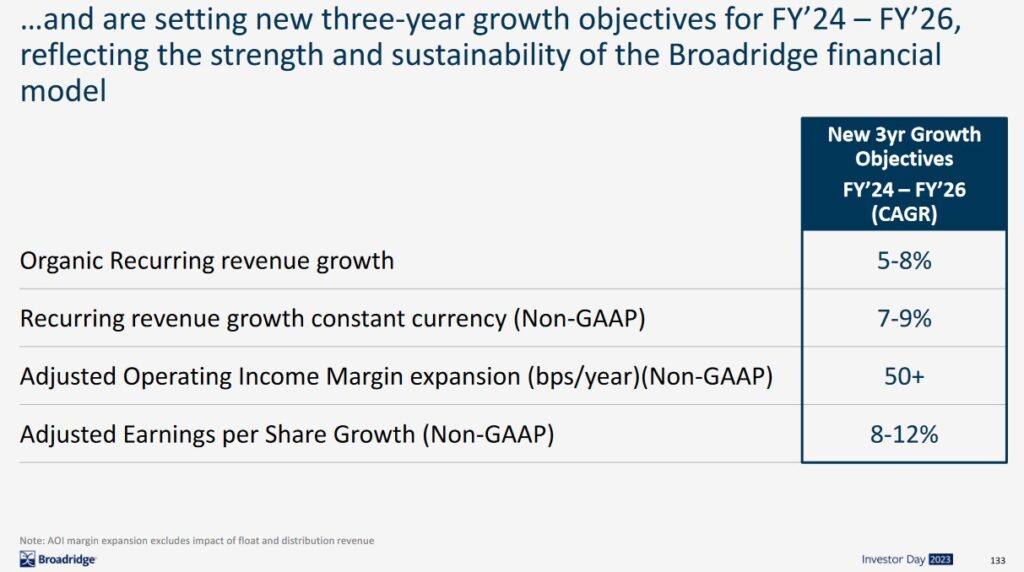
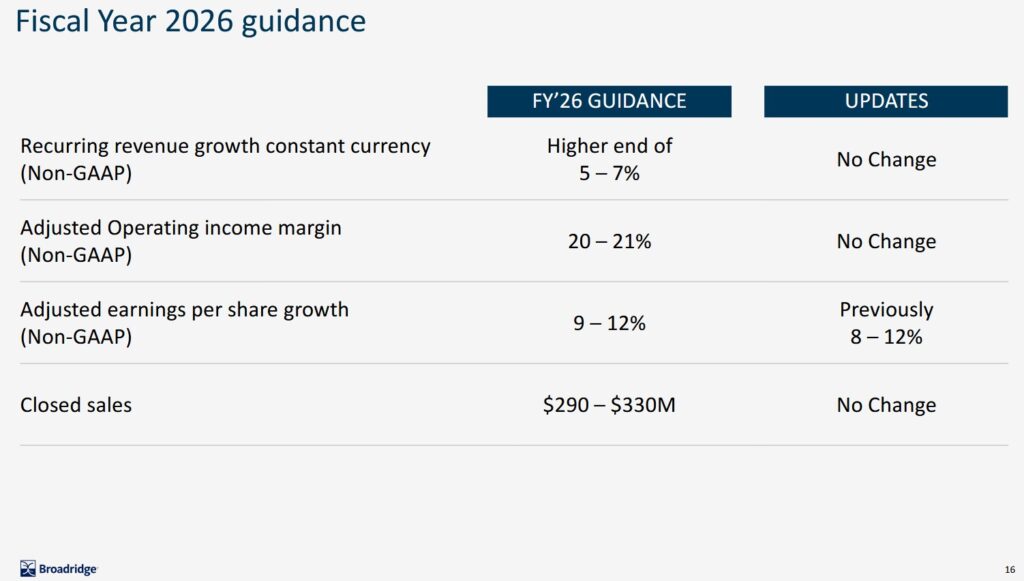
FY2026 Guidance
The following reflects BR’s current and prior FY2026 guidance.
ROIC and WACC
Return on Invested Capital (ROIC) provides an indication of a company’s efficiency. In essence, is a company actually creating value or ‘burning’ cash for the sake of growth?
A company with a higher ROIC is mathematically worth more because it requires less reinvestment to achieve that growth.
A good indication of how well a company is performing is to compare ROIC to the Weighted Average Cost of Capital (WACC).
The generally accepted high-level formula used by Wall Street is:
ROIC = NOPAT/Average Invested Capital
with the Net Operating Profit After Tax (NOPAT) formula being Operating Income (EBIT) x (1-tax rate)
This shows how much profit the core business makes while ignoring how much debt the company has.
The Average Invested Capital is the total money tied up in the business.
- The Operating Approach formula is
- The Financing Approach is
One shortcoming with ROIC is that it is a non-GAAP metric meaning the input data plugged into the ROIC formula is inconsistent.
BR’s ROIC in in the last 5 fiscal years has been in the low teens (~10% – ~13%). Its WACC during this period, however, has been ~7% – ~9% with the annual ROIC typically being ~3% – ~5% above the annual WACC.
BR’s ROIC dipped just below 10% in FY2022 because of the integration of ‘Itiviti’ which BR acquired for ~$2.5B. Large acquisitions often temporarily lower ROIC as the ‘Invested Capital’ base jumps before the full synergies and profits are realized.
The rise in WACC from FY2022 to FY2024 (~7.4% to ~8.8%) reflects the broader macroeconomic environment where aggressive interest rate hikes by the Federal Reserve increased the cost of debt for most corporations.
With a ROIC exceeding WACC, BR is successfully creating shareholder value. BR’s transition toward digital governance and modernized wealth management is yielding higher marginal returns than the cost of the capital required to build BR’s platforms.
Risk Assessment
Note 11 within the Q2 2025 Form 10-Q starting on page 24 of 64 has details of BR’s credit facilities.
Future principal payments on BR’s outstanding debt is $0.5B in June 2026 and then $0 in FY2027 – FY2029. Roughly $935.1B matures in FY2030.
BR’s domestic senior unsecured debt ratings are the top tier of the lower-medium grade investment-grade category. There is no change from the time of my last review.
- Moody’s: Baa2 with a stable outlook. This rating was affirmed on March 24, 2025;
- S&P Global: BBB with a stable outlook. This rating was affirmed on January 21, 2026;
- Fitch: BBB+ and a stable outlook and affirmed on June 4, 2025.
These ratings define BR as having an ADEQUATE capacity to meet its financial commitments. Adverse economic conditions or changing circumstances, however, are more likely to lead to a weakened capacity of the obligor to meet its financial commitments.
BR’s credit risk remains acceptable for my purposes.
Dividends and Share Repurchases
Dividend and Dividend Yield
BR’s dividend history is accessible here.
It would be wise to focus on an investment’s total potential shareholder return. Nevertheless, investors might be interested in knowing whether BR can continue to increase its dividend beyond 19 consecutive years.
BR generates more than enough FCF to support its dividend. It only uses a relatively small portion of its annual cash flow to fund the payouts, leaving plenty of room for acquisitions and share repurchases.
BR typically maintains a payout ratio of roughly 35 – 45% of its FCF.
Relying on quarterly reports to determine BR’s dividend coverage is ill-advised because BR’s business is highly seasonal. It generates the majority of its cash during the April – June ‘Proxy Season’.
The company’s high percentage of recurring revenue (~75%) provides a reliable floor for the cash flow that funds dividends and share repurchases.
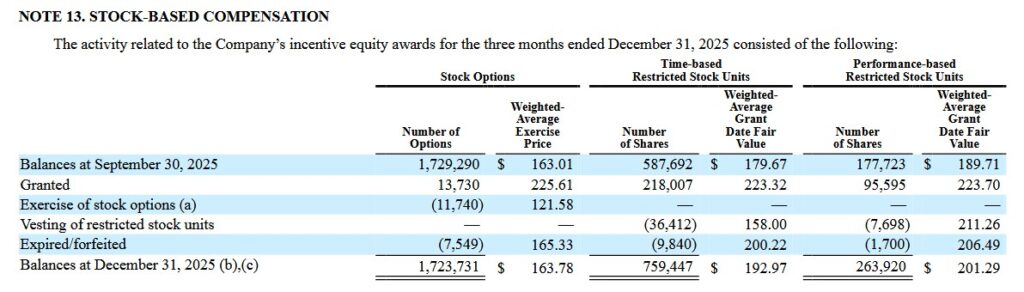
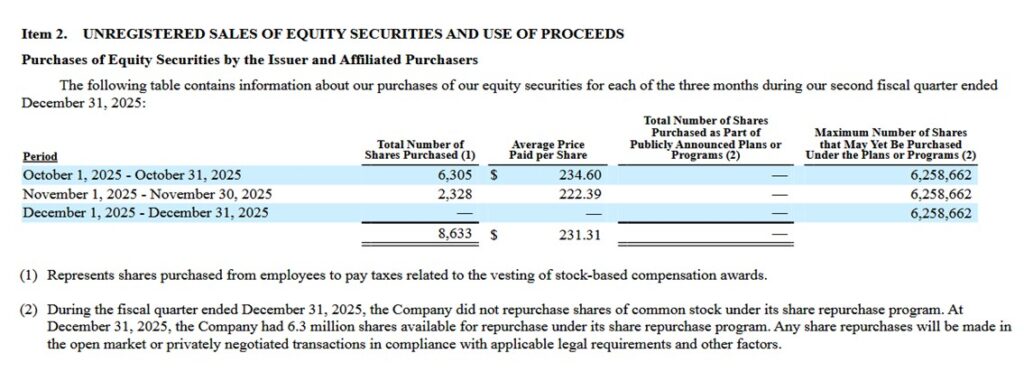
Share Repurchases
The weighted average shares outstanding in FY2012 (millions rounded) was 128. In Q2 and YTD2026 it was 117.7 and 117.9, respectively.
The following reflects BR’s share repurchase activity in Q2 2026. The average purchase price in Q2 2026 is well in excess of the current ~$193.30 share price.
Valuation
The current share price is ~$193.50. The FY2026 outlook calls for 8% – 12% growth in non-GAAP EPS from ~$8.55 in FY2025. This translates into a Forward Adjusted Diluted EPS range of ~ $9.23 – ~$9.58 (a ~$9.41 mid-point) thus giving us a forward adjusted diluted PE of ~20.2 – ~21.
BR’s valuation using the current broker guidance is:
- FY2026 – 8 brokers – mean of $9.48 and low/high of $9.40 – $9.56. Using the mean, the forward adjusted diluted PE is ~20.4.
- FY2027 – 9 brokers – mean of $10.24 and low/high of $10.15 – $10.53. Using the mean, the forward adjusted diluted PE is ~18.9.
- FY2028 – 6 brokers – mean of $11.39 and low/high of $11.14 – $11.71. Using the mean, the forward adjusted diluted PE is ~17.
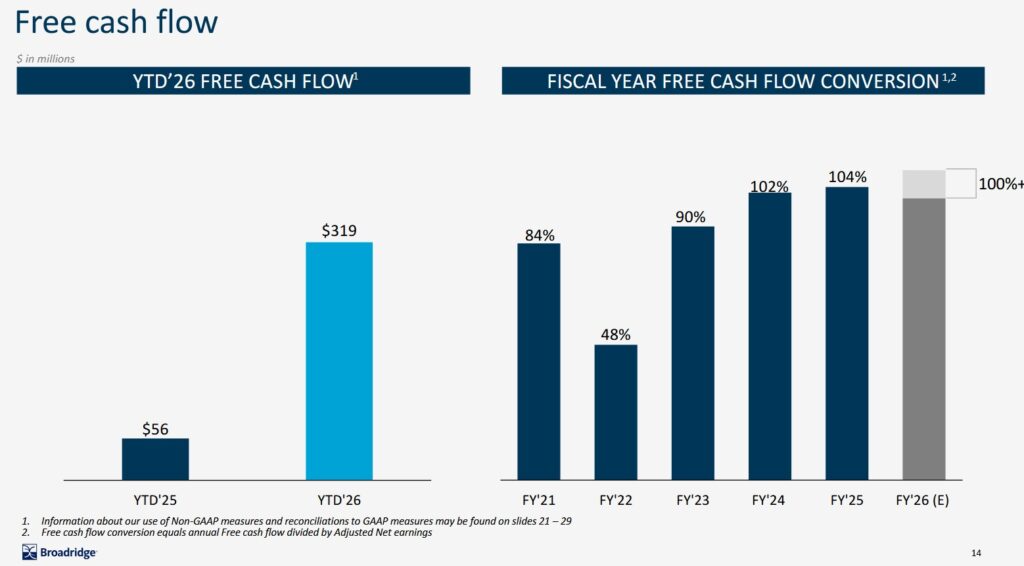
There is an improvement in BR’s FCF conversion ratio in recent years with a ratio in excess of 100%. Although the YTD2026 FCF conversion ratio is well below 100%, BR generates stronger results in the second half of its fiscal year.
In FY2025, BR’s $7.10 Diluted EPS was ~83% of its $8.55 in Adjusted Diluted EPS. If we use a similar ratio for FY2026, BR’s diluted EPS should be ~$7.81 or ~83% of the ~$9.41 mid-point of FY2026 adjusted diluted EPS. If the FCF/Diluted EPS ratio is 110% of ~$7.81, FCF/share should be ~$8.60.
With shares trading at ~$193.50, the forward P/FCF ratio is ~22.5 (~$193.50/~$8.60). For comparison, this is what I wrote in my December 7, 2024 post:
When I wrote my August 7, 2024 post, BR had just reported FY2024 GAAP EPS and non-GAAP EPS of $5.86 and $7.73. Using the August 6 $218.55 closing share price, the diluted PE and adjusted diluted PE were ~37.3 and ~28.3.
The FY2025 outlook called for 8% – 12% growth in non-GAAP EPS or ~$8.35 – ~$8.66 thus giving us a forward adjusted diluted PE of ~25.2 – ~26.2.
BR’s valuation using the current broker guidance at the time was:
- FY2025 – 6 brokers – mean of $8.44 and low/high of $8.35 – $8.56. Using the mean, the forward adjusted diluted PE is ~25.9.
- FY2026 – 6 brokers – mean of $9.27 and low/high of $9.16 – $9.42. Using the mean, the forward adjusted diluted PE was ~23.6.
- FY2027 – 1 brokers – mean of $10.10 and low/high of $10.10 – $10.10. Using the mean, the forward adjusted diluted PE was ~21.6.
Using FCF in the manner BR calculates it, the FY2025 FCF target was ~95% – ~105%.
If the FCF conversion ended up being 95% of the non-GAAP EPS FY2025 outlook of ~$8.35 – ~$8.66, the FY2025 FCF range was ~$7.93 – ~$8.23. With shares trading at ~$218.55, the forward P/FCF range was ~26.6 – ~27.6.
If the FCF conversion ended up being 105% of the non-GAAP EPS FY2025 outlook of ~$8.35 – ~$8.66, the FY2025 FCF range was ~$8.77 – ~$9.09. With shares trading at ~$218.55, the forward P/FCF range was ~24 – ~25.
In my December 7, 2024 post I also state:
BR has recently released its Q1 2025 results in which it reported $0.68 and $1.00 of diluted EPS and adjusted diluted EPS. I estimate it will generate ~$8.35 – ~$8.66 if it meets its FY2025 8% – 12% growth in non-GAAP EPS guidance. On this basis, the forward adjusted diluted PE using the current $235.43 share price is ~27.2 – ~28.2.
BR’s valuation using the current broker guidance is:
- FY2025 – 8 brokers – mean of $8.52 and low/high of $8.45 – $8.57. Using the mean, the forward adjusted diluted PE is ~27.6.
- FY2026 – 8 brokers – mean of $9.37 and low/high of $9.20 – $9.51. Using the mean, the forward adjusted diluted PE is ~25.1.
- FY2027 – 6 brokers – mean of $10.33 and low/high of $10.03 – $10.53. Using the mean, the forward adjusted diluted PE is ~22.8.
If the FCF conversion ends up being 95% of the non-GAAP EPS FY2025 outlook of ~$8.35 – ~$8.66, the FY2025 FCF range is ~$7.93 – ~$8.23. With shares trading at ~$235.43, the forward P/FCF range is ~29 – ~30.
If the FCF conversion ends up being 105% of the non-GAAP EPS FY2025 outlook of ~$8.35 – ~$8.66, the FY2025 FCF range is ~$8.77 – ~$9.09. With shares trading at ~$235.43, the forward P/FCF range is ~26 – ~27.
Using the more conservative approach in calculating FCF where we deduct SBC, we readily know that the P/FCF will be higher than reflected above.
Final Thoughts
My exposure is 288.06867 shares at an average cost of $149.0841 in a ‘Core’ account in the FFJ Portfolio.
I currently consider shares to be undervalued. A fair price appears to be ~$217 when we use:
- the ~$9.41 mid-point of management’s FY2026 adjusted diluted EPS outlook; and
- an adjusted diluted PE of ~23 .
A ~110% FCF conversion ratio (modified method) gives us FCF of ~$10.35 (~$9.41 x 110%). Divide ~$217 by ~$10.35 and the forward P/FCF is ~21.
I am refraining from increasing my BR exposure so as to maintain sufficient liquidity to invest in other companies.
I wish you much success on your journey to financial freedom!
Note: Please send any feedback, corrections, or questions to finfreejourney@gmail.com.
Disclosure: I am long BR.
Disclaimer: I do not know your circumstances and do not provide individualized advice or recommendations. I encourage you to make investment decisions by conducting your research and due diligence. Consult your financial advisor about your specific situation.
I wrote this article myself and it expresses my own opinions. I do not receive compensation for it and have no business relationship with any company mentioned in this article.
[…] Strong & Stable: Canada’s Blue Chip Powerhouses by Dylan Callaghan at Stocktrades CanadaBroadridge Is Attractively Valued by Charles Fournier at Financial Freedom Is A JourneyAres Capital: When Things Get Shaky, You Have […]