![]()
I last reviewed Agilent (A) in this August 28, 2025 post, at which time the most current financial information was for Q3 and YTD2025. I now revisit this existing holding given the release of Q4 and FYE2025 results and Q1 and FY2026 outlook on November 24.
Business Overview
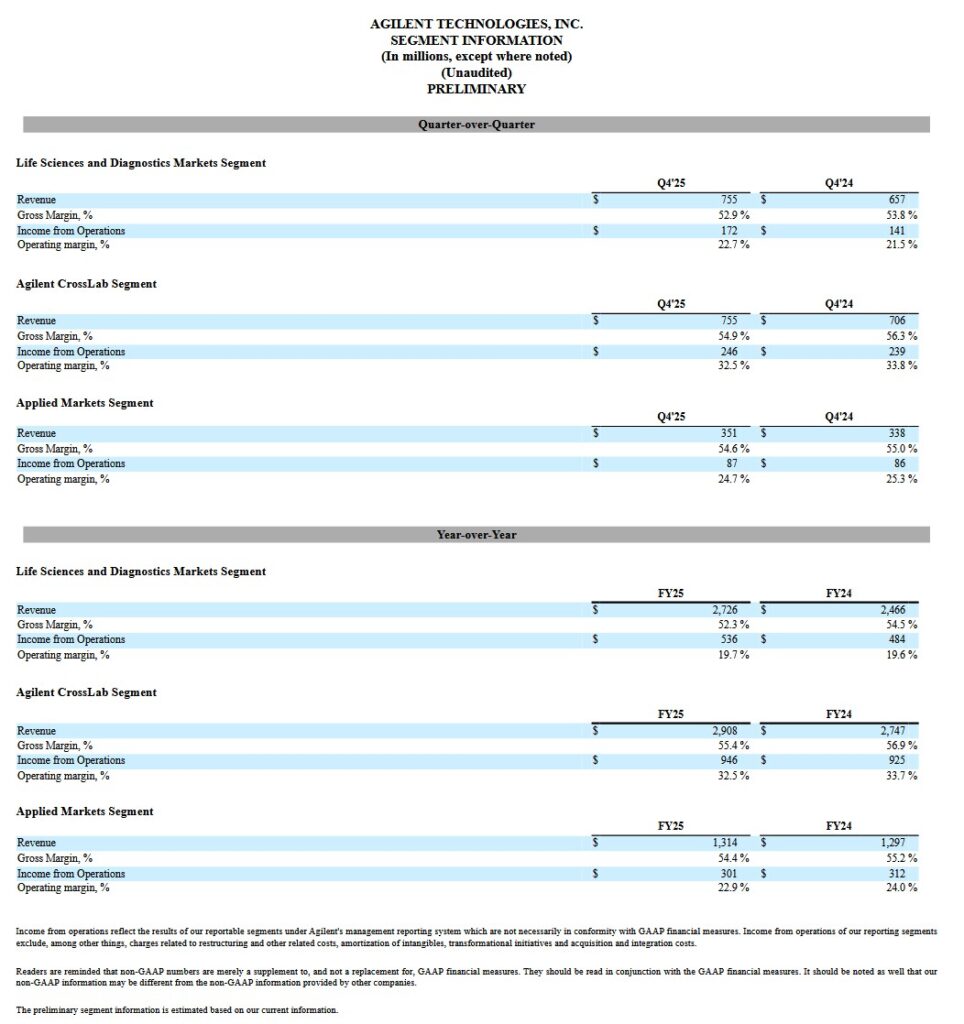
A has the following 3 reportable business segments:
- life sciences and applied markets (LDG);
- applied markets (AMG); and
- Agilent CrossLab (ACG).
Item 1 within the FY2024 Form 10-K, (see SEC Filings) has a comprehensive overview of the business and each segment plus the risk factors. The company’s website also includes a wealth of information.
Ignite Operating System
A introduced its Ignite Operating System (IOS) in early 2025. The purpose of this system is to accelerate profitable growth and operational excellence across the company. It serves as an enterprise-wide transformation framework that simplifies global processes, reduces complexity, builds a more agile value chain, and enhances commercial execution. In essence, the purpose is to unlock operating efficiencies, fuel innovation, and quickly develop and implement actionable plans by assembling knowledge across the organization.
The system fosters closer collaboration among business units to deliver innovative solutions more rapidly and tailor offerings to customer needs. Ultimately, the aim is to create long-term value for customers, shareholders, and employees by making the company more nimble, responsive, and effective in dynamic market environments.
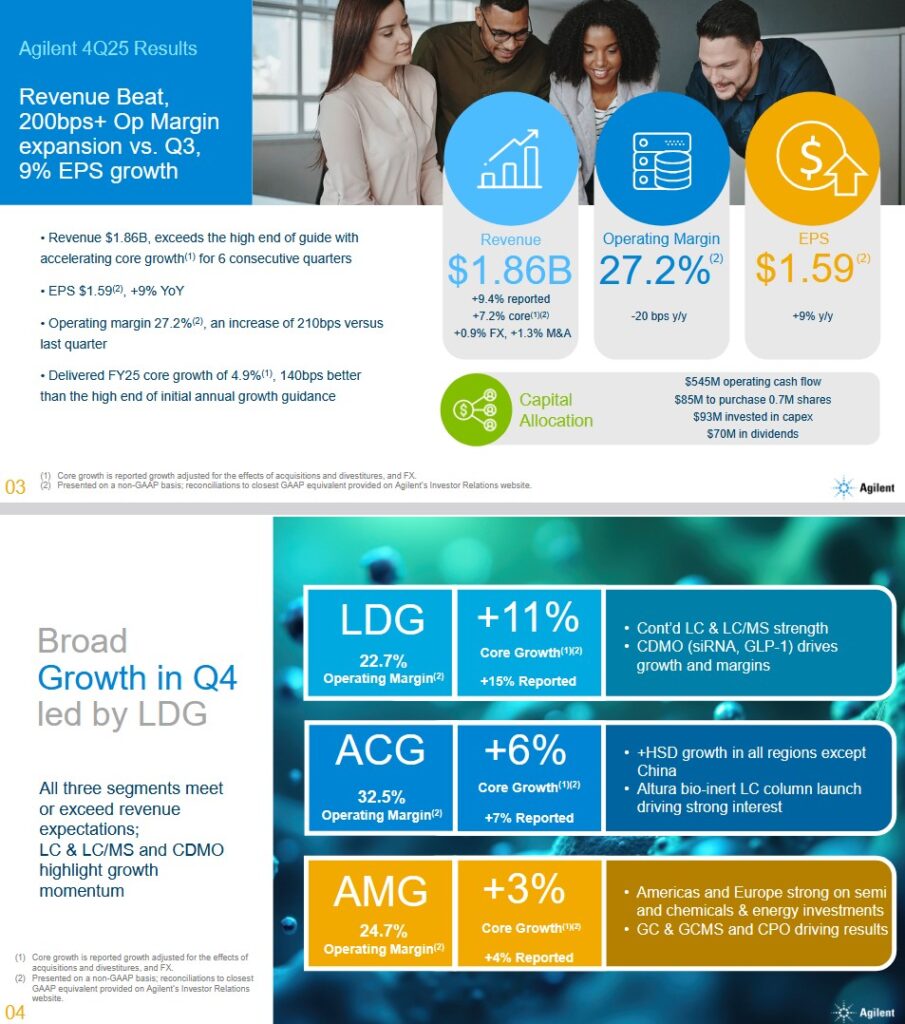
On the Q4 earnings call, management states that Ignite has already delivered over ~$0.15B in annualized savings. In addition, management expects Ignite to help pricing to continue to improve with an opportunity to grow well above 100 bps.
Financials
Q4 and FY2025 Results
Material related to the Q4 and FY2025 earnings release is accessible here.
Operating Cash Flow (OCF), Free Cash Flow (FCF), and CAPEX
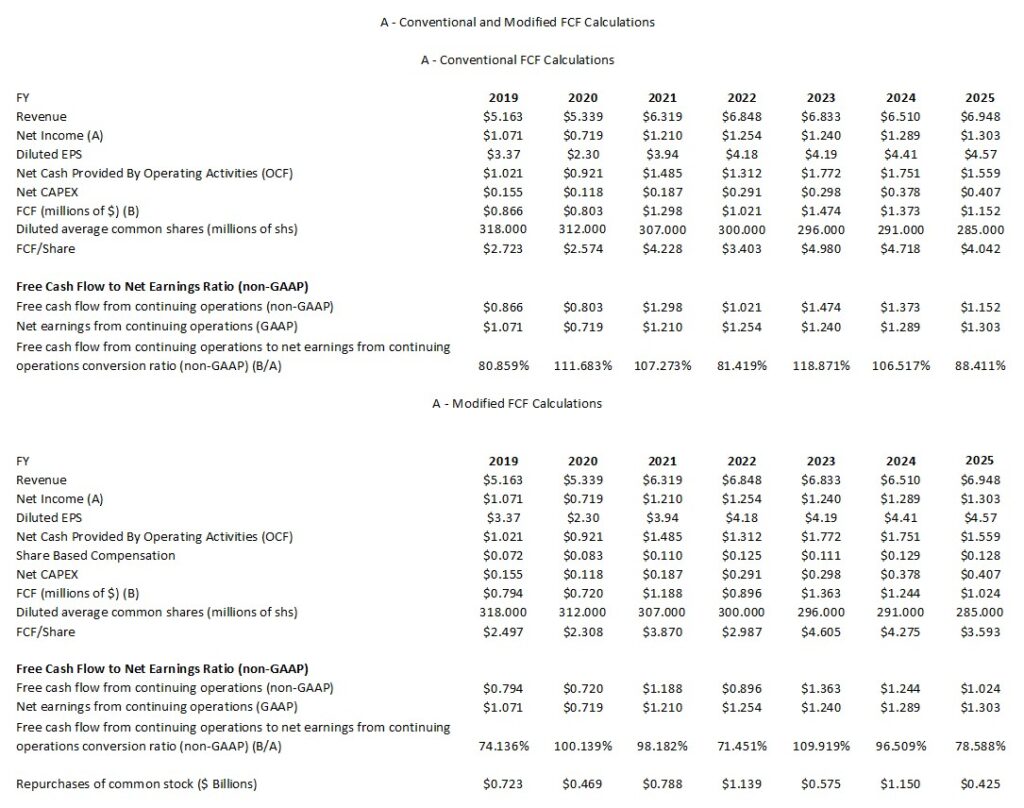
In prior posts I explain my rationale for deducting share-based compensation (SBC) from a company’s OCF to determine FCF. The following reflects A’s FCF where I do not exclude SBC (conventional method) and where I do exclude SBC (modified method).
Capital Allocation
A’s capital allocation priority is to reinvest in the business. Share repurchases and dividend distributions are also a component of A’s capital allocation.
Q1 and FY2026 Guidance
Earnings are expected to slightly stronger in the second half of FY2026 given the impact of tariffs.
Management’s guidance also incorporates achieving full mitigation of existing tariffs over the course of the year using cost savings and pricing actions. Furthermore, management anticipates substantial sequential improvement in operating margins over the course of FY2026.
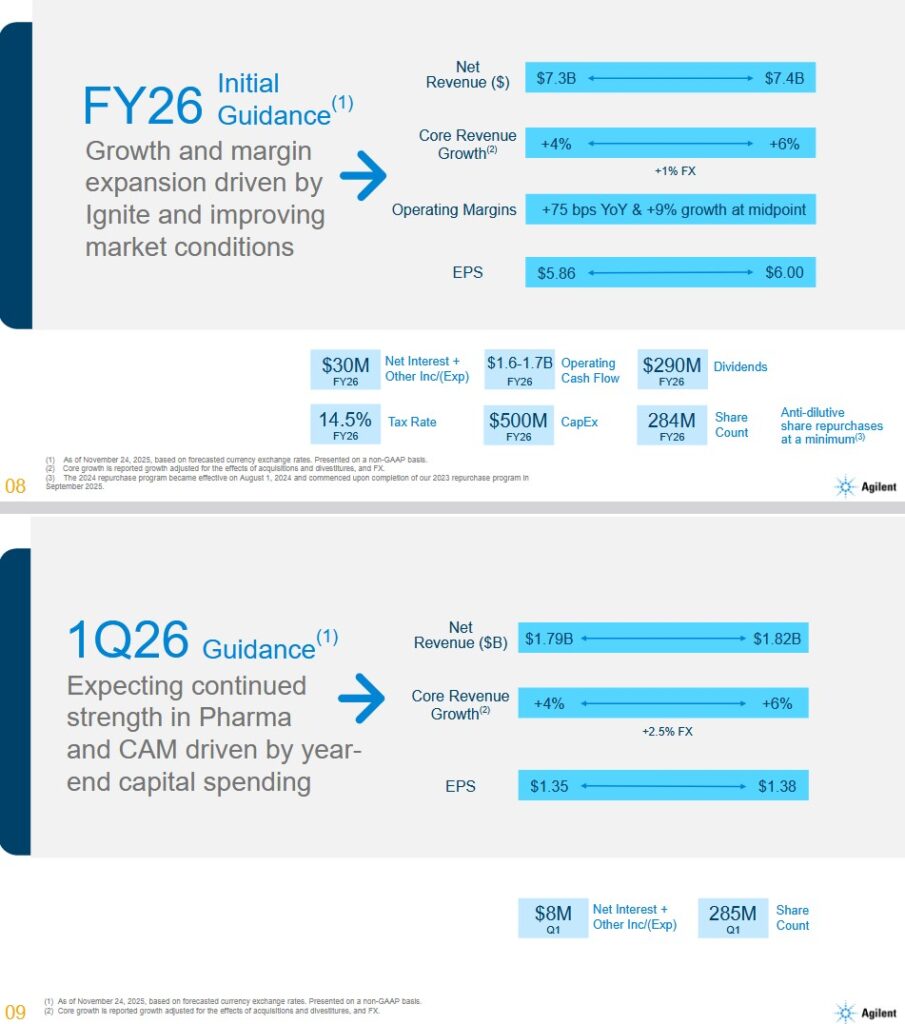
Management expects to deliver 75 bps of operating margin expansion in FY2026 at the midpoint. This target allows the company to make critical investments to drive innovation, expand its digital commercial capabilities and prepare for the opening of its new Contract Development and Manufacturing Organization (CDMO) capacity in 2027, while absorbing incremental material costs driven by tariffs.
A’s CDMO facilities are specialized manufacturing sites that provide contract development and manufacturing services for oligonucleotides and other pharmaceutical ingredients. Its CDMO capabilities help pharmaceutical companies with development, testing, and large-scale manufacturing of therapeutic nucleic acids and related products under regulatory-compliant conditions. A expanded its CDMO footprint via the acquisition of BIOVECTRA, a Canada-based specialized CDMO, adding facilities and expertise in Prince Edward Island and Nova Scotia, Canada; the ~$0.925B acquisition was completed on September 20, 2024. This acquisition expanded A’s contract development and manufacturing capabilities, especially in biologics, highly potent APIs, and emerging therapeutic modalities such as gene editing and mRNA therapeutics.
The current FY2026 outlook calls for margin expansion leading into 9% operating profit growth at the midpoint.
FY2026 EPS guidance includes a headwind of 3 percentage points from the one-time step-up in A’s tax rate which reflects the new global minimum tax regulations. Adjusted for this tax dynamic, underlying EPS growth would have been in the high single to low double-digit range.
Risk Assessment
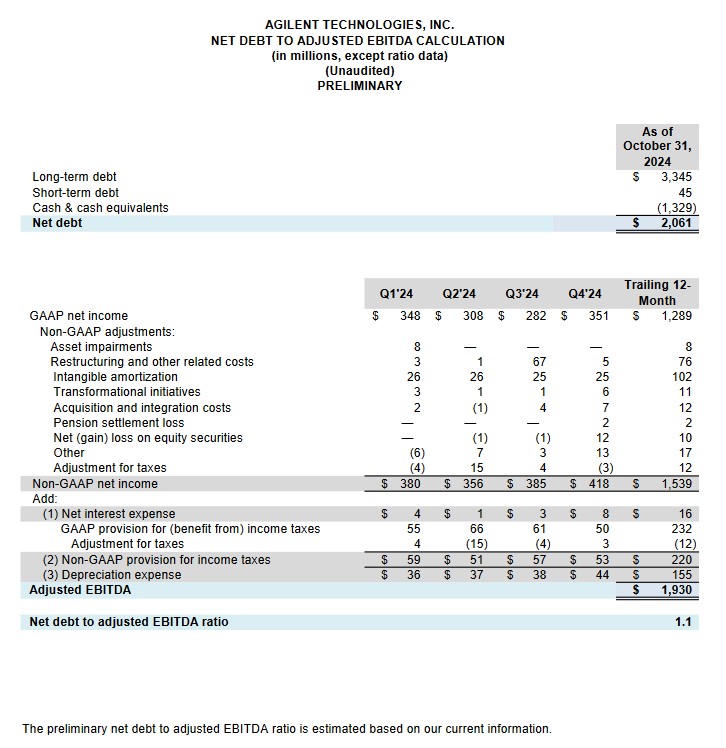
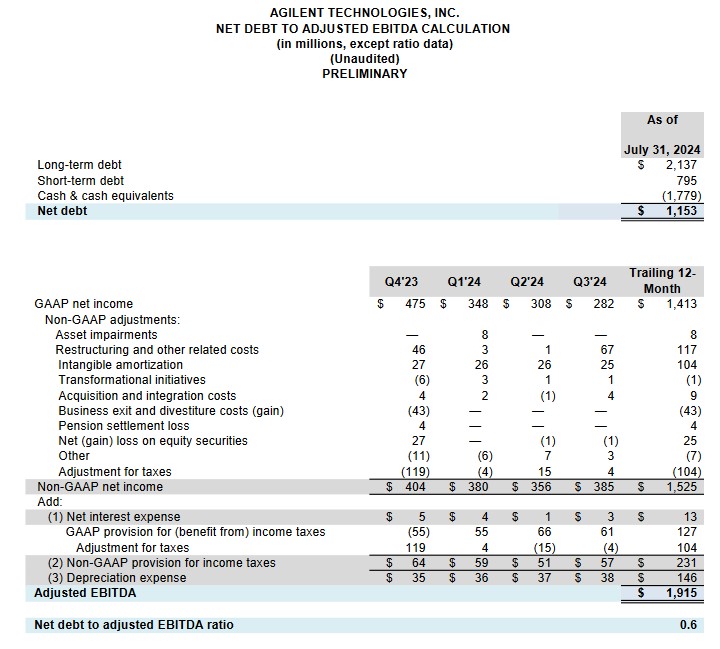
A’s net debt to adjusted EBITDA ratio is 0.8 at FYE2025.
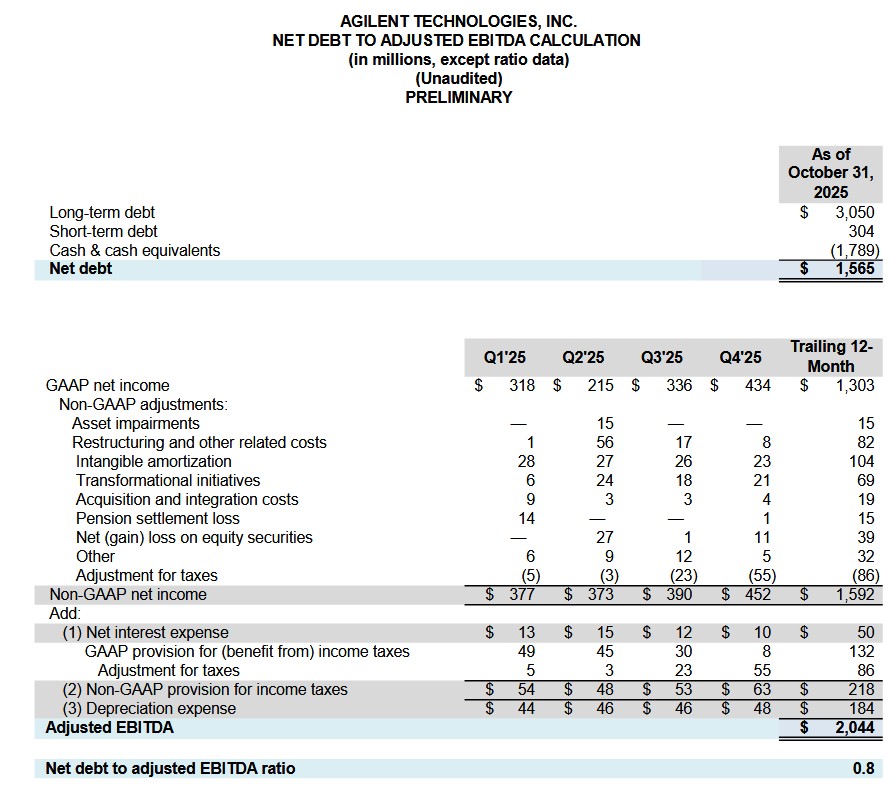
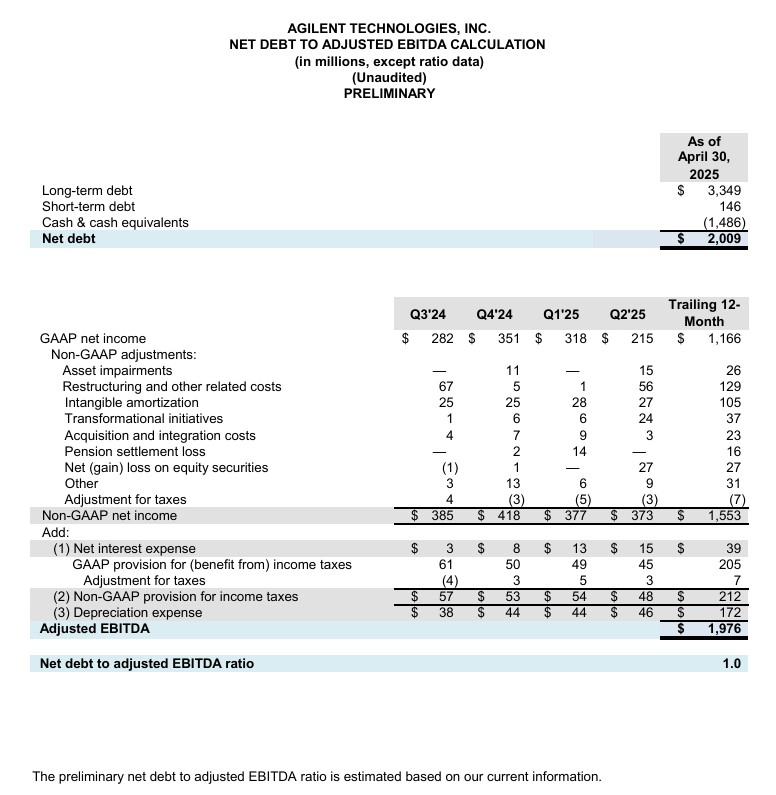
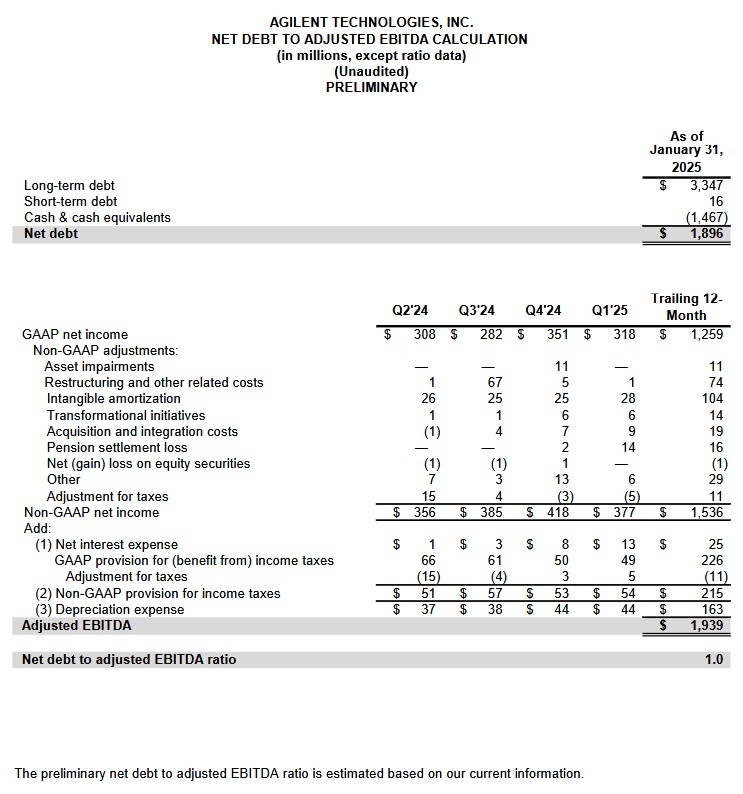
The following net debt to adjusted EBITDA calculations are provided for comparison.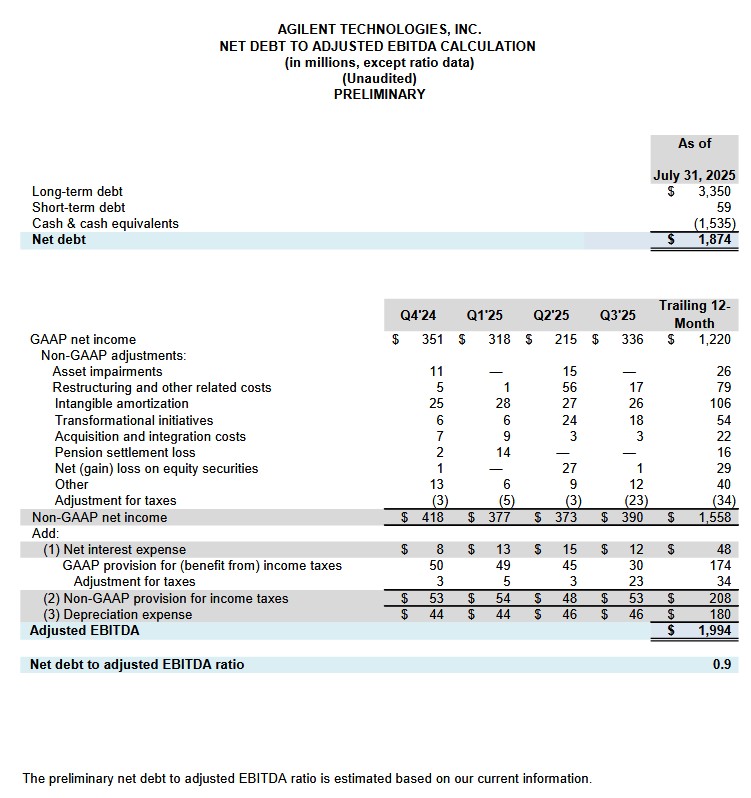
A’s credit ratings remain the same as at the time of prior posts. A’s website currently reflects the following credit ratings.
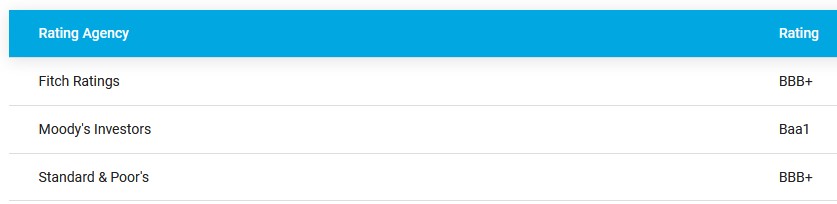
- Moody’s completed its most recent review on May 3, 2023 at which time A’s rating was upgraded from Baa2 to Baa1. The outlook is stable.
- S&P Global completed its most recent review on April 14, 2025 and affirmed A’s BBB+ rating with a Positive outlook.
- Fitch completed its most recent review on July 11, 2025 and affirmed A’s BBB+ rating with a Stable outlook.
All three rating agencies define A as having an adequate capacity to meet its financial commitments. However, adverse economic conditions or changing circumstances are more likely to lead to a weakened capacity of A to meet its financial commitments.
Dividend and Dividend Yield
A’s dividend history is accessible here.
On November 19, A announced a quarterly dividend of $0.255/share to be paid on January 28, 2026 to all shareholders of record as of the close of business on January 6, 2026.
The dividend yield is typically below 1%. Investors should expect the bulk of A’s future total investment return to continue to be predominantly in the form of capital appreciation.
The weighted average shares outstanding (in millions of shares) in FY2013 was ~345. In FY2024 and FY2025 it was ~291 and ~285 (~284 in Q4 2025).
Repurchases in FY2018 – FY2024 (in $B) were 0.422, 0.723, 0.469, 0.788, 1.139, 0.575, and 1.15. Unfortunately, A’s shares were generally overvalued with the exception of the last couple of years.
The 2024 Stock Repurchase Program authorizes the repurchase of up to $2B. Approval by the Board was in May 2024 and became effective on August 1, 2024.
In FY2024 and FY2025, A repurchased ~$1.15B and~$0.425B of its shares. This, however, was partially offset by $0.129B and $0.128B SBC during the corresponding periods.
Management’s FY2026 guidance includes anti-dilutive share repurchases at a minimum.
Valuation
A’s share price as I compose this post is ~$159.86. Management’s FY2026 non-GAAP EPS expectation is $5.86 – $6 thus giving us a forward adjusted diluted PE range of ~26.6 – ~27.3.
A’s forward-adjusted diluted PE levels using this share price and the current broker estimates are:
- FY2026 – 17 brokers – ~26.8 using a mean of $5.97 and low/high of $5.88 – $6.11.
- FY2027 – 15 brokers – ~24.3 using a mean of $6.57 and low/high of $6.40 – $6.80.
- FY2028 – 10 brokers – ~21.8 using a mean of $7.32 and low/high of $7.06 – $7.67.
Looking at A’s valuation from a FCF perspective, I conservatively estimate that FY2026 FCF/share will be ~$4.25 – ~$4.35 calculated using the conventional method (versus $4.042 in FY2025). This estimate is well below the FCF A generated in FY2023 and FY2024 (see table in the Operating Cash Flow (OCF), Free Cash Flow (FCF), and CAPEX section of this post). Using this range, I estimate A’s valuation on a FCF basis to be ~36.8 and ~37.6 (~$159.86 divided by ~$4.25 – ~$4.35).
When we deduct SBC (modified calculation), I estimate A’s FY2026 FCF might be closer to ~$3.80 – ~$3.90. Using this range, I estimate A’s valuation on a FCF basis to be ~41 and ~42.1 (~$159.86 divided by ~$3.80 – ~$3.90).
In my August 28, 2025 post, I wrote the following:
A’s depreciation and amortization in FY2022 – FY2024 and the first half of FY2025 are ~$0.317B, ~$0.271B, ~$0.257B, and ~$0.145B. CAPEX during the same periods are ~$0.291B, ~$0.298B, ~$0.378B, and ~$0.211B. Looking at these results, we see that the ongoing CAPEX is not that significantly different from the combination of depreciation and amortization that is deducted on the Income Statement to determine Net Earnings.
A’s FY2025 adjusted diluted EPS outlook is $5.56 – $5.59 versus the previous $5.54 – $5.61. As I compose this post, shares trade at ~$124.40 giving us a forward adjusted diluted PE of ~22.3 – ~22.4.
A’s forward-adjusted diluted PE levels using this share price and the current broker estimates are:
- FY2025 – 18 brokers – ~22.3 using a mean of $5.57 and low/high of $5.55 – $5.59.
- FY2026 – 18 brokers – ~20.7 using a mean of $6.02 and low/high of $5.91 – $6.10.
- FY2027 – 13 brokers – ~18.7 using a mean of $6.66 and low/high of $6.48 – $6.87.
A’s FY2025 FCF using the conventional method remains the same as in my prior post. I anticipate ~$1.05B – ~$1.15B of FCF and ~285 million diluted outstanding shares. Using these estimates, A could generate ~$3.68 – ~$4.04 of FCF/share. With shares currently trading at ~$124.40, the forward P/FCF is ~30.8 – ~33.8.
Under the modified method of calculation FCF, my estimation is that A will generate ~$0.914B – ~$1.014B. Divide this by ~285 million diluted outstanding shares and we arrive at a FCF/share range of ~$3.21 – ~$3.56. With shares currently trading at ~$124.40, the forward P/FCF is ~35 – ~38.8.
In my May 30, 2025 post, I wrote:
It generated $1.31 in each of Q1 and Q2 and the Q3 outlook is $1.35 – $1.37 for a total of ~$3.98. This means it will need to generate ~$1.56 – ~$1.63 in Q4 to achieve its FY2025 target.
Using the current ~$113.30 share price, the forward adjusted diluted PE is ~20.2 – ~20.5.
A’s forward-adjusted diluted PE levels using this share price and the current broker estimates are:
- FY2025 – 20 brokers – ~20.3 using a mean of $5.57 and low/high of $5.47 – $5.61.
- FY2026 – 20 brokers – ~18.7 using a mean of $6.07 and low/high of $5.80 – $6.22.
- FY2027 – 14 brokers – ~16.9 using a mean of $6.70 and low/high of $6.49 – $6.86.
Earlier in this post, I estimated that A’s FY2025 FCF calculated under the conventional method might be ~$1.05B – ~$1.15B. The outlook is for ~285 million diluted outstanding shares meaning, A could generate ~$3.68 – ~$4.04 of FCF/share. With shares currently trading at ~$113.30, the forward P/FCF is ~28 – ~30.8.
Under the modified method of calculation FCF, I estimate A will generate ~$0.91B – ~$1.01B. Divide this by ~285 million diluted outstanding shares and we arrive at a FCF/share range of ~$3.19 – ~$3.54. With shares currently trading at ~$113.30, the forward P/FCF is ~32 – ~35.5.
Final Thoughts
FY2026 guidance includes a deceleration in growth to mid-single digits on both the top and bottom lines. Some investors may be disappointed with this growth guidance. I, however, much prefer that a company set a ‘low bar’ and gradually raise guidance as the fiscal year progresses versus setting a ‘high bar’ and adjusting lower as the year progresses.
A has been undervalued for almost the entire mid-2023 to YTD2025 time frame. Unfortunately, the increase in A’s share price since April 2025 outpaces the company’s underlying performance.
Shares currently appear fairly valued. I do not, therefore, intend to add to my existing exposure which consists of 602 shares in a ‘Core’ account the FFJ Portfolio at an average cost of $121.7565. I want to acquire shares in great companies that appear to have temporarily fallen out of favor with the investment community.
A was not a top 30 holding when I completed my 2025 Mid-Year Portfolio Review and very likely is still not a top 30 holding.
I wish you much success on your journey to financial freedom!
Note: Please send any feedback, corrections, or questions to finfreejourney@gmail.com.
Disclosure: I am long A.
Disclaimer: I do not know your circumstances and do not provide individualized advice or recommendations. I encourage you to make investment decisions by conducting your research and due diligence. Consult your financial advisor about your specific situation.
I wrote this article myself and it expresses my own opinions. I do not receive compensation for it and have no business relationship with any company mentioned in this article.