![]() Zoom Communications (ZM) is but one of several companies whose valuations entered the stratosphere during the COVID pandemic. Its share price briefly exceeded $500 in November 2020. Nothing in the Form 10-Q as at October 31, 2020 suggests this was reasonable.
Zoom Communications (ZM) is but one of several companies whose valuations entered the stratosphere during the COVID pandemic. Its share price briefly exceeded $500 in November 2020. Nothing in the Form 10-Q as at October 31, 2020 suggests this was reasonable.
Fast forward to November 2025 and some of the investors who who foolishly invested in ZM in late 2020 likely want to have nothing to do with this company from an investment perspective. ZM, however, is a very different company from 5 years ago.
I initiated a ZM position on August 22, 2023 with the purchase of 400 shares @ $64.58 in a ‘Core’ account in the the FFJ Portfolio and acquired an additional 600 shares at later dates. My current exposure is 1000 ZM shares at an average cost of ~$64.38 in a ‘Core’ account within the FFJ Portfolio.
I last reviewed ZM in this August 22, 2025 post at which time the company had released its Q2 and YTD2026 results following the August 21 market close. Now that ZM’s Q3 and YTD2026 results have been released following the November 24 market close, I revisit this existing holding.
Business Overview
ZM has Class A (publicly traded shares) and Class B shares. The Class A and B shares have 1 and 10 votes per share, respectively. There is ~5.5x more Class A shares outstanding than Class B shares.
The Class B shareholders have significant influence over the management and all matters requiring stockholder approval, including the election of directors and significant corporate transactions, such as a merger or other sale of ZM or its assets. Within the Risk Factors section of ZM’s Form 10-Q and Form 10-K, there is commentary regarding this dual-class structure.
Part 1, Item 1 in ZM’s FY2024 Form 10-K (see SEC Filings) provides a comprehensive overview of the business, competition, and risks.
On September 17 and 18, ZM held Zoomtopia 2025, its annual flagship event. This event showcased innovations, particularly in the area of AI features and collaboration tools. ZM’s presentation and webcast of this event is accessible here.
Financials
Q3 and YTD2026 Results
ZM’s Q3 2026 earnings material (including the transcript of management’s commentary on the earnings call) is accessible here.
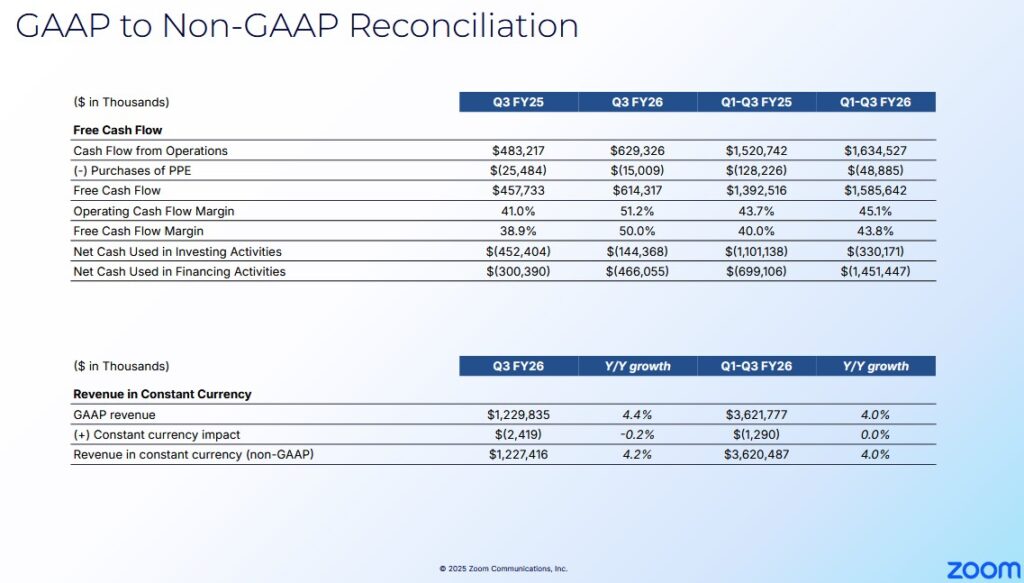
The Q3 2025 and Q3 2026 GAAP to Non-GAAP reconciliation is accessible through the Q3 2026 earnings presentation.
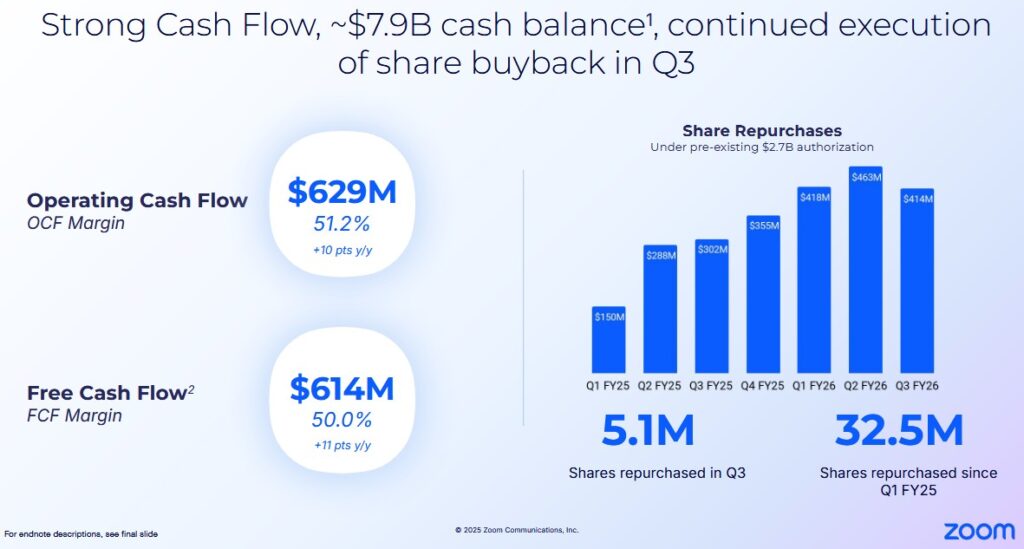
ZM’s cash and cash equivalents and marketable securities at FYE2025 was ~$7.79B, an increase from ~$7B at FYE2024. At the end of Q3 2026, this had risen to ~$7.94B despite ~$1.297B in YTD share repurchases.
A concern I had when I initiated a position in 2023 was the extent of ZM’s monthly churn. Monthly churn in:
- Q3 – Q4 2022 was 3.7% and 3.8%;
- Q1 – Q4 2023 was 3.6%, 3.6%, 3.1%, and 3.0%;
- Q1 – Q4 2025 was 3.2%, 2.9%, 2.7%, and 2.8%; and
- Q1 – Q3 2026 was 2.8%, 2.9%, and 2.7%.
ZM’s online business continues to show signs of stabilizing and is currently at an all-time low.
Operating Cash Flow (OCF), Free Cash Flow (FCF), and CAPEX
In my prior ZM post I touch upon my rationale for deducting stock-based compensation (SBC) to calculate FCF. I, therefore, dispense with explaining this again.
The following compares ZM’s FCF using the ‘conventional’ and ‘modified’ calculation methods.
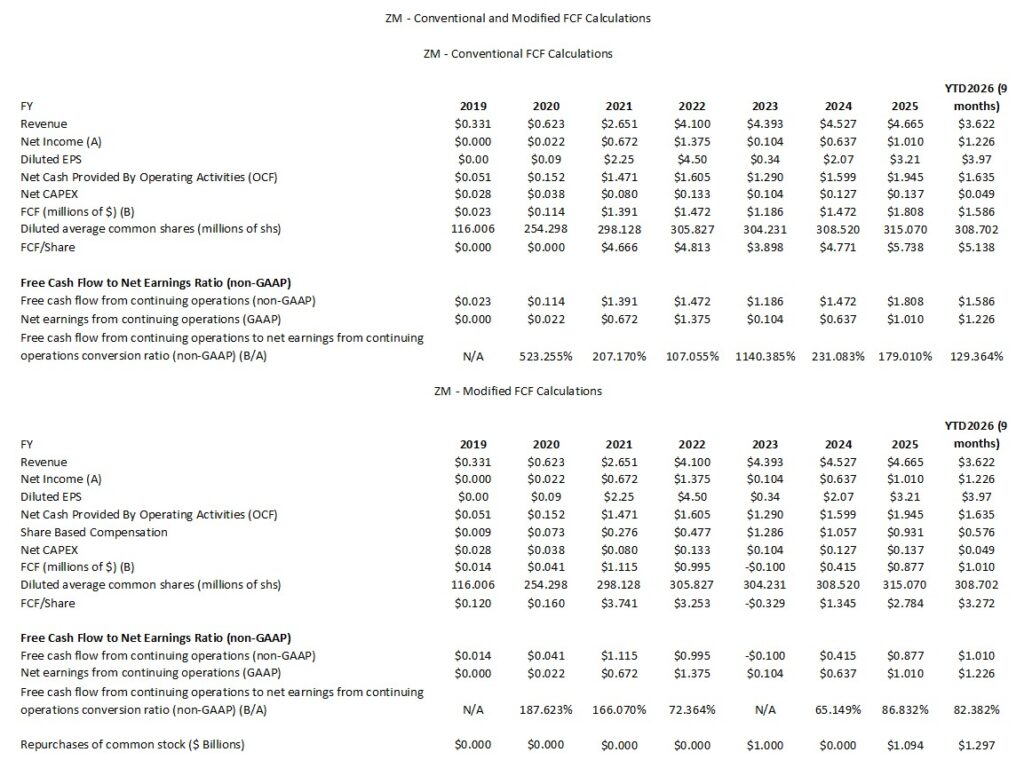
The following reflects the manner in which ZM calculates FCF for Q3 and YTD2025 and Q3 and YTD2026.
Capital Allocation
The capital allocation priority is to reinvest in the company. This can include acquisitions. The opportunistic repurchase of Class A shares comes next.
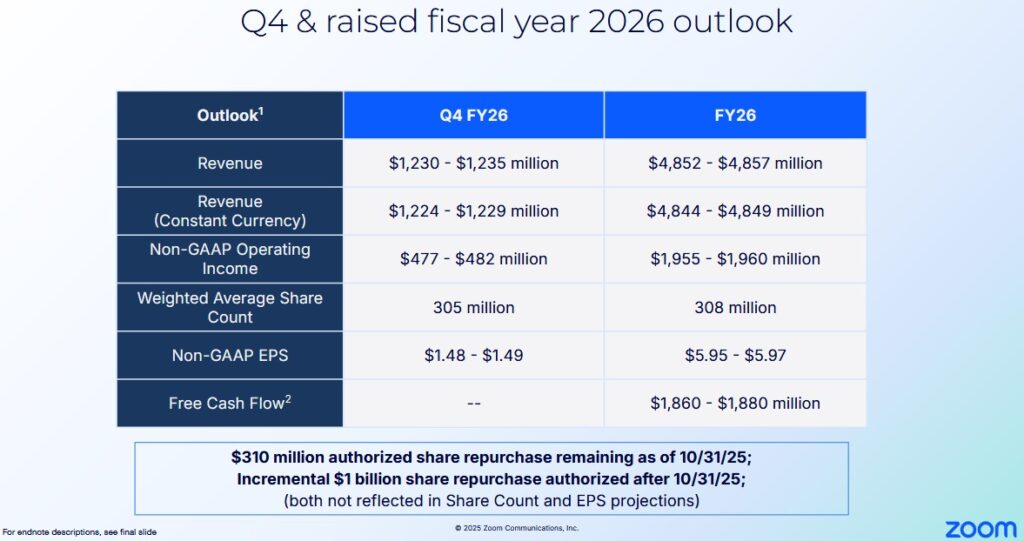
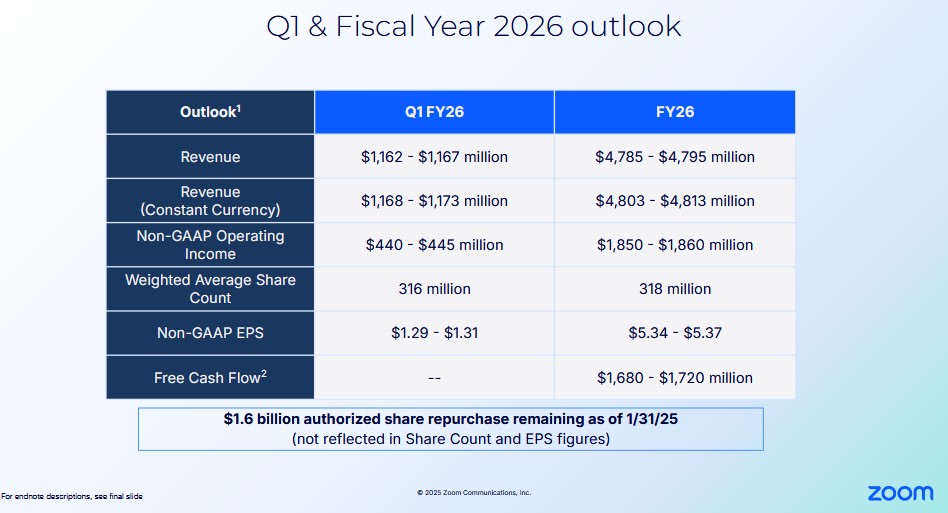
Q4 and FY2026 Outlook
The following reflects ZM’s Q4 and FY2026 outlook.
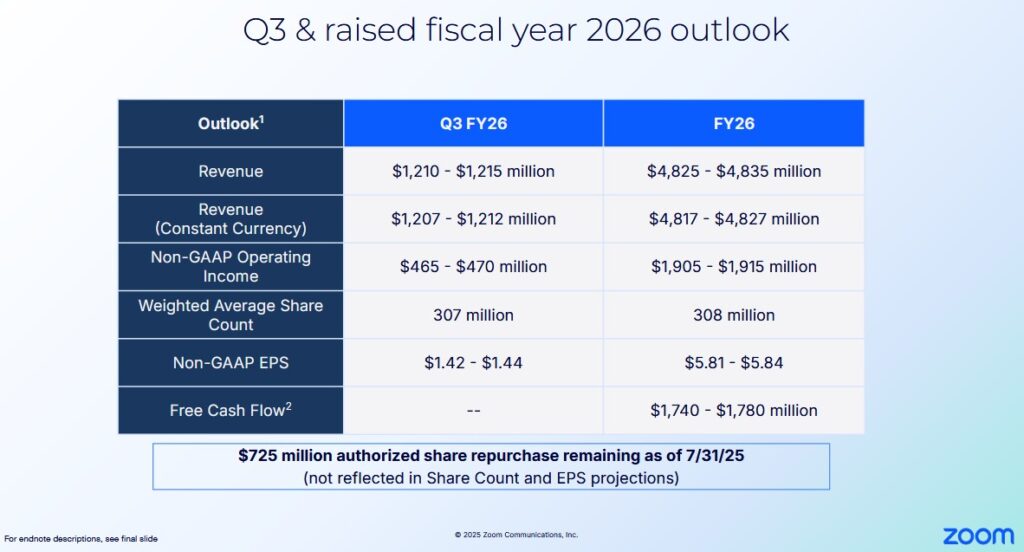
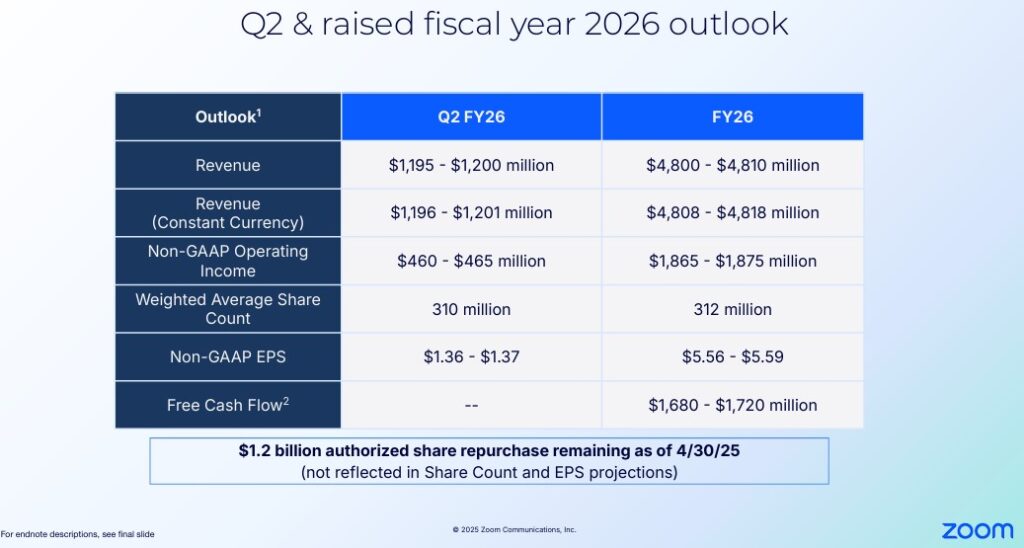
ZM’s prior outlooks are provided below for comparison.
Risk Assessment
ZM has no debt to rate.
Dividends and Share Repurchases
Dividend and Dividend Yield
Management specifically states the following in its Form 10-Q and Form 10-K:
We do not intend to pay dividends for the foreseeable future.
We have never declared nor paid cash dividends on our capital stock. We currently intend to retain any future earnings to finance the operation and expansion of our business, and we do not expect to declare or pay any dividends in the foreseeable future. As a result, stockholders must rely on sales of their Class A common stock after price appreciation as the only way to realize any future returns on their investment.
Share Repurchases
In various prior ZM posts I raise concern about the extent of the company’s ‘stock-based compensation expense’ (SBC). We now see from the table presented in the Operating Cash Flow (OCF), Free Cash Flow (FCF), and CAPEX section of this post that the company is considerably ‘dialing back’ SBC.
At the end of the first 3 quarters of FY2026, ZM had repurchased ~$1.297B of its shares. Opportunistic share repurchases now appears to be a core component of the company’s capital allocation strategy.
The company’s CFO devoted a few minutes to the topic of share repurchases during her segment of ZM’s September 2025 Zoomtopia event. She touched upon the progress made to drive shareholder returns by way of share repurchases and commented that the company’s SBC as a percentage of revenue is tracking 1 year ahead of plan. At the time of the September Zoomtopia event, it had been reduced to 16% from ~29.3%, ~23.4%, and ~20% in FY2023 – FY2025. At the end of the first 3 quarters of FY2026, SBC was ~$575.6 million and revenue was ~$3.622B – just slightly less than 16%.
The diluted weighted-average shares used in computing net income per share attributable to common stockholders is reflected in the table provided in the Operating Cash Flow (OCF), Free Cash Flow (FCF), and CAPEX section of this post. The weighted average diluted shares outstanding in FY2025 was 315.07 million. The YTD and Q3 2026 weighted average, however, is 308.7 million and 305.024 million, respectively.
In November 2025, ZM’s Board authorized the repurchase of an additional $1.0B of outstanding Class A common stock, incremental to the $310.4 million remaining authorization as of October 31, 2025. If ZM’s share price and valuation can remain attractive for the remainder of the current fiscal year, the weighted average number of diluted shares outstanding could come in lower than the current outlook of ~305 million and ~308 million for Q4 and FY2026.
Information about ZM’s Stockholders’ Equity and Equity Incentive Plans is found in each Form 10-Q and Form 10-K.
Valuation
The November 24, 2025 closing share price was $78.60 and management’s current FY2026 adjusted diluted EPS outlook is $5.95 – $5.97. Using this share price and the ~$5.96 mid point of management’s outlook, the forward adjusted diluted PE is ~13.2.
Using this current share price and the currently available adjusted diluted EPS broker estimates, ZM’s forward adjusted diluted PE levels are:
- FY2026 – 27 brokers – ~ 13.1 using a mean of $5.99 and low/high of $5.81 – $8.46.
- FY2027 – 28 brokers – ~ 13.1 using a mean of $5.99 and low/high of $5.40 – $6.87.
- FY2028 – 15 brokers – ~ 12.5 using a mean of $6.28 and low/high of $5.10 – $7.17.
The data reflected above will change over the next several days as the brokers update their estimates. I place very little reliance on broker estimates, however, as much can happen to make these estimates irrelevant. Furthermore, the disparity in estimates implies that the brokers which cover ZM have very different outlooks.
Conventional FCF Calculation
Management’s FY2026 FCF guidance is $1.86B – $1.88B and the diluted weighted average shares outstanding forecast is 308 million (the outlook at the beginning of the year was 318 million). This gives us a FCF/share estimate of ~$6.04 – ~$6.10. Based on a $78.60 share price, the forward P/FCF is ~12.9 – ~13.
The diluted weighted average shares outstanding for the first 3 quarters of FY2026 is 308.7 million. The weighted average in Q3, however, is ~305 million. ZM continues to allocate money toward share purchases and the FY2026 diluted weighted average outstanding shares could end up being ~305 million. Divide the $1.87B mid point of management’s FY2026 FCF guidance by 305 million shares and the FCF/share estimate is ~$6.13. Based on a $78.60 share price, the forward P/FCF is ~12.8.
Modified FCF Calculation
YTD2026 SBC is ~$0.576B. If we increase this value by 33.33%, the FY2026 SBC estimate is ~$0.768B. Deduct this value from the ~$1.87B mid point of ZM’s FY2026 FCF outlook and we get a FY2026 FCF estimate of ~$1.102B. Dividing this by 305 million shares results in FY2026 FCF/share of ~$3.61. Using the current $78.60 share price, we get a P/FCF of ~21.8.
The following is my assessment of ZM’s valuation at the time of my August 22, 2025 post.
Management’s current FY2026 adjusted diluted EPS outlook is $5.81 – $5.84. The August 21, 2025 closing share price was $73.17. Using this share price and the ~$5.825 mid point of management’s outlook, the forward adjusted diluted PE is ~12.56.
Using this current share price and the currently available adjusted diluted EPS broker estimates, ZM’s forward adjusted diluted PE levels are:
- FY2026 – 23 brokers – ~13 using a mean of $5.65 and low/high of $5.55 – $5.88.
- FY2027 – 29 brokers – ~ 12.7 using a mean of $5.78 and low/high of $5.17 – $6.77.
- FY2028 – 14 brokers – ~ 12.2 using a mean of $6.02 and low/high of $4.96 – $7.46.
I place little reliance on broker estimates and almost no reliance on any estimates beyond those for the current fiscal year. This is because much can happen beyond the current fiscal year that can make these estimates irrelevant. Furthermore, the disparity in estimates implies that the brokers which cover ZM have very different outlooks.
Conventional FCF Calculation
Management’s FY2026 FCF guidance is $1.74B – $1.78B and the diluted weighted average shares outstanding forecast is 308 million (the outlook at the beginning of the year was 318 million). This gives us a FCF/share estimate of ~$5.65 – ~$5.78. Based on a $73.17 share price, the forward P/FCF is ~12.7 – ~13.
ZM, however, still has $0.725B authorized share repurchase remaining at the end of Q2 2026. It is, therefore, entirely possible that the FY2026 diluted weighted average outstanding shares could end up being lower than 308 million!
Modified FCF Calculation
When we deduct YTD2026 SBC of ~$0.39B, we get $0.581B of YTD FCF.
If SBC in the second half of FY2026 is similar to the first half, FY2026 SBC should be ~$0.78B. Deduct this from management’s FY2026 FCF guidance of $1.74B – $1.78B and we get a modified FCF range of ~$0.96B – ~$1B. Divide this by 308 million shares and we get a FCF/share range of ~$2.53 – ~$3.25. Using the a $73.17 share price, we get a P/FCF range of ~22.51 – ~29.
These valuations are more favorable than at the time of my February 25, 2025 and May 27, 2025 posts.
Final Thoughts
One of my concerns when I initiated a ZM position on August 22, 2023 was the magnitude of its annual SBC – the same concern held by many in the investment community. In response, ZM has dialed back its annual SBC. The investment community also raised the issue of share repurchases. ZM is now repurchasing shares.
ZM is not a capital intensive business from an annual CAPEX perspective. In FY2023 – FY2025 and YTD2026 (9 months), however, it invested ~$0.774B, ~$0.803B, ~$0.853B, and ~$0.622B (~17.6%, ~17.7%, ~18.3%, and ~17.2%) of its annual revenue on R&D to improve/expand its product offering.
I am limited as to how much I can invest. ZM, however, can enhance my total investment return by opportunistically repurchasing millions of outstanding shares.
ZM currently has the financial wherewithal to repurchase ~$1.31B of its shares (the current total Board approval as at the end of Q3). At an average price of $80 it would be able to repurchase 16,375,000 shares. At an average price of $70, it can repurchase 18,714,285. The difference is only 2,339,285 which pales in comparison to ~305 million shares outstanding in Q3 2025. Over a 10 year period, however, this becomes somewhat more meaningful (~23.393 million shares)!
I continue to consider ZM’s fair value to be in the low $90s. At the moment, I am satisfied with my current exposure. ZM’s share price, however, can be volatile so it is possible that I may increase my exposure at a later date.
I wish you much success on your journey to financial freedom!
Note: Please send any feedback, corrections, or questions to finfreejourney@gmail.com.
Disclosure: I am long ZM.
Disclaimer: I do not know your circumstances and do not provide individualized advice or recommendations. I encourage you to make investment decisions by conducting your research and due diligence. Consult your financial advisor about your specific situation.
I wrote this article myself and it expresses my own opinions. I do not receive compensation for it and have no business relationship with any company mentioned in this article.