
I last reviewed Home Depot (HD) in this August 21, 2025 post following the release of Q2 2025 financial results. In that post, I include metrics for prior periods so we can compare HD’s performance over time. I include these previously provided results thus eliminating the need to navigate between posts.
When I composed my August 21, 2025 post, shares were trading at ~$401.74. Using this share price and management’s guidance at the time, I deemed shares to be richly valued.
Now, HD’s share price is $336.48 as at the November 18, 2025 market close. Looking at a company’s share price in isolation is pointless. We need to ascertain HD’s valuation based on how the company is performing/likely to perform.
To say that business conditions are challenging is an understatement. HD has cut its full-year profit forecast and has missed Wall Street’s earnings expectations for the third straight quarter as it saw weaker home improvement demand, tepid consumer spending, and lower-than-usual storm activity.
HD’s revised outlook includes ~$2B in incremental revenue from GMS (Gypsum Management and Supply), a building products distributor HD acquired earlier in 2025; GMS’s sales were not part of HD’s previous full-year guidance. If HD did not have the benefit of GMS’s sales in Q3, the picture would be worse.
NOTE: GMS is a building products distributor HD acquired for ~$4.3B through its wholly owned SRS Distribution subsidiary in an effort to draw more sales from contractors and other home professionals.
Now that HD’s FY2025 has been revised and the share price has pulled back from the level at the time of my August 21 post, this is an opportune to revisit the company’s valuation.
Business Overview
A good overview of the company and Risk Factors is found in Part 1, Items 1 and 1A in the FY2024 Form 10-K and the company’s website.
Market Conditions
In early November, U.S. Treasury Secretary Scott Bessent stated that certain segments of the U.S. economy, primarily the housing market are already in a recession. He also mentioned that the private sector generally is experiencing an economic downturn. Specifically, he identified the following areas:
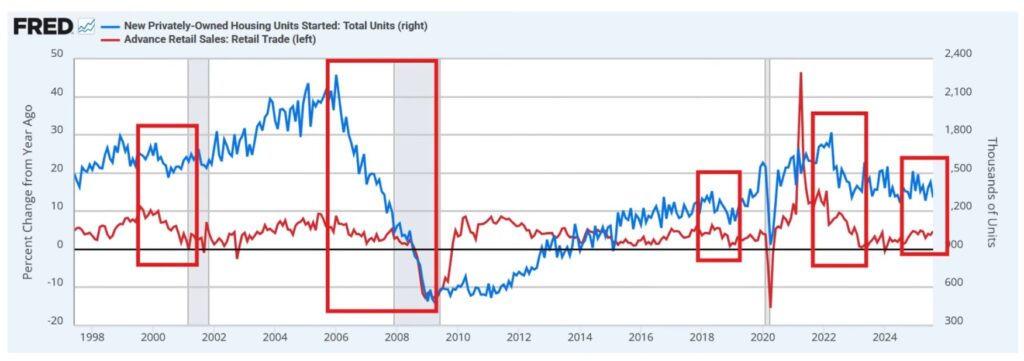
- Housing Market: High mortgage rates, which have priced out many potential buyers, is a key indicator that the housing sector is ‘effectively in recession’.
- Private Sector: The ‘private sector is in recession’ as a result of ongoing economic adjustments.
- Weakened Middle Class: Characterizing the economy as a ‘barbell economy’, Bessent suggested that while the financial and raw material sectors are strong, the middle class is weakened by a lack of savings and high debt levels, increasing vulnerability to an economic crisis.
The National Association of Home Builders (NAHB) reports that builder confidence in the market for newly built single-family homes in November 2025 reflected a marginal improvement from October. Builder confidence, however, is still relatively low.
Key points from the latest NAHB report include:
- 41% of builders reported cutting prices in November to boost sales. This is the highest share since May 2020 and the first time this percentage has exceeded 40%.
- The average price reduction was 6%, consistent with the discount that builders have been offering in recent months. Price cuts are often seen as the last lever builders pull to boost sales.
- Overall sentiment was largely gloomy as builders face a weak home-buying environment.
- Sales incentives, such as rate buydowns, were widely used by 65% of builders, the same rate seen in prior months.
- A weakening job market and stretched consumer finances are contributing to a difficult sales environment.
- Many people find the housing market too expensive.
- Current sales conditions were steady, but buyer traffic declined slightly.
- Despite some easing in mortgage rates, weak demand persists due to buyer uncertainty fueled by recent economic challenges like tariffs, inflation, and the government shutdown.
- Regional HMI scores showed a mixed picture, with increases in the Northeast and South but declines in the Midwest.
- NAHB forecasts a slight gain in single-family housing starts in 2026 after a decline in 2025.
Overall, the market shows ongoing challenges with price reductions and incentives indicating attempts to stimulate buyer interest. Builder confidence signals prevailing negative sentiment in the housing market.
Some of America’s largest home builders, such as D.R. Horton (DHI) and PulteGroup (PHM), have suggested on recent earnings calls that people have not been purchasing homes because of worries about the economy.
Weakness in the labor market, high-profile layoff announcements, and the focus on affordability issues during the November 4 elections have kept financial pressures front of mind for many would-be home buyers.
In addition, a September survey of consumers by housing-finance giant Fannie Mae (FNMA) found that ~73% of Americans say the current environment is a bad time to buy a house.
Furthermore, an increasing number of homeowners are going underwater on their mortgages. This occurs when homeowners owe more on their mortgage than the value of their home. Approximately 900,000 homeowners are now underwater, with market concentration that experienced the quickest surge in 2020-2022.
Foreclosures are also up 20% YoY as an increasing number of homeowners are missing multiple mortgage payments and losing their homes.
A sign of buyer hesitancy is that homes are taking about five extra days to sell in comparison with last year.
Another sign of a decline in demand is that ~1 in 5 sellers have had to trim their list price.
In a nutshell, all is not well in several regions in the US where HD at FYE2024 had 419,600 associates (89.3% of HD’s global workforce of 470,100).
So how about Canada, HD’s second largest market where it had 32,000 associates (6.8% of its global workforce) at FYE2024?
Market conditions in some major Canadian cities (eg. Toronto, Vancouver) are not much better! Canada Mortgage and Housing Corp. (CMHC) notes that the annual pace of housing starts in October fell 17% compared with September. It states that the seasonally adjusted annual rate of housing starts was 232,765 units in October, down from 279,174 in September.
Conditions in Ontario and British Columbia are weak. In October, there were ~36% fewer starts in Vancouver due to fewer multi-unit starts. Toronto fared worse with a decline of ~42% with both multi-unit and single-detached starts lower than last year. Higher starts in markets like Montreal, Calgary, and Edmonton helped keep the national YTD total elevated compared with the same period last year.
Looking forward, there has been a softening trend in building permits. This suggests some further downside for starts in the near-term. Given this, it seems natural that homebuilding is likely to cool in 2026, as modest population growth weighs on rents, and weak pre-sales activity restrains starts in the ownership market.
Financials
Q3 and YTD2025 Results
Earnings-related material is accessible here.
The following chart reflects the average weekly hours of production and non-supervisory employees (blue line) against advanced retail sales (red line). Historically, retail sales collapse 5 – 7 months when hours are reduced.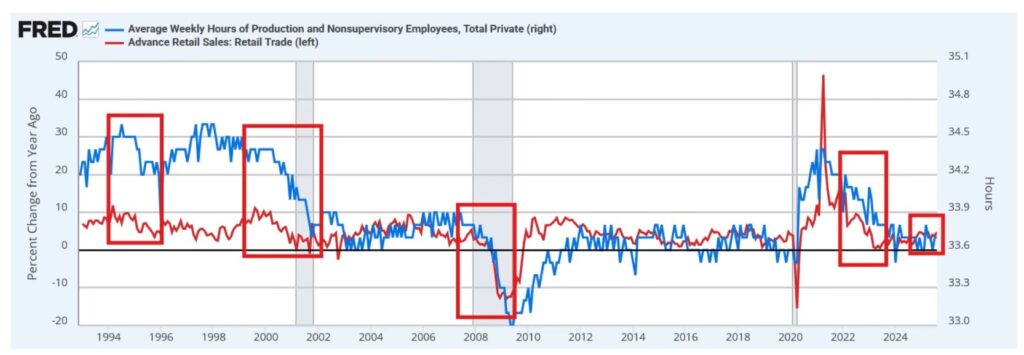
Previously, management expected demand to accelerate in the second half of the current fiscal year with an easing in interest and mortgage rates.
On the Q3 earnings call, however, management states:
Our results missed our expectations primarily due to the lack of storms in the third quarter which resulted in greater-than-expected pressure in certain categories. Additionally, while underlying demand in the business remain relatively stable sequentially, an expected increase in demand in the third quarter did not materialize. We believe the consumer uncertainty and continued pressure in housing are disproportionately impacting home improvement demand.
What’s going to spark the consumer? We still believe we have one of the healthiest consumer segments in the whole economy. But again, the economic uncertainty continues largely now due to living costs, affordability is a word that’s being used a lot. Layoffs, increased job concerns, etc.
When people worry about income predictability, major home improvement projects move lower on the list of priorities!
This is borne out by HD’s less than stellar results and need to lower the current year’s guidance.
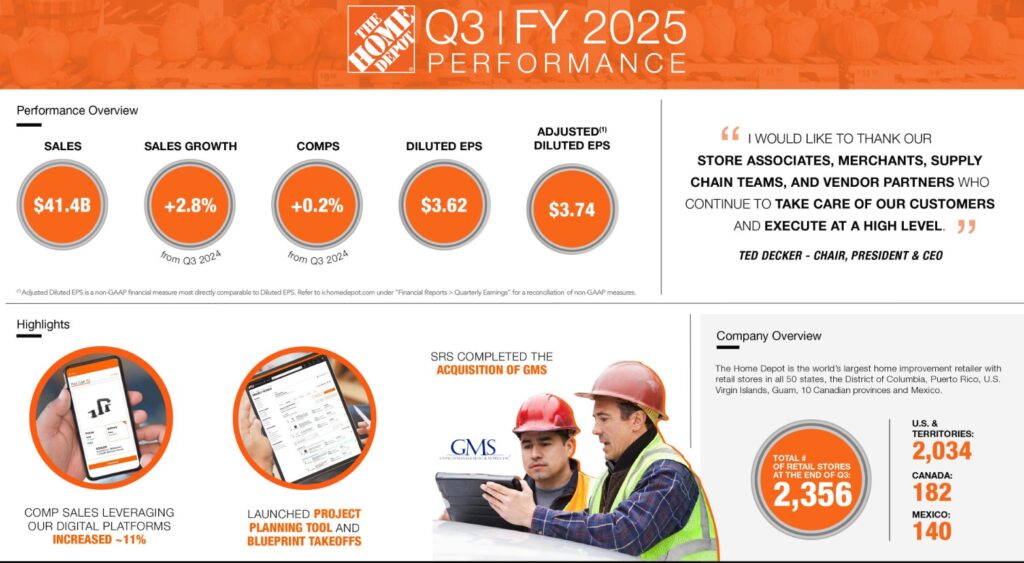
Total sales in Q3 were ~$41.4B, an increase of ~$1.1B or ~3% from last year. This, however, included ~$0.9B from the recent GMS acquisition (~ 8 weeks of sales in the quarter).
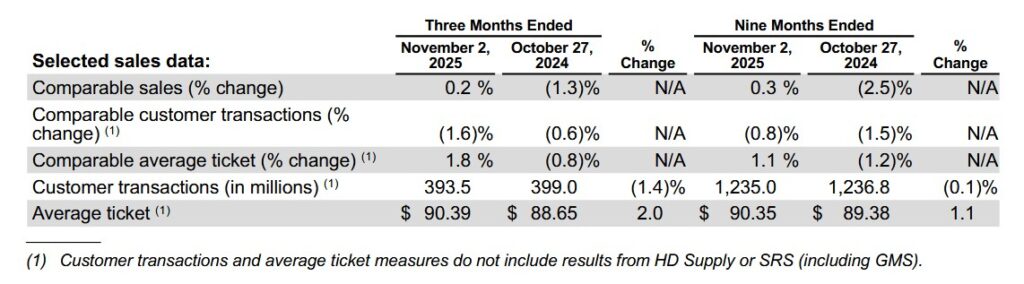
Total company comps were +0.2%, with comps of +2% in August, +0.5% in September, and -1.5% in October. Comps in the U.S. were +0.1% for the quarter with comps of +2.2% in August, +0.3% in September and -1.7% in October. Canada and Mexico posted modestly positive comps.
In Q3, HD’s gross margin was 33.4%, essentially flat compared to Q3 2024. This was in line with management’s expectations.
Operating expenses as a percent of sales increased ~55 bps to 20.5% compared to Q3 2024. This increase, however, includes transaction fees related to the GMS acquisition.
HD’s operating margin in Q3 was 12.9%, compared to 13.5% in Q3 2204. Pretax intangible asset amortization was $0.158B but if we exclude this, the Q3 adjusted operating margin was 13.3% versus 13.8% in Q3 2024.
Interest and other expense in Q3 was $0.596B which was in line with management’s expectations.
Diluted EPS is Q3 was $3.62, compared to $3.67 in Q3 2024. Excluding intangible asset amortization, adjusted diluted EPS in Q3 was $3.74, compared to $3.78 in Q3 2024.
In Q3, HD opened 3 new stores, bringing its total store count to 2,356.
HD’s inventory is at record levels. At the end of Q3, merchandise inventories were $26.2B, up ~$2.3B compared to Q3 2024. Inventory turned over 4.5x, down from 4.9x in Q2 2024 and 4.8x in Q3 2024.
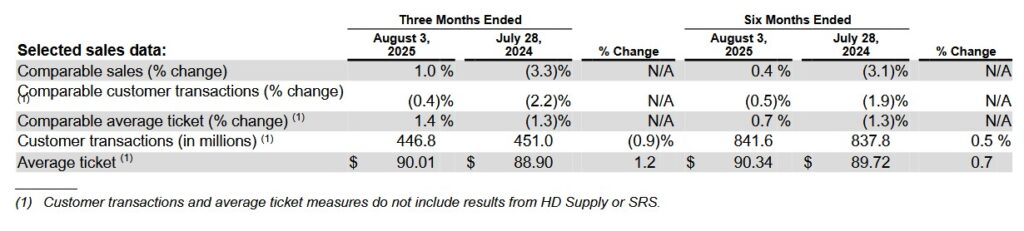
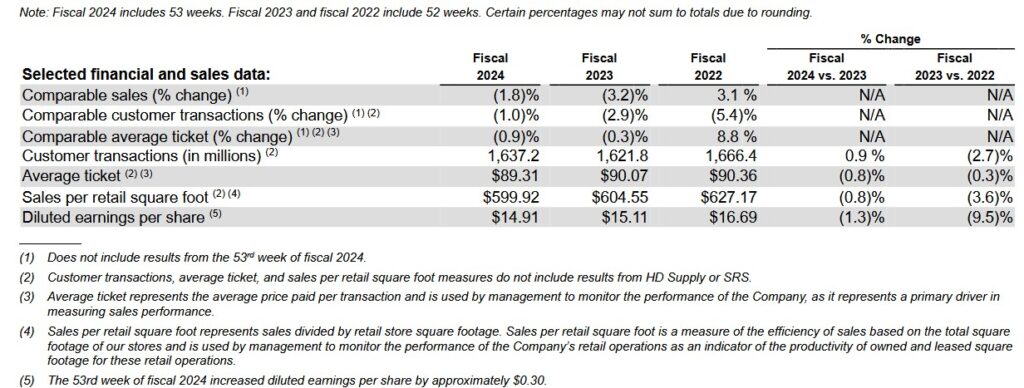
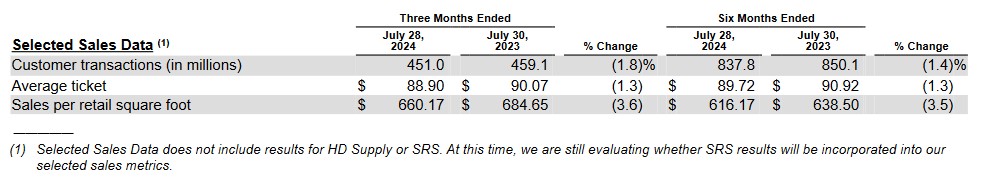
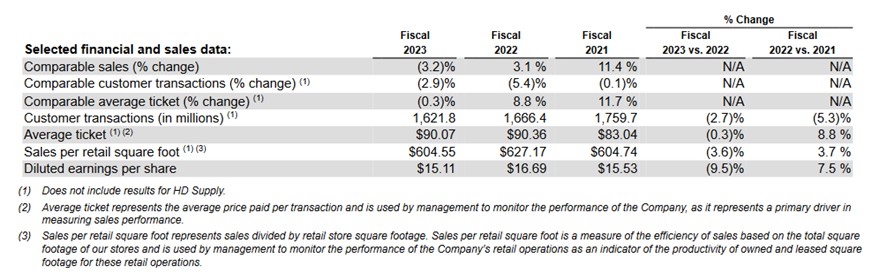
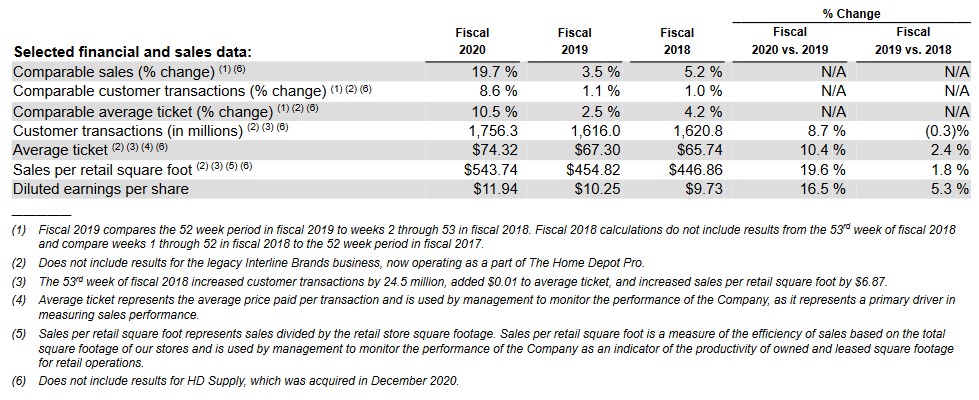
Looking at the average ticket measure (granted it excludes results from HD Supply and SRS) in Q3 2025 is $90.39. In FY2022 it was $90.36. Essentially, this metric has not changed. After 3 years, however, we would expect inflation to have contributed to some level of increase in the average ticket measure.
The number of customer transactions (in millions) in Q3 2025 was 393.5 which is lower than in all prior periods reflected below. HD’s business, however, is somewhat seasonal. We should not, therefore, compare the number of customer transactions in Q3 against the number of customer transactions in prior fiscal years.
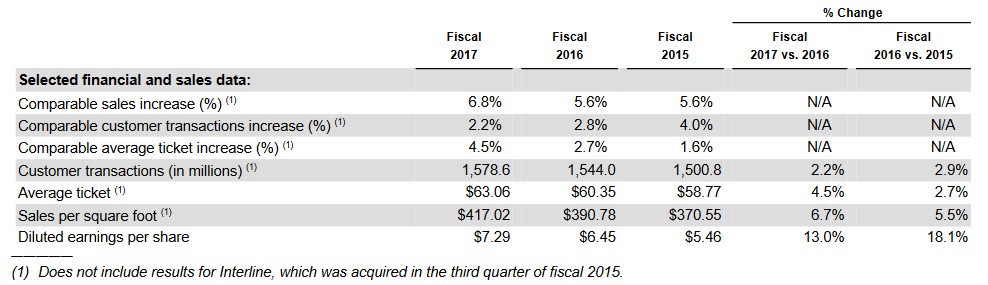
HD has opened several new stores over the past 9 – 10 years so we should expect the number of customer transactions to be materially different. In FY2015 and FY2016, the number of customer transactions (in millions) was 1500.8 and 1544 which works out to be 375.2 and 386 per quarter. The number of customer transactions in the first 9 months of FY2024 and FY2025 is 1236.8 and 1235 which works out to be 412.3 and 412 per quarter.
While customers are still shopping at HD, one of my concerns is the average ticket measure.
On the Q3 2025 earnings call, management states:
Turning to our merchandising department comp performance for the second quarter, 12 of our 16 merchandising departments posted positive comps, including storage, bath, hardware, building materials, indoor garden, electrical, kitchen, outdoor garden, millwork, power, plumbing and appliances.
During the second quarter, our comp average ticket increased 1.4%, and comp transactions decreased 0.4%. The growth in our comp average ticket primarily reflects a greater mix of higher ticket items, inflation from core commodity categories, including lumber and copper, and a modest decrease in promotional activity relative to prior years.
Big ticket comp transactions, or those over $1,000, were positive 2.6% compared to the second quarter of last year. We were pleased with the performance we saw in categories such as building materials, lumber and hardware.
However, we continue to see softer engagement in larger discretionary projects where customers typically use financing to fund the renovation project.
Operating Cash Flow (OCF), Free Cash Flow (FCF), and CAPEX
HD is the industry leader in the highly competitive and cyclical retail home improvement industry.
HD is highly focused on its capital allocation and while the FCF/Net Earnings ratio in FY2021 and FY2022 was well below levels in other years, we need to appreciate the impact of the COVID pandemic on the entire construction industry.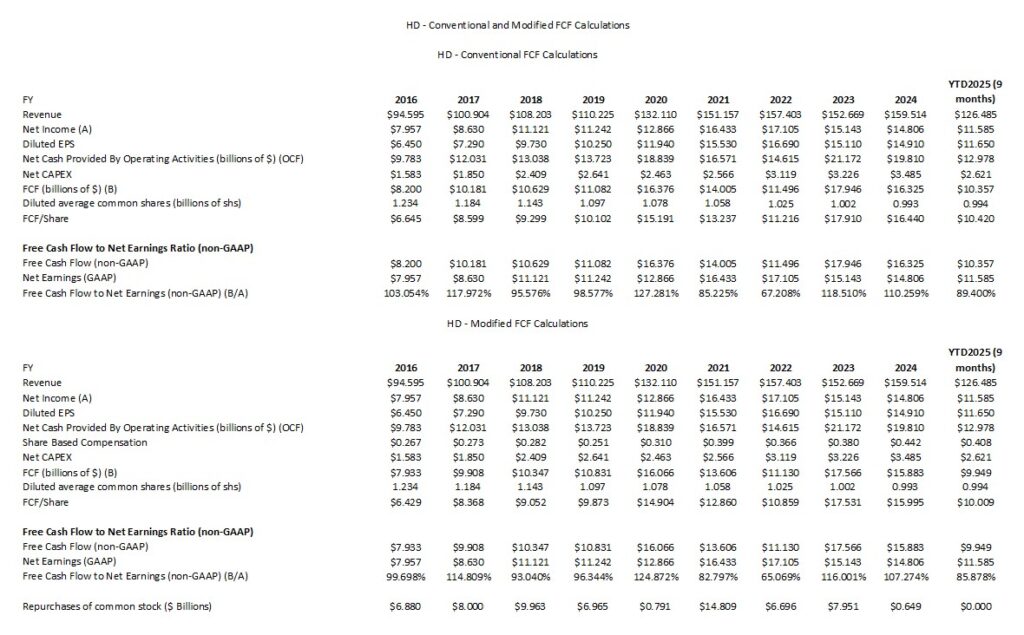
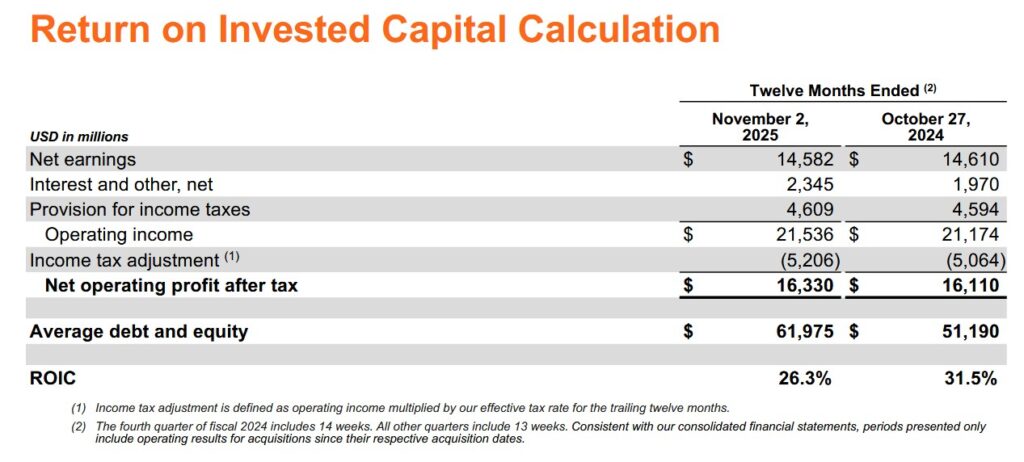
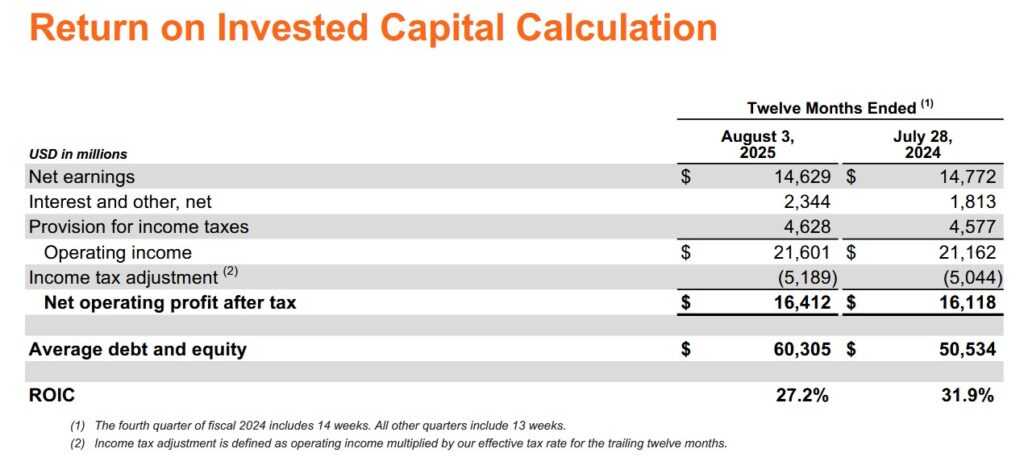
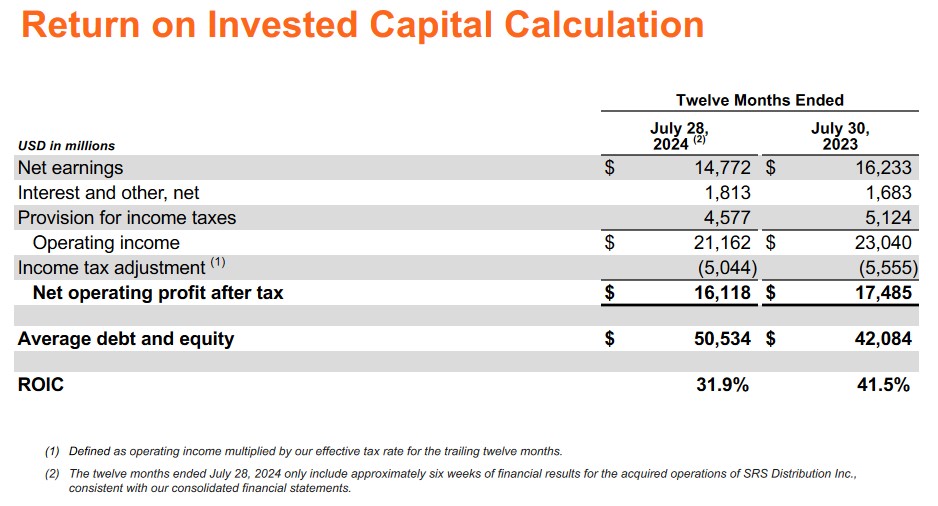
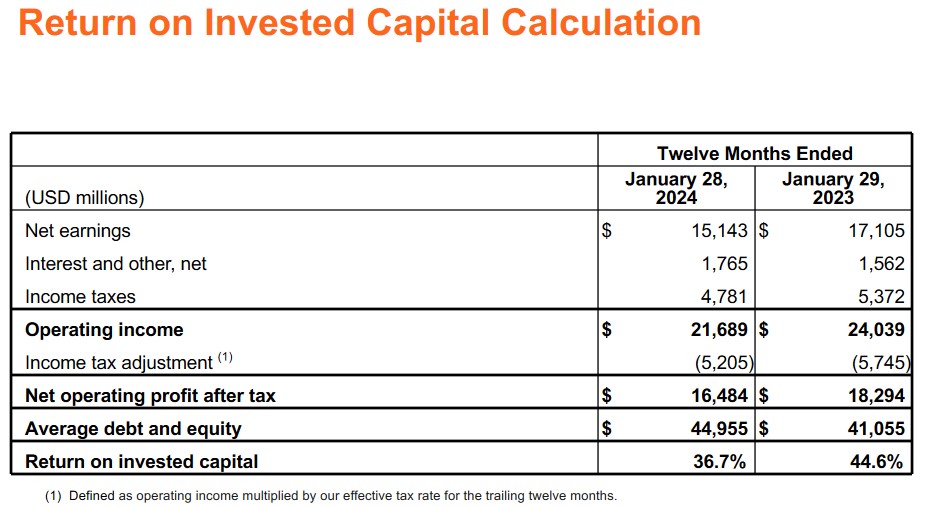
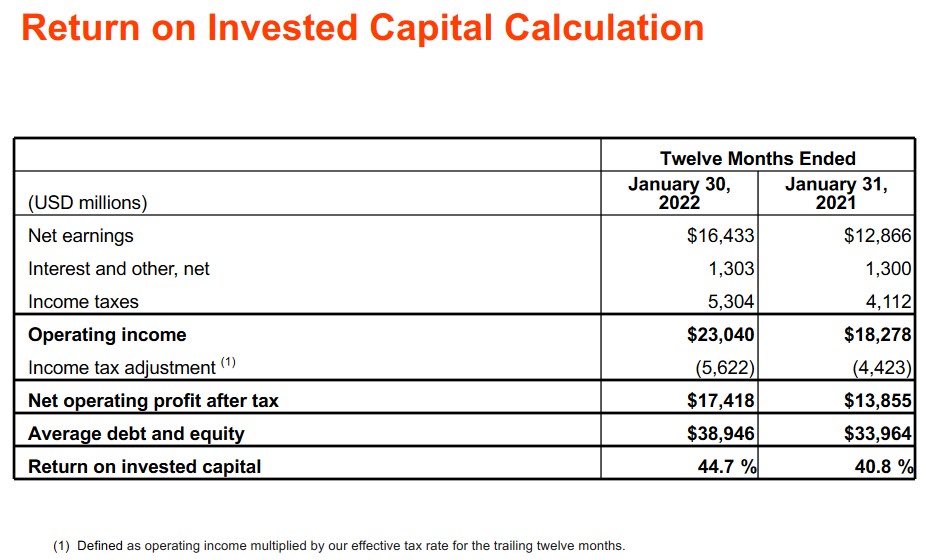
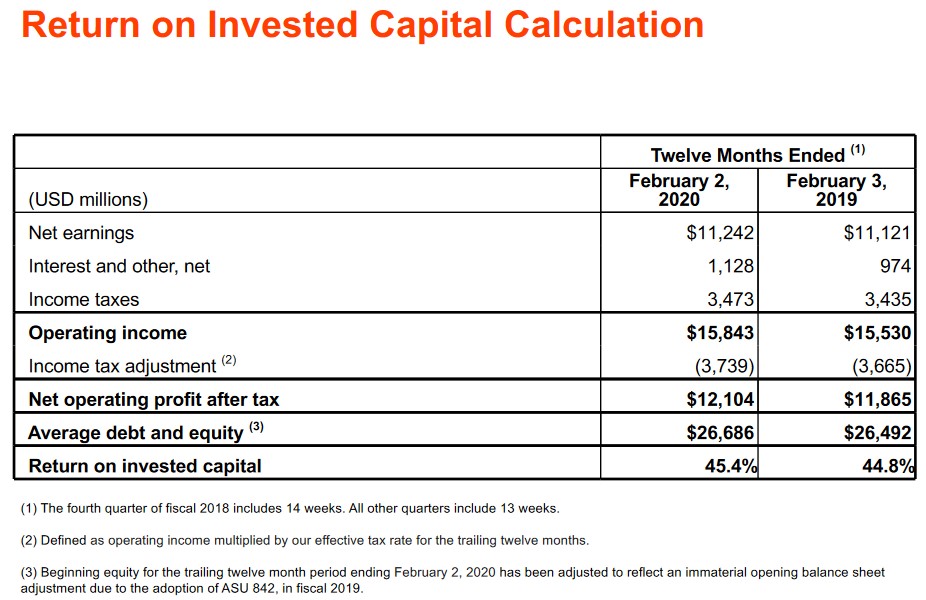
Return On Invested Capital (ROIC)
High quality companies often generate a high ROIC. If a company generates a high ROIC, it needs to invest less to achieve a certain growth rate thus reducing the need for external capital.
When a company consistently generates a high ROIC over the long term and it is growing its revenue, it can reinvest a portion of its profits under favorable conditions thereby leading to a compounding effect. I would much rather invest in a growing company that can reinvest to create greater shareholder value than to invest in a company that has limited growth opportunities and thus chooses to distribute a growing dividend.
A company that generates $0.15/profit for every $1 invested, for example, achieves a ROIC of 15%. I consider a ~15%+ ROIC to be a reasonable minimum threshold because most of the time, a company’s cost of capital will be lower than this level. HD’s ROIC in recent years consistently exceeds this level but has fallen from the mid 40% range to the mid 20% range.
The trend is not encouraging but this is not the only consideration when investing in a company. We must also consider that HD’s business is very cyclical. As investors, we should not be focusing on what is likely to happen within the next couple of years but rather the likely performance over the very long-term. I suspect management is acutely aware of the gradual deterioration in HD’s ROIC and measures are being taken to improve it over the next few years.
Capital Allocation
HD’s capital allocation principles are:
- reinvest in the business to drive growth faster than the market;
- pay a quarterly dividend after meeting the needs of the business; and
- return excess cash to shareholders through share repurchases after reinvesting in the business and paying a dividend.
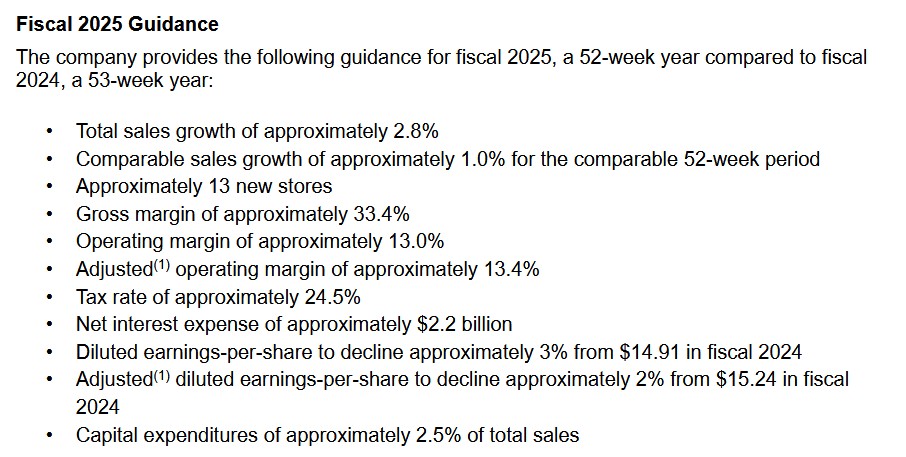
HD continues to provide FY2025 guidance in which CAPEX will be ~2.5% of FY2025 sales.
In Q3, HD reinvested ~$0.9B in the form of CAPEX and distributed ~$2.3B in dividends.
FY2025 Guidance
Despite economic uncertainty, HD and many other retailers in the US are expecting a sales boost during the holidays this year. Thanksgiving retail week is a crucial period for big retailers with ~20% of annual sales happening between Black Friday and Cyber Monday.
On the Q3 earnings call, management states:
As we turn our attention to the fourth quarter, we’re looking forward to the excitement we will bring with our annual holiday, Black Friday and Gift Center events.
HD, however, faces a nationwide ‘We Ain’t Buying It’ boycott scheduled to occur November 27 – December 1. This planned boycott, organized by grassroots organizations Black Voters Matter, Indivisible and Until Freedom, is pushing consumers across US to ‘hit pause on shopping from major corporations’. This boycott specifically targets Amazon, Target, and Home Depot. These grassroots organizations accuse each company of ‘undermining democracy’. These groups have specifically taken issue with HD’s alleged cooperation with U.S. Immigration and Customs Enforcement (ICE) in its immigration crackdown efforts. HD, however, denies working with ICE on deporting undocumented immigrants.
This most recent boycott effort comes after The People’s Union organized a boycott of HD during July due to the company’s decision in March to quietly remove its diversity, equity and inclusion page from its website.
There are several changes to HD’s FY2025 guidance given:
- softer-than-expected results in Q3;
- continued pressure in Q4 from the lack of storm activity; and
- ongoing consumer uncertainty and housing pressure.
On a positive note, guidance now includes the GMS acquisition.
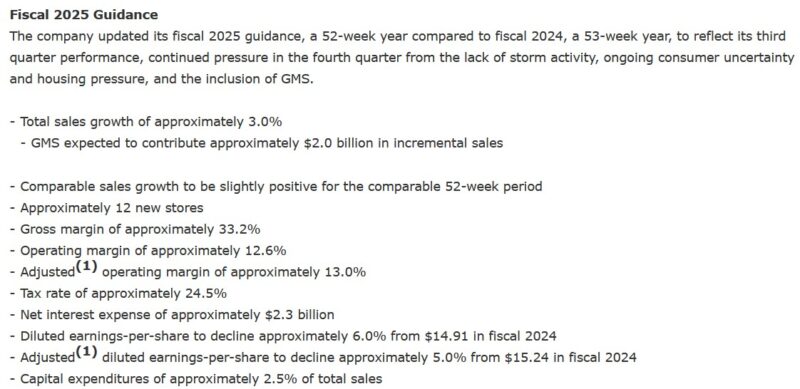
This is HD’s FY2025 guidance at the time of its release of Q2 2025 results.
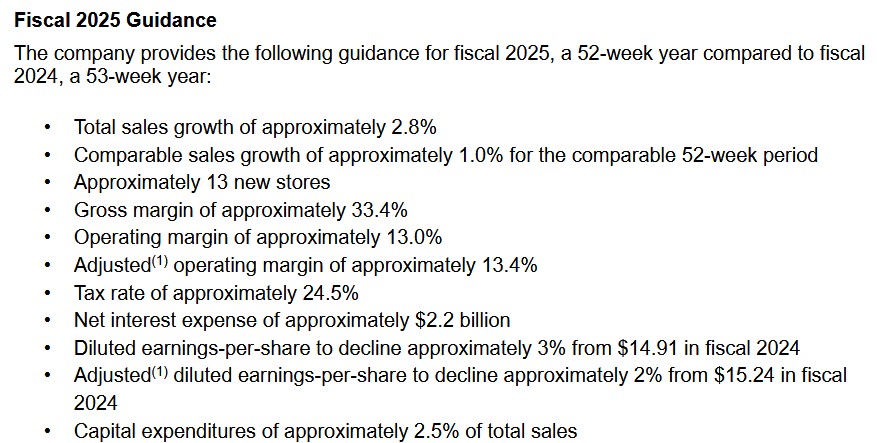
The following is HD’s guidance at the time of its release of Q1 2025 results.
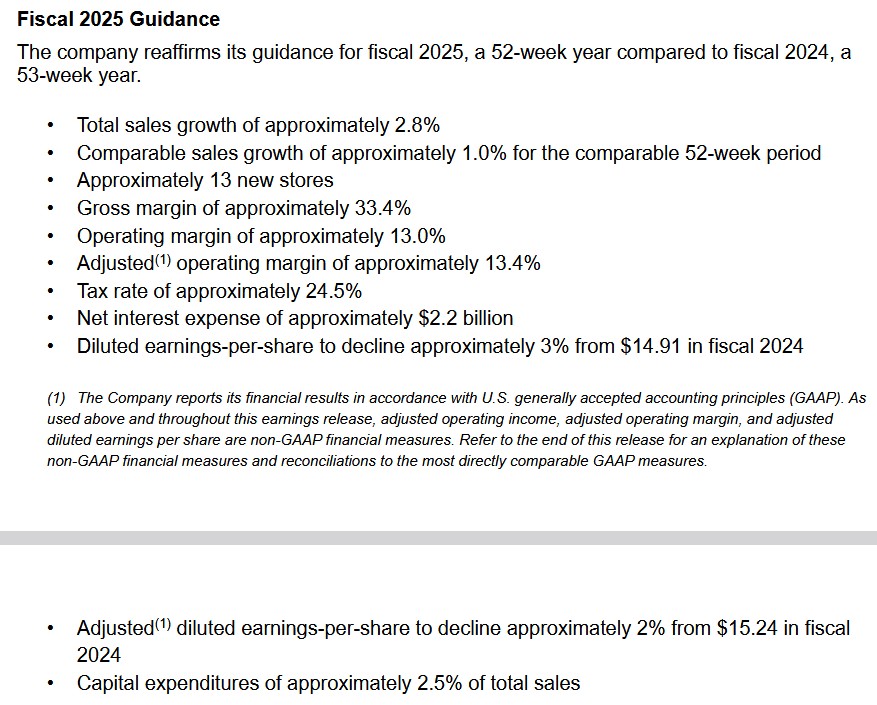
The following is HD’s guidance at the time of its release of Q4 2024 results.
Risk Assessment
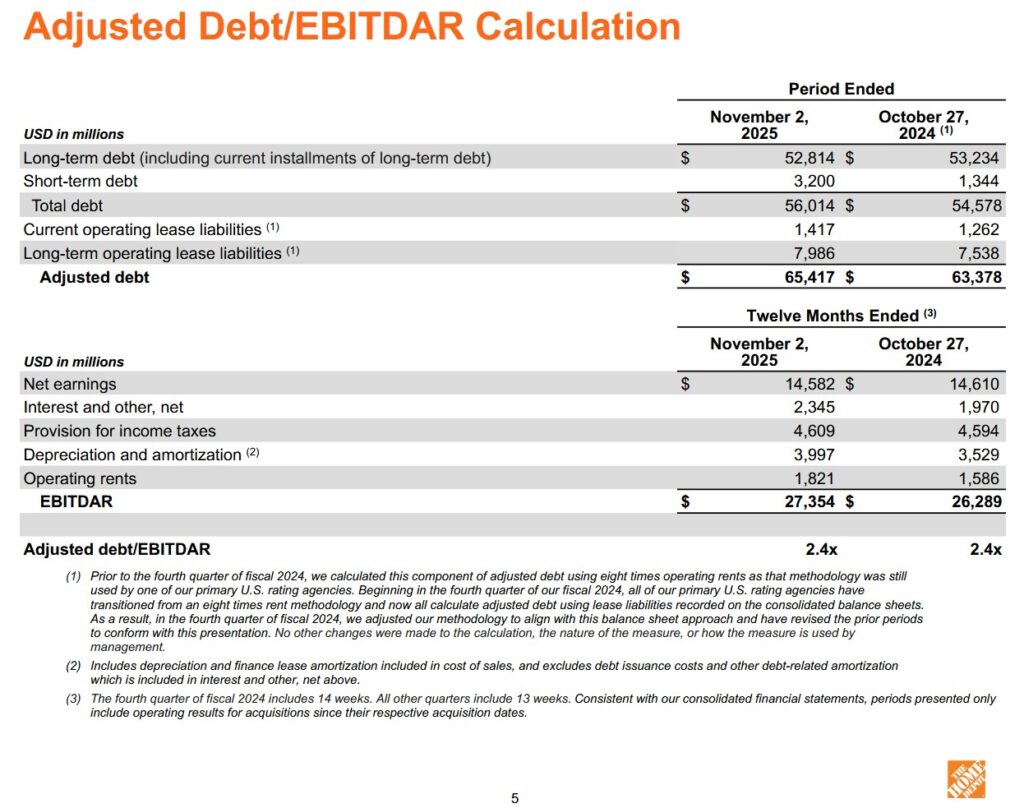
The currently available Q3 2025 information does not include a schedule of HD’s long-term debt. We know, however, that the increase in debt is primarily attributed to the acquisition of GMS; only 8 weeks of GMS results are included in HD’s Q3 results.
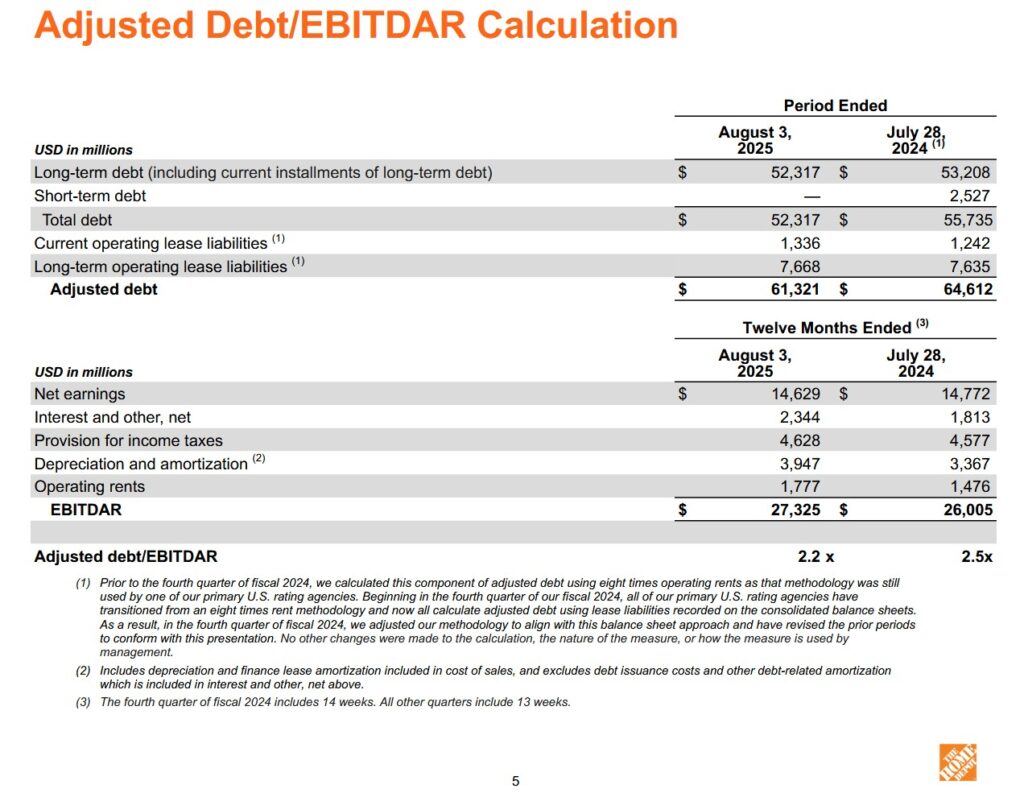
NOTE: HD defines EBITDAR as net earnings before interest and other, net, income taxes, depreciation and amortization, and operating rents calculated on a trailing twelve month basis.
There is no change to HD’s senior unsecured domestic currency credit ratings following my prior post. The ratings and outlook remain:
- Moody’s: A2 and stable – last reviewed March 28, 2024;
- S&P Global: A and stable – last reviewed August 26, 2025; and
- Fitch: A and stable – last reviewed October 7, 2025.
These ratings are the middle tier of the upper-medium grade category. They define HD as having a STRONG capacity to meet its financial commitments. However, it is somewhat more susceptible to the adverse effects of changes in circumstances and economic conditions than obligors in higher-rated categories.
These investment-grade ratings are acceptable for my purposes.
Dividends and Share Repurchases
Dividend and Dividend Yield
HD’s dividend history is accessible here.
Share Repurchases
No shares have been repurchased YTD2025.
In August 2023, HD’s Board approved a $15B share repurchase authorization with no prescribed expiration date. This replaced the previous $15B authorization which was approved in August 2022.
HD paused share repurchases in March 2024 because of its acquisition of SRS Distribution. As of November 2, 2025, ~$11.7B of the $15.0B share repurchase authorization remained available.
Valuation
HD’s FY2025 guidance calls for diluted EPS to decline ~6% (previously ~3%) from $14.91 in FY2024 (now ~$14.02) and adjusted diluted EPS to decline ~5% (previously ~2%) from $15.24 in FY2024 (now ~$14.48).
With HD’s share price having closed at $336.48 on November 18, we get a ~24 forward diluted PE and a ~23.2 forward adjusted diluted PE.
NOTE: The broker estimates reflect the current fiscal year as being FY2026 despite HD treating the current fiscal year as being FY2025.
HD has very recently released its Q3 2025 results. Given HD’s revisions to its FY2025 outlook and current market conditions, I anticipate brokers with estimates at the upper end of the following adjusted diluted EPS ranges will be lowering their estimates over the coming days. For now, however, this is HD’s forward valuation using currently available estimates and the current ~$336.48 share price:
- FY2026 – 33 brokers – mean of $14.70 and low/high of $14.45 – $15.22. Using the mean estimate, the forward adjusted diluted PE is ~22.9.
- FY2027 – 33 brokers – mean of $15.73 and low/high of $14.71 – $16.74. Using the mean estimate, the forward adjusted diluted PE is ~21.4.
- FY2028 – 26 brokers – mean of $17.17 and low/high of $16.00 – $18.90. Using the mean estimate, the forward adjusted diluted PE is ~19.6.
- FY2029 – 7 brokers – mean of $18.75 and low/high of $17.71 – $20.00. Using the mean estimate, the forward adjusted diluted PE is ~17.95.
HD’s FCF/Diluted EPS ratio for the current fiscal year will very likely be weaker than forward diluted P/E levels. If HD’s FCF/Diluted EPS ratio comes in at ~95% and ~91% when calculated under the conventional and the modified methods, we can expect HD’s valuation based on FCF to be marginally higher than the ~24 forward diluted PE and ~23.2 forward adjusted diluted PE (based on management’s guidance).
For comparison, I wrote the following in my August 21, 2025 post:
HD’s FY2025 guidance calls for diluted EPS to decline ~3% from $14.91 in FY2024 (or ~$14.46) and adjusted diluted EPS to decline ~2% from $15.24 in FY2024 (or ~$14.94).
As I compose this post, HD’s share price is ~$401.74. Based on management’s FY2025 guidance, we get a ~27.8 forward diluted PE and a ~27 forward adjusted diluted PE.
NOTE: The broker estimates reflect the current fiscal year as being FY2026 despite HD treating the current fiscal year as being FY2025.
HD has very recently released its Q2 results. I, therefore, expect a slight adjustment to adjusted diluted EPS broker estimates over the coming days. For now, however, this is HD’s forward valuation using currently available estimates and the current ~$401.74 share price:
- FY2026 – 33 brokers – mean of $15.01 and low/high of $14.93 – $15.30. Using the mean estimate, the forward adjusted diluted PE is ~26.8.
- FY2027 – 33 brokers – mean of $16.28 and low/high of $15.45 – $16.83. Using the mean estimate, the forward adjusted diluted PE is ~24.7.
- FY2028 – 24 brokers – mean of $17.73 and low/high of $16.20 – $18.90. Using the mean estimate, the forward adjusted diluted PE is ~22.7.
I anticipate that HD’s FCF/Diluted EPS ratio for the current fiscal year will be ~100% when calculated under the conventional method and ~97% when calculated under the modified method. Given this, HD’s valuation based on FCF will likely be marginally higher than the ~27.8 forward diluted PE and a ~27 forward adjusted diluted PE (based on management’s guidance).
I was of the opinion HD’s valuation was rich at the time of my August 15, 2024 post. Now, its valuation is even less attractive. I, therefore, have no intention of immediately increasing my exposure.
Final Thoughts
My Final Thoughts in my prior post are unchanged:
As the industry leader by a wide margin, HD will likely benefit from industry consolidation. The recent addition of SRS and the impending acquisition of GMS bode well for its continued dominance.
The housing market in many key US and Canadian regions in which HD operates are struggling. On the Q2 2025 earnings call with analysts, management states:
Certainly, some relief on mortgage rates, in particular, could help, I think, referring to it a bit of a frozen housing market with 40-plus year low turnover rates, and even new starts are struggling a bit.
In addition to stagnant real estate growth, the implementation of tariffs have led to a highly uncertain macroeconomic environment. Fortunately, HD sources over 50% of its products domestically from within the US. These products are not subject to tariffs. Imported goods will, obviously, experience upward price pressure as a result of various tariff rates. Management is of the opinion, however, that significantly higher prices will not be broad based.
Given the current economic environment, many consumers are reining in their spending. As a result, HD’s key sales metrics will likely continue to experience short-term pressure.
A fair price appears to be closer to ~$330 versus the current ~$401.74. At ~$330 and using management’s FY2025 guidance of $14.46 diluted EPS and ~$14.94 adjusted diluted EPS, we arrive at a more reasonable forward diluted PE of ~22.8 and adjusted forward diluted PE of ~22.1.
HD certainly faces short-term challenges but so do its competitors. The company is the industry leader and weaker competitors are likely to fall by the wayside if the current business conditions persist. This bodes well for HD.
I first invested in HD in the early 2000s but exited my position after making a quick profit. In hindsight, I wish I had had a long-term investor mindset decades ago. I shudder to think how much further ahead I would be financially if I had adopted a ‘buy and hold’ mindset decades ago.
My HD exposure is currently 264 shares (average cost of ~$305.16) held in a ‘Side’ account within the FFJ Portfolio. I initiated my current HD exposure on April 4, 2022 @ ~$303.36/share. At the time, I deemed shares to be attractively valued. Now? HD’s valuation is even more attractive and this is because of the significant headwinds the company faces.
The current headwinds are unlikely to resolve themselves in the foreseeable future. I, therefore, think HD’s share price (and valuation) have the potential to become more attractive. Given this, I do not intend to immediately increase my exposure. I do, however, have my sights set on increasing my exposure.
I wish you much success on your journey to financial freedom!
Note: Please send any feedback, corrections, or questions to finfreejourney@gmail.com.
Disclosure: I am long HD.
Disclaimer: I do not know your circumstances and do not provide individualized advice or recommendations. I encourage you to make investment decisions by conducting your research and due diligence. Consult your financial advisor about your specific situation.