At the time of my prior Cintas post (CTAS), the most currently available financial information was for Q3 and YTD2025. Fast forward and we now have Q4 and FY2025 results and FY2026 outlook thus prompting me to revisit this existing holding.
Business Overview
Part 1 Item 1 in the FY2024 Form 10-K and the company’s website provide a good overview of the company.
CTAS’s Acquisition Strategy
Acquisitions are a core component of CTAS’s growth strategy. In FY2022 – FY2025, CTAS acquired businesses net of cash acquired totaling (in $ Millions) ~$164.2, $46.4, $186.8, and $232.9. FY2025 was CTAS’s largest year of M&A activity in almost 20 years, excluding the ~$2.2B acquisition of G&K Services in 2017.
Because of the assumptions used to value the acquired intangible assets, actual results over time could vary from original estimates. Impairment of service contracts and other assets is determined through specific identification. CTAS, however, has recognized $0 impairment for FY2022 – FY2025. This demonstrates the company’s discipline when it comes to how much it is prepared to pay for acquisitions.
Financials
Q4 and FY2025 Results
The Q4 and FY2025 July 17 earnings release is accessible through CTAS’s website for which there is a link to the company’s EDGAR Filings on the SEC website. The Form 10-K will be accessible at a later date.
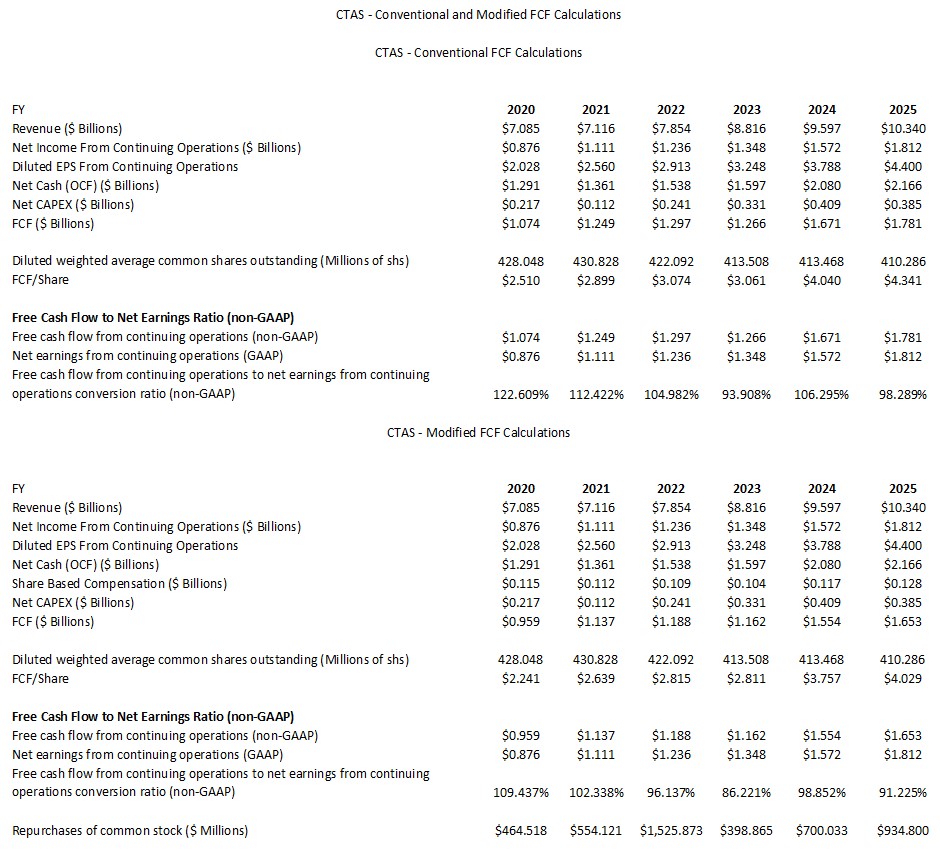
Conventional And Modified Free Cash Flow (FCF) Calculations (FY2020 – FY2025)
FCF is a non-GAAP measure, and therefore, its method of calculation is open to debate. Most companies subtract capital expenditures (CAPEX) from Net Cash Provided by Operating Activities found in the Consolidated Statement of Cash Flows.
The following reflects CTAS’s annual FCF for the FY2020 – FY2025 time frame. The ‘conventional’ calculations do not deduct share-based compensation (SBC) while the ‘modified’ calculations deduct SBC. In several posts, I touch upon why I deduct SBC when analyzing a company’s FCF.
FY2026 Outlook
- FY2025 and FY2026 have the same number of workdays for the year and by quarter;
- The exclusion of any future acquisitions;
- A constant foreign currency exchange rate;
- FY2026 net interest of ~$0.098B.
- A ~20% effective tax rate which is the same as FY2025.
Risk Assessment
At the end of Q3 2025, CTAS had ~$0.45B of debt due within 1 year. We see from the FYE2025 Consolidated Condensed Statements of Cash Flows that CTAS repaid the $0.45B senior notes maturing in 2025. A portion of the proceeds to repay this debt was from $0.4B of newly issued debt. The company now has no short-term debt and the earliest fiscal year maturity of its long-term debt is 2027.
CTAS’s domestic senior unsecured long-term debt ratings are:
- Moody’s: A3 with a stable outlook (last reviewed on May 7, 2025)
- S&P Global: A- with a stable outlook (last reviewed on March 10, 2025)
Both ratings are the bottom tier of the upper medium-grade investment-grade category. These ratings define CTAS as having a strong capacity to meet its financial commitments. It is, however, somewhat more susceptible to the adverse effects of changes in circumstances and economic conditions than obligors in higher-rated categories.
Dividends and Share Repurchases
Dividend and Dividend Yield
CTAS’s dividend history is accessible here. The 4:1 stock split in September 2024 explains why the December 2024, March 2025, and June 2025 dividends are $0.39 versus $1.56 September 2024 dividend.
Little of CTAS’s total long-term shareholder return is likely to come from the quarterly dividend. I, therefore, recommend assigning little weight to the dividend as part of your analysis.
Stock Splits and Share Repurchases
CTAS’s stock split history is:
- September 11, 2024: 4:1
- November 18, 1997: 2:1
- April 2, 1992: 2:1
- April 2, 1991: 1.5:1
- April 2, 1987: 2:1
The table provided earlier in this post reflects the dollar value of shares repurchased and the diluted weighted average common shares outstanding in FY2020 – FY2025.
Valuation
CTAS generated $4.40 of diluted EPS in FY2025. Using the current $224.50 share price as I compose this post on July 18, CTAS’s P/E is ~51.
Its FY2025 FCF (conventional and modified) is ~$4.341 and ~$4.029. Using the $224.50 share price, the P/FCF (conventional and modified) is ~51.7 and ~55.7.
The current FY2026 adjusted diluted EPS outlook is $4.71 – $4.85 giving us a forward adjusted PE range of ~46.3 – ~47.7.
Its valuation using the current broker guidance and the current $224.50 share price is:
- FY2026 – 21 brokers – mean of $4.85 and low/high of $4.76 – $5.01. Using the mean, the forward adjusted diluted PE is ~46.3.
- FY2027 – 16 brokers – mean of $5.35 and low/high of $5.13 – $5.52. Using the mean, the forward adjusted diluted PE is ~42.
- FY2028 – 8 brokers – mean of $5.91 and low/high of $5.51 – $6.19. Using the mean, the forward adjusted diluted PE is ~38.
Looking at CTAS’s FY2020 – FY2025 FCF conversion ratio, I estimate that the FY2026 FCF conversion ratio will be ~98% and ~94%. On this basis, my FY2026 FCF/share estimate is ~$4.62 – ~$4.75 calculated under the conventional method. Under the modified method, this drops to ~$4.43 – ~$4.56. With shares currently trading at $224.50, the forward P/FCF is ~47.3 and ~48.6 using the FY2026 conventional FCF estimates and ~49.2 and ~50.7 using the FY2026 modified FCF estimates.
For comparison purposes, I wrote the following in my previous post.
When I last reviewed CTAS in my December 19, 2024 post, CTAS had reported $2.19 of diluted EPS in the first half of FY2025. Using the current ~$183 share price and a conservative FY2025 diluted EPS estimate of ~$4.25 – ~$4.30, the forward diluted PE was ~42.6 – ~43.06.
Management’s revised FY2025 diluted EPS guidance was $4.28 – $4.34 giving us a forward diluted PE of ~42.2 – ~42.8.
Its valuation using broker guidance was:
- FY2025 – 19 brokers – mean of $4.25 and low/high of $4.21 – $4.34. Using the mean, the forward adjusted diluted PE is ~43.06.
- FY2026 – 19 brokers – mean of $4.70 and low/high of $4.54 – $4.92. Using the mean, the forward adjusted diluted PE was ~39.
- FY2027 – 10 brokers – mean of $5.15 and low/high of $4.91 – $5.53. Using the mean, the forward adjusted diluted PE was ~35.5.
I also estimated FCF in the second half of FY2025 would be similar to that of the first half thus giving me a FCF/share of ~$3.44 and ~$3.12 using the conventional and modified methods of calculating FCF. With a ~$183 share price, the P/FCF was ~53.2 and 58.7.
When I last reviewed CTAS, the company had generated $3.31 of diluted EPS in the first 9 months of FY2025. I estimated its FY2025 diluted EPS would be ~$4.40 or the upper end of management’s $4.36 – $4.40 guidance. Using the ~$206.50 share price at the time I finalized my April 2, 2025 post, the forward diluted PE was ~47.
Its valuation using the current broker guidance was:
- FY2025 – 20 brokers – mean of $4.38 and low/high of $4.32 – $4.41. Using the mean, the forward adjusted diluted PE is ~47.1.
- FY2026 – 20 brokers – mean of $4.83 and low/high of $4.69 – $4.94. Using the mean, the forward adjusted diluted PE was ~42.8.
- FY2027 – 12 brokers – mean of $5.31 and low/high of $5.02 – $5.58. Using the mean, the forward adjusted diluted PE was ~38.9.
At the end of Q3, CTAS’s FCF was ~$3.069 and ~$2.831 using the conventional and modified methods of calculating FCF. I estimated that it would generate a comparable amount of FCF in Q4 as in each of the prior 3 quarters. In doing so, I estimated ~$4.09 and ~$3.77 of FCF calculated using the conventional and modified methods. Using the current ~$206.50 share price, the forward P/FCF was ~50.5 and ~54.8.
Final Thoughts
There are currently 500 shares held in a ‘Side’ account in the FFJ Portfolio at an average cost of ~$184.56. This exposure was insufficient for CTAS to be amongst my top 30 holdings when I completed my 2025 Mid-Year Portfolio Review.
In FY2016 and FY2025, CTAS generated ~$4.8B and ~$10.34B of revenue, respectively. The current FY2026 revenue outlook is $11B – $11.15B. Looking at the top line growth over several years, it seems reasonable that CTAS will generate ~$14B of revenue by FY2035. If it can continue to generate ~15% – ~17% Net Income From Continuing Operations as a percentage of Revenue (16.4% and 17.5% in FY2024 and FY2025), it could generate ~$2.1B – ~$2.38B in FY2035.
Naturally, trying to extrapolate data a decade into the future is fraught with risk. I would not, therefore, rely heavily on my FY2035 assumptions.
Furthermore, I place virtually no reliance on broker earnings estimates beyond the current fiscal year. It is clear from the variance in earnings estimates that there are meaningful opinions in CTAS’s earnings expectations. We also know that earnings can be manipulated so I prefer to gauge a company’s valuation using FCF. FCF is a non-GAAP metric so the manner in which it is calculated is inconsistent. By consistently calculating FCF in the same manner, however, I can compare CTAS’s valuation over several years.
The swoon in CTAS’s share price in late December 2024 provided investors with an opportunity to acquire just slightly overvalued shares. In hindsight I should have added to my CTAS exposure in early April when we experienced a broad market meltdown. Instead, I deployed some of my surplus cash to make other purchases. Despite my failure to increase my CTAS position subsequent to late December 2024, I do intend to increase my exposure. I am, however, reluctant to acquire CTAS shares at the current valuation.
I am prepared to acquire additional CTAS shares under ~$210. At ~$210 and using the approximate mid-points of my FY2026 FCF range assumptions (~$4.70 under the conventional method and ~$4.50 under the modified method) the P/FCF would be ~44.7 and ~46.7. This valuation is still ‘rich’ but sometimes we have to ‘pay up’ if we want to invest in high quality companies that have a dominant position in their industry.
I wish you much success on your journey to financial freedom!
Note: Please send any feedback, corrections, or questions to finfreejourney@gmail.com.
Disclosure: I am long CTAS.
Disclaimer: I do not know your circumstances and do not provide individualized advice or recommendations. I encourage you to make investment decisions by conducting your research and due diligence. Consult your financial advisor about your specific situation.
I wrote this article myself and it expresses my own opinions. I do not receive compensation for it and have no business relationship with any company mentioned in this article.