
Rollins (ROL) may not appeal to some investors because the nature of its business is not ‘sexy’. Sometimes, however, ‘ho hum’ businesses can offer investors the potential for very reasonable long-term total shareholder returns.
Through its family of brands, ROL provides pest control, termite services and wildlife removal to residential and commercial customers.
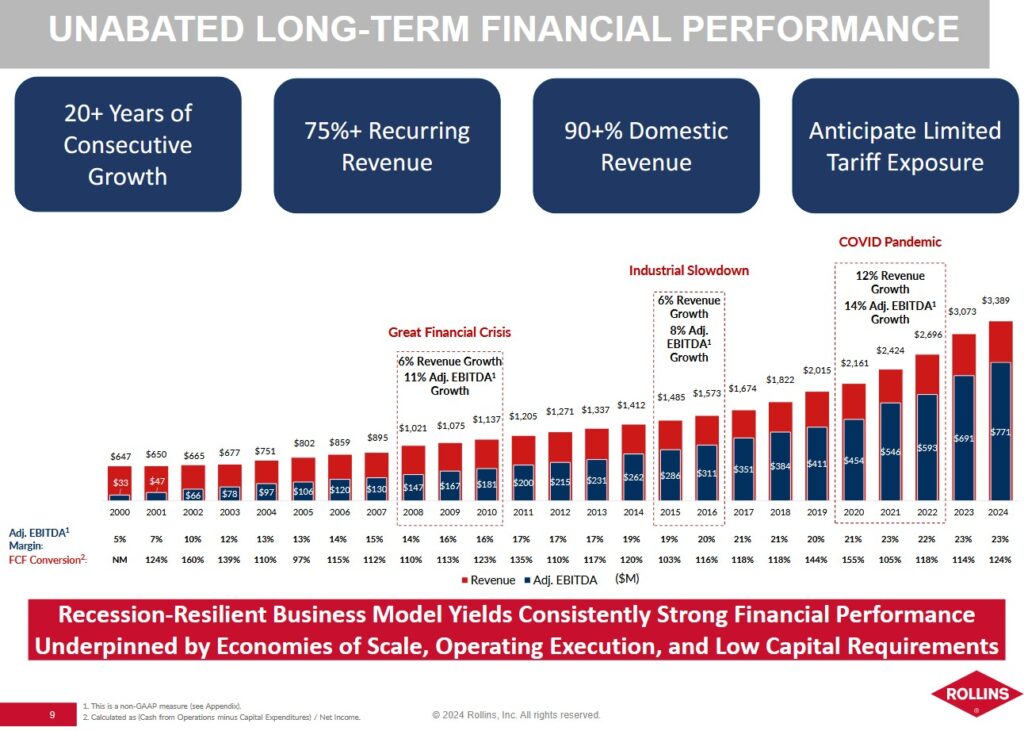
Looking at ROL’s performance over the last 20 years, we see steady growth and an attractive recurring revenue metric. Another bonus in the current environment is that the nature of the business means very little cross-border activity. Tariff related risks are, therefore, limited.
Several aspects of this business appealed to me when I first analyzed the company and on June 10, 2021, I initiated a 500 share position @ ~$33.14 in one of the ‘Core’ accounts in the FFJ Portfolio. I subsequently acquired another 100 shares on September 7, 2023 @ ~$34.86 in the same account. With the reinvestment of the dividend income, my current exposure is 614 shares.
I last reviewed Rollins (ROL) in this February 14, 2025 post at which time the most current financial information was for Q4 and FY2024.
On April 24, 2025, ROL released its Q1 2025 results. Although I compose this post on June 27 and Q2 2025 ends on June 30, I revisit ROL as part of my ongoing process of staying current with the performance of my investment holdings.
Business Overview
At the May 6, 2025 Barclays Americas Select Franchise Conference 2025, ROL’s EVP & CFO indicated the total addressable market globally is ~$20B+. ROL’s FY2024 annual revenue was only ~$3.39B. ROL has company owned and franchise owned operations in multiple countries with 93% of the business being in the US and 7% outside the US being primarily in Canada, the UK, Singapore, and Australia.
The best way to learn about the company is to review Item 1 and 1-A in Part 1 in ROL’s FY2024 Form 10-K where we find a comprehensive business overview.
NOTE: The Rollins family ownership is ~40%.
As noted in prior posts, achieving scale is paramount; spreading fixed costs across a larger revenue base and improving local route density are essential. Technician ‘downtime’ must be minimized. In order to improve operations, ROL invests in technology to improve customer satisfaction, reduce costs, and increase efficiency with its technicians and administration. A high level description of the various programs that help ROL (Business Operations Support System (BOSS) – the company’s branch operating system, Virtual Route Manager (VRM), Orkin 2.0, BizSuite and InSite) is found here.
ROL has strong focus on accelerating recurring organic growth. It does, however, grow through acquisitions. In FY2024, it completed 44 acquisitions (32 acquisitions and 12 franchise buybacks). In the first quarter of 2025, it made 4 acquisitions.
The industry is highly fragmented which presents ROL with a lengthy list of acquisition opportunities. On April 2, 2025, ROL announced the completion of its acquisition of Saela. ROL expects Saela will add ~$45 – ~$50 million of revenue in FY2025 with ~$15 million in Q2. From an EBITDA standpoint, Saela’s margin profile is neutral to ROL’s and management anticipates the deal will be accretive to earnings in the first full year of ownership. Further details are to be provided on the Q2 earnings call in July.
Most of the acquisition opportunities are on the residential side of the business.
The commercial segment of ROL’s business is ~35% where client retention is 90+%; this is primarily performed under the ORKIN brand.
In many areas of the US, to close a real estate sale requires a ‘termite bond’. Termites are very common in the US, causing significant damage and financial losses annually. They are found in all states except Alaska, with the highest concentration in warmer, southern regions. Each year, termites are responsible for around $5B in damage and treatment costs for homeowners. This presents a great growth opportunity for ROL.
Financials
Q1 2025 Results
Material related to ROL’s Q4 and FY2024 results is accessible here.
ROL’s current ratio (current assets minus current liabilities) is typically under 1. At the end of Q1 2025, current assets were ~$0.556B and current liabilities were $0.637B. Just over $0.191B of the current liabilities, however, is unearned revenue. This represents the receipt of funds prior to the rendering of services. If we exclude the unearned revenue because this is not a cash outlay, the current liabilities are ~$0.446B.
ROL has ~$0.485B of long-term debt. Note 7 – Debt in the Q1 2025 Form 10-Q reflects details of these senior notes that mature in 2035. The entire amount is due in August 2035 and the effective interest rate was 5.6% as of March 31, 2025.
Operating Cash Flow (OCF), Free Cash Flow (FCF), and CAPEX
FCF is a non-GAAP metric, and therefore, there is no standardization in it calculation. In the vast majority of instances where companies calculate FCF, there is no deduction of share based compensation (SBC). While I calculate a company’s FCF using the ‘conventional’ method where there is no SBC is deduction, I deem it prudent to calculate FCF using a ‘modified’ method. Under the ‘modified’ method, I deduct SBC. The deduction of SBC might not have a material impact on the FCF calculations where SBC is a relatively insignificant component of employee compensation. Where SBC is a significant component of employee compensation, however, the variance in the FCF results calculated using both methods can be very significant!
Suppose we have two companies that choose to compensate their employees differently. Company #1 has salaries of $1,000,000 and company #2 has salaries of $750,000 and $250,000 of SBC. While both companies will deduct this compensation to determine Net Profit, Company #1 has $0 to add back in determining Net Cash generated from business operations on the Consolidated Statement of Cash Flows. Company #2, however, can add back $250,000 because it has not disbursed cash. In this example, company #2’s OCF is superior (all else being equal).
Depending on the ‘make up’ of company #2’s SBC, we could have a situation where the employees could ‘make out like bandits’. If company #2 is highly successful, the employees could receive company shares at vastly lower values than the values when they are permitted to sell their shares (which could be a few years in the future). Imagine being a shareholder who has to acquire shares on the open market at ~$150 yet the employees can acquire shares at ~$15!
Is compensating employees with the use of SBC not a form of ‘financing’? If so, should we reflect SBC under ‘Financing Activities’ on the Consolidated Statement of Cash Flows? Were this done, we would not add back SBC in determining ‘Net cash provided by operating activities’.
The following table reflects ROL’s FCF using the conventional method and the modified methods.
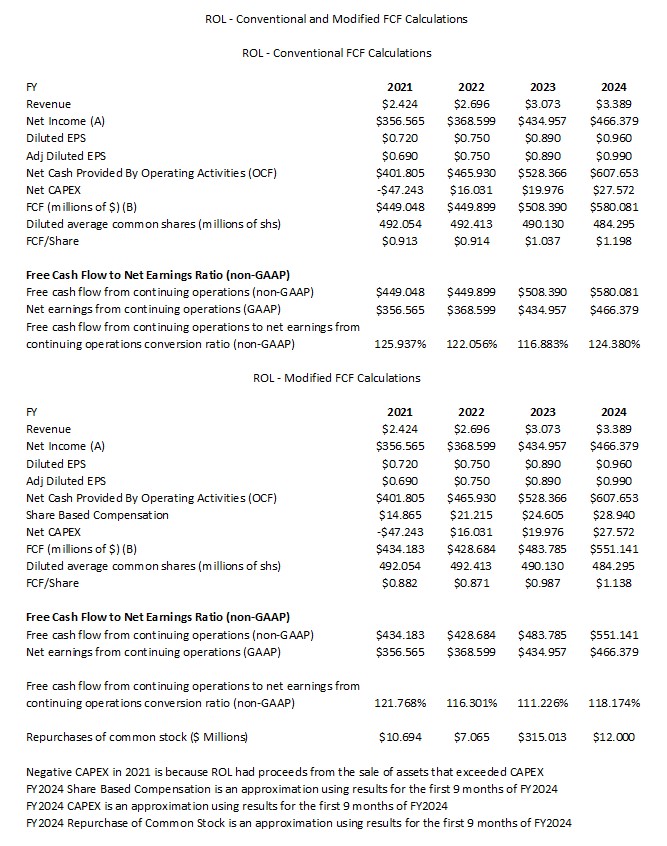
Looking at ROL’s Q1 2025 results, we see that ROL reports Q1 2025 FCF of ~$0.14B. SBC in Q1 2025, however, was ~$8.8 million. If we deduct SBC to determine Q1 2025 FCF, we get ~$0.1313B of FCF. The variance is not that significant since ROL’s SBC is typically modest. Many technology companies, however, have significant SBC. The variance in SBC calculated using the ‘conventional’ and ‘modified’ methods, therefore, can be very significant.
Tariffs
ROL does not see a major issue with tariffs. ROL’s cost structure is primarily ‘people’. ‘Fleet and material’ (both being ~3% of sales) is the second biggest component of ROL’s cost structure where tariffs are not that much of an issue. Most of the materials ROL procures are made in the US so it is not reliant upon other regions to supply the required chemicals.
Capital Allocation
ROL’s priorities are to:
- reinvest in the business;
- grow the dividend; and
- repurchase shares.
FY2025 Guidance
ROL is now starting to provide guidance.
Risk Assessment
There are no changes to ROL’s credit ratings subsequent to my February 14, 2025 post.
- Fitch: BBB+ long term issuer default rating. Initiated on February 13, 2025 and affirmed on March 21, 2025
- S&P Global: BBB local currency long term debt credit rating. Initiated on February 13, 2025.
Fitch’s rating is the top tier of the lower-medium grade investment grade category. S&P assigns a rating that is one tier lower. Bother ratings define ROL as having an adequate capacity to meet its financial commitments. Adverse economic conditions or changing circumstances, however, are more likely to lead to a weakened capacity for ROL to meet its financial commitments.
Management is committed to maintaining a strong investment-grade rating with leverage well under 2x supported by healthy cash flow generation and disciplined capital allocation.
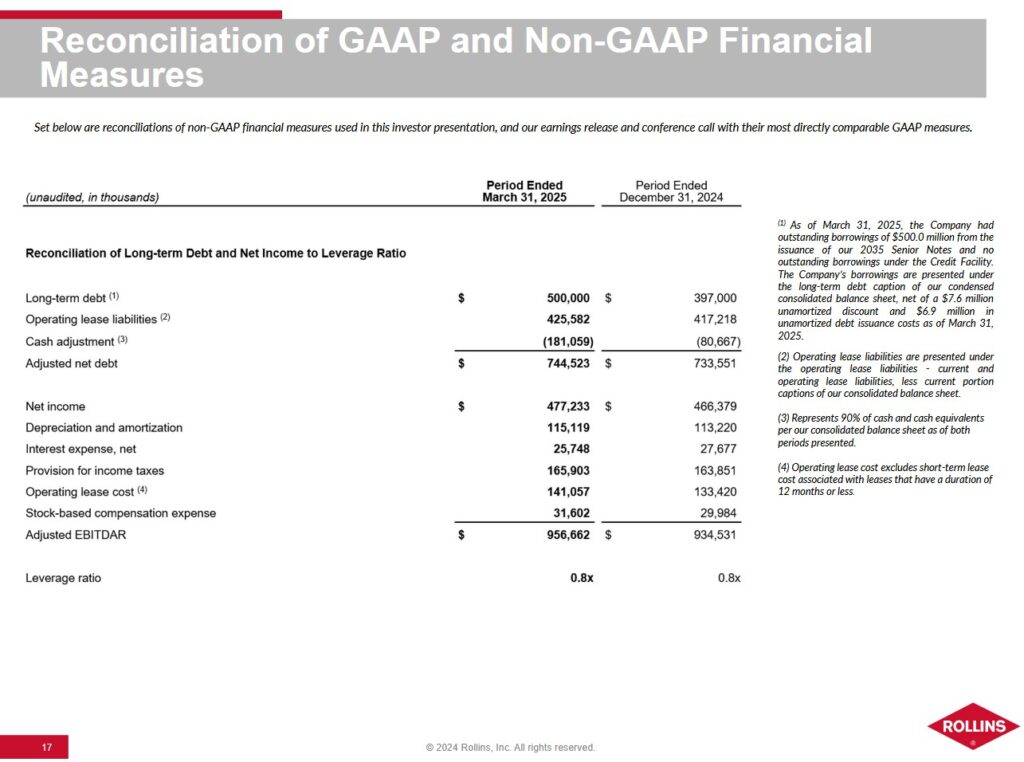
ROL’s leverage ratio is an assessment of overall liquidity, financial flexibility, and leverage and is to be calculated by dividing adjusted net debt by adjusted EBITDAR.
- Adjusted net debt is calculated by adding operating lease liabilities to total long-term debt less a cash adjustment of 90% of cash and cash equivalents.
- Adjusted EBITDAR is calculated by adding back to net income depreciation and amortization, interest expense, net, provision for income taxes, operating lease cost, and stock-based compensation expense.
Dividends, Share Repurchases, and Stock Splits
Dividend and Dividend Yield
ROL’s dividend history is accessible here. Focusing on dividend metrics is a fundamentally flawed way by which to assess a potential investment. Analyze an investment from potential total return (capital gains and dividends) and risk perspectives.
Share Repurchases
Reinvesting in the company (including mergers and acquisitions) and dividend distributions currently rank in priority to share repurchases from a capital allocation perspective.
Stock Splits
ROL has had stock splits over the years with the most recent being a 3-for-2 stock split in late 2020.
Valuation
In my February 14, 2025 post I wrote:
The high amortization expense related to multiple acquisitions makes it impractical to value ROL using Earnings per Share (EPS). Depreciation and Amortization are significant components of the ‘Adjustments to reconcile net income to net cash provided by operating activities’ in the Consolidated Statement of Cash Flows.
ROL’s current forward adjusted diluted PE levels using the adjusted diluted EPS broker estimates and the current ~$51.20 share price are:
- FY2025 – 12 brokers – mean of $1.11 and low/high of $1.08 – $1.14. Using the mean, the forward adjusted diluted PE is ~46.
- FY2026 – 12 brokers – mean of $1.24 and low/high of $1.19 – $1.31. Using the mean, the forward adjusted diluted PE is ~41.3.
- FY2027 – 8 brokers – mean of $1.39 and low/high of $1.30 – $1.46. Using the mean, the forward adjusted diluted PE is ~36.8.
Minor revisions to these estimates could occur over the next several days given the February 12 earnings release.
ROL consistently generates FCF exceeding EPS and the outlook is for this to continue. Using modified FCF calculations where we deduct SBC, I estimate that the FCF conversion ratio will be at least 1.11. The variance between diluted EPS and adjusted diluted EPS is historically slim. I, therefore, estimate FY2025’s FCF/share as being ~$1.23 ($1.11 x 1.11).
If we divide $51.20 by $1.23, the forward P/FCF is ~41.6. This level is relatively similar to the levels calculated in prior posts.
I continue to think a fair value is closer to the low $40s. At ~$42, the P/FCF ($42/$1.23) is ~32.5.
As I compose this post on June 27, 2025, the following are ROL’s current forward adjusted diluted PE levels using the current adjusted diluted EPS broker estimates and the current ~$55.81 share price:
- FY2025 – 12 brokers – mean of $1.11 and low/high of $1.06 – $1.14. Using the mean, the forward adjusted diluted PE is ~50.3.
- FY2026 – 12 brokers – mean of $1.25 and low/high of $1.16 – $1.30. Using the mean, the forward adjusted diluted PE is ~44.6.
- FY2027 – 9 brokers – mean of $1.39 and low/high of $1.27 – $1.47. Using the mean, the forward adjusted diluted PE is ~40.2.
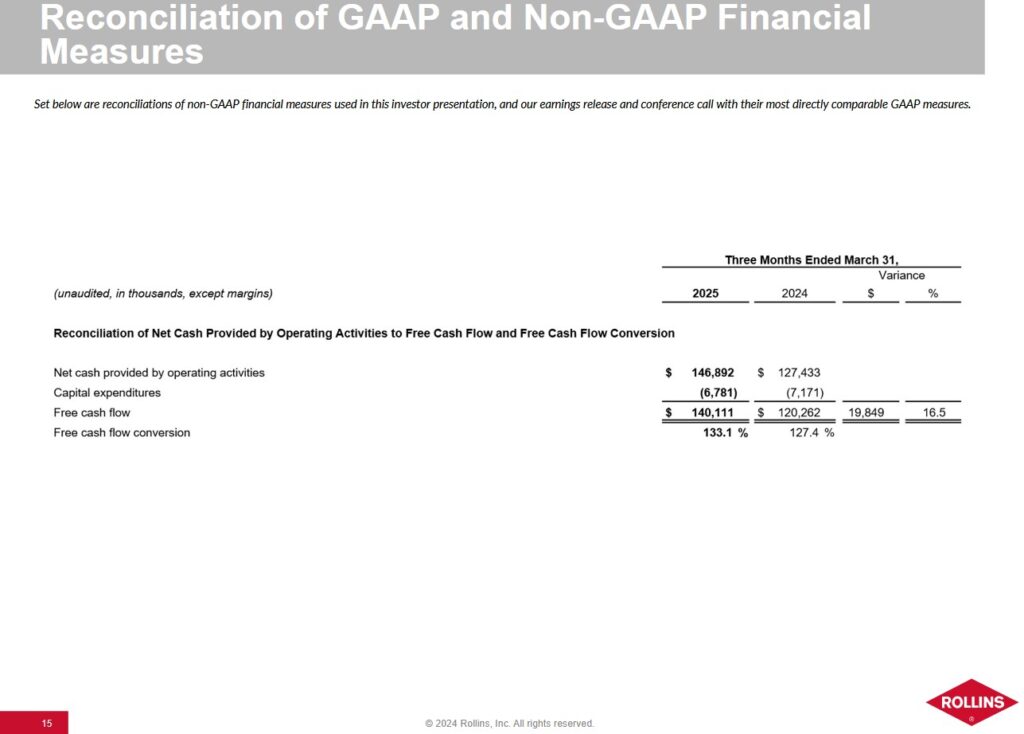
My comments regarding ROL’s FCF consistently exceeding EPS remain the same. ROL reported a FCF conversion ratio of 133.1% in Q1 2025 (FCF of $140.111 million versus $105.248 million of net income). If we deduct SBC of $8.799 million, ROL’s Q1 FCF drops to $131.312. This is a ~124.76% FCF conversion ratio.
I previously estimated ROL’s FY2025 FCF conversion ratio may be ~111% when using the modified FCF calculation method. If the remaining 3 quarters in FY2025 are comparable to Q1, it is conceivable that the FCF conversion ratio could be closer to 120%. If this materializes, ROL’s FY2025 FCF/share could be ~$1.33 ($1.11 x 1.20) versus my previous ~$1.23 estimate.
Divide the current ~$55.81 share price by $1.33 and the forward P/FCF is ~42. This level is somewhat greater than my prior estimate. I think a fair value is closer to the low $40s. At ~$43, for example, the P/FCF ($43/$1.33) is ~32.3.
Final Thoughts
My final thoughts are the same as in my prior post.
It is preferable that we look at ROL from a FCF perspective versus an earnings perspective because of the significant annual depreciation and amortization. Furthermore, we need to consider that:
- ROL is a leader in the highly fragmented pest control industry; and
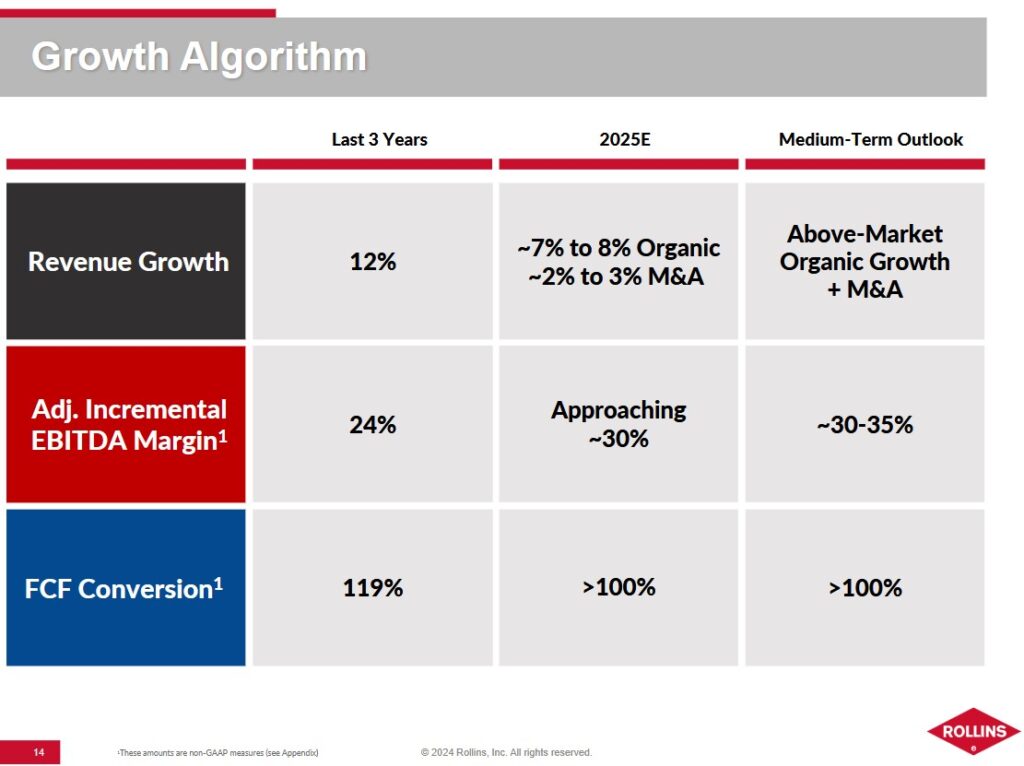
- management plans to double the company’s revenue over the coming decade.
If it continues to generate an Operating Margin in the mid to upper teens as it has over the past several years, investors should be aptly rewarded.
The following are some additional considerations.
- The pest control business is relatively steady;
- ROL focuses heavily on efficiency and cost control;
- The FCF conversion ratio is consistently above 100%;
- Management quality has improved considerably;
- The level of financial reporting continues to improve;
- Investment-grade corporate credit ratings now provide ROL with an important access point to the capital markets; and
- 75+% of business is recurring.
As noted at the outset of this post, pest control is ‘not sexy’. If you have a pest issue, however, you want a solution to your problem…quickly!
Climate change favors growth in the pest control industry but without the efficient use of technology and route density, business can be challenging. It is essential to maximize the productive use of a technician’s time; traveling long distances between service calls is inefficient. Many smaller industry participants, however, do not have the resources to fund the implementation of the technology ROL uses.
In such a highly fragmented business, ROL has a long list of acquisition opportunities. Acquiring competitors such as the Saela acquisition in Q1 can quickly be accretive to ROL’s results.
ROL was not a top 30 holding when I completed my 2024 Year End FFJ Portfolio Review and it is unlikely to ever become a top 30 holding. Unless ROL’s valuation significantly improves, I intend to merely increase my exposure through the automatic reinvestment of dividend income.
I wish you much success on your journey to financial freedom!
Note: Please send any feedback, corrections, or questions to finfreejourney@gmail.com.
Disclosure: I am long ROL.
Disclaimer: I do not know your circumstances and do not provide individualized advice or recommendations. I encourage you to make investment decisions by conducting your research and due diligence. Consult your financial advisor about your specific situation.
I wrote this article myself and it expresses my own opinions. I do not receive compensation for it and have no business relationship with any company mentioned in this article.