When I last reviewed Mastercard (MA) in this February 20, 2024 post, I concluded that shares were overvalued.
On July 25, I disclosed the purchase of 300 V shares in my I Have Increased My Visa Exposure post. On the same day, I increased my MA exposure with the purchase of 300 shares @ ~$432.05; I disclosed this purchase in the Final Thoughts of my July 27 No Change In West Pharmaceutical’s Long Term Outlook post and in my FFJ Portfolio – July 2024 post.
We now have MA’s Q2 and YTD2024 results and updated FY2024 outlook that were released on July 31. Unfortunately, MA’s share price has surged to ~$462 (August 1 closing share price). I, therefore, revisit MA’s valuation to determine if it remains a compelling purchase at this higher price.
Business Overview
Most investors are familiar with MA to some extent. I, therefore, dispense with a business overview. I do, however, encourage a review of ‘Item 1. Business’ and ‘Item 1A. Risk Factors’ found at the beginning of MA’s FY2023 Form 10-K.
Financials
Q2 and YTD2024 Results
Refer to MA’s Earnings Release, Earnings Presentation, and Supplemental Materials that are accessible from the company’s website.
Operating Cash Flow (OCF), CAPEX, and Free Cash Flow (FCF)
In the FY2014 – FY2023 time frame, MA’s:
- OCF was (in B$) 3.41, 4.10, 4.64, 5.66, 6.22, 8.18, 7.22, 9.46, 11.20, and 11.98.
- CAPEX was (in B$) 0.33, 0.34, 0.38, 0.42, 0.50, 0.73, 0.71, 0.81, 1.10, and 1.09.
- FCF was (in B$) 4.24, 4.52, 4.97, 5.42, 7.03, 9.15, 7.67, 9.57, 11.00, and 12.84.
YTD2024 net cash provided by operating activities is ~$4.81BB, YTD CAPEX (Purchases of property and equipment and Capitalized software) is ~$0.674B, and YTD FCF is ~$4.136B.
Return On Invested Capital (ROIC)
High quality companies often generate a high ROIC. If a company generates a high ROIC, it needs to invest less to achieve a certain growth rate thus reducing the need for external capital.
A company that generates $0.15/profit for every $1 invested, for example, achieves a ROIC of 15%. I consider a ~15%+ ROIC to be a reasonable minimum threshold because most of the time, a company’s cost of capital will be lower than this level.
MA’s FY2014 – FY2023 ROIC (%) was 42.09, 43.81, 40.96, 36.89, 51.99, 64.76, 39.41, 44.94, 49.74, and 54.35.
When a company consistently generates a high ROIC over the long term and it is growing its revenue, it can reinvest a portion of its profits under favorable conditions thereby leading to a compounding effect. I would much rather invest in a growing company that can reinvest to create greater shareholder value than to invest in a company that has limited growth opportunities and thus chooses to distribute a growing dividend.
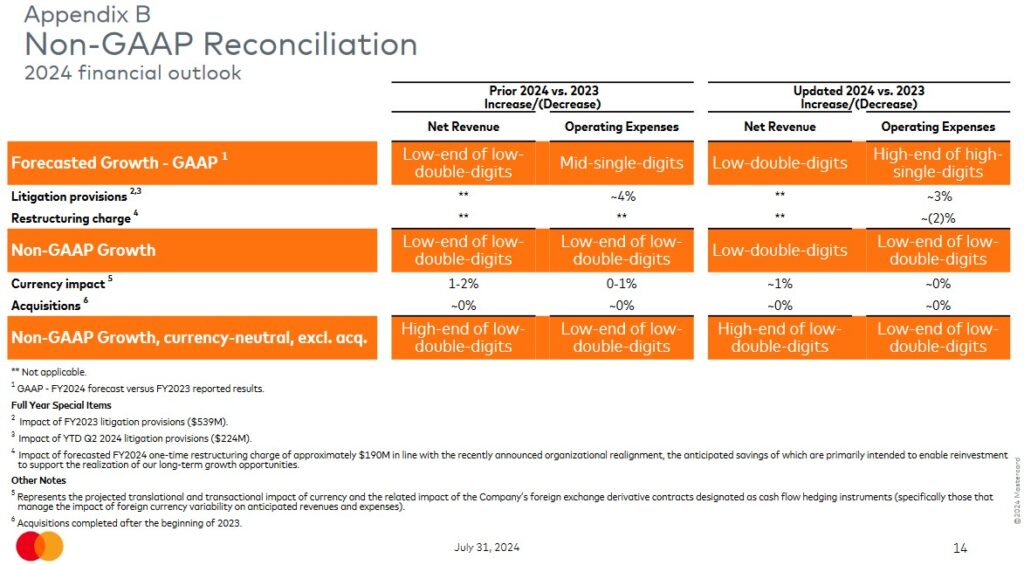
FY2024 Outlook
MA’s base case scenario for 2024 reflects healthy consumer spending. It is, however, closely monitoring the macro environment as well as geopolitical events.
Risk Assessment
The following debt schedule is found on page 19 of 52 in MA’s Q2 Form 10-Q.
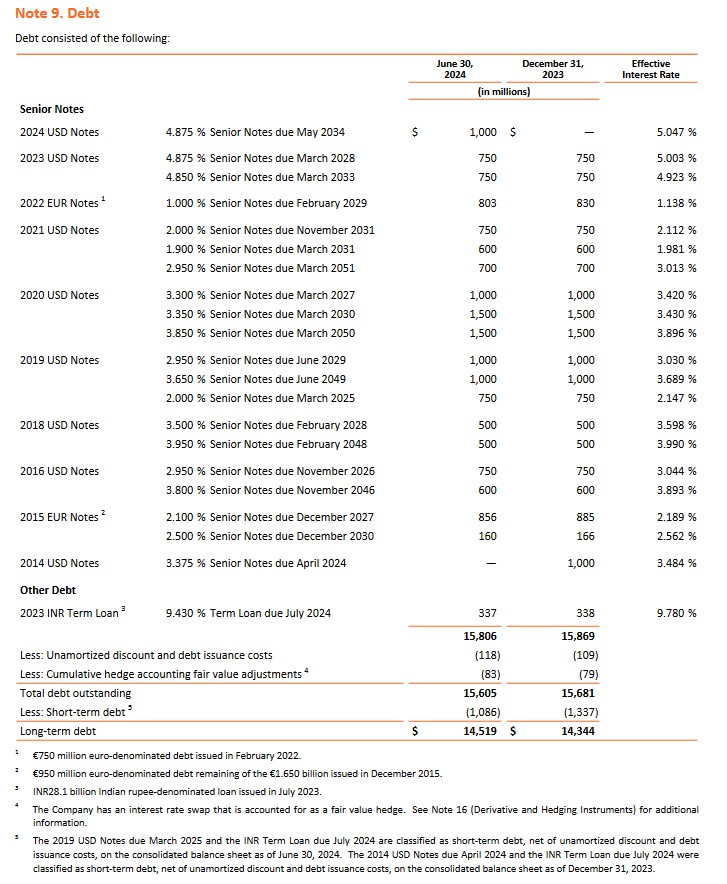
The $0.75B 2019 USD Notes due March 2025 will likely be repaid at maturity.
MA, however, is likely to enter into a new Indian Rupee Term Loan (INR) to replace that maturing in July 2024. MA obtained the INR Term Loan to serve as economic hedges to offset possible changes in the value of INR-denominated monetary assets due to foreign exchange fluctuations. The INR Term Loan is not subject to any financial covenants and may be repaid in whole at MA’s option at any time for a specified make-whole amount.
Moody’s currently assigns an Aa3 rating to MA’s senior unsecured long-term domestic debt; this rating was upgraded on November 16, 2022 from A1.
This rating is the lowest tier of the high-grade investment grade category. It defines MA as having a very strong capacity to meet its financial commitments; the rating differs from the highest-rated obligors only to a small degree.
S&P Global currently assigns an A+ rating to MA’s senior unsecured long-term domestic debt; this rating has been in effect since November 2018 and is one level below that assigned by Moody’s.
This rating is the highest tier of the upper-medium-grade investment grade category. It defines MA as having a strong capacity to meet its financial commitments. However, MA is somewhat more susceptible to the adverse effects of changes in circumstances and economic conditions than obligors in higher-rated categories.
MA’s credit risk suits my conservative investor profile.
Dividends and Share Repurchases
Dividend and Dividend Yield
MA distributes a quarterly dividend as evidenced by the dividend history. MA’s annual dividend yield has historically been under 1% and is likely to remain under 1% going forward.
The bulk of MA’s historical total investment return has been generated from capital appreciation. This is unlikely to change, and therefore, it is exceedingly important to acquire shares when they are reasonably/attractively valued.
Share Repurchases
The weighted average number of Class A diluted common stock outstanding in FY2013 – FY2023 (in millions of shares) is 1,215, 1,169, 1,137, 1,101, 1,072, 1,047, 1,022, 1,006, 992, 971, and 946.
In Q2, MA repurchased $2.6B worth of stock and the weighted average number of shares outstanding in Q2 2024 was 930. Between June 30 – July 26, it repurchased an additional $0.820B.
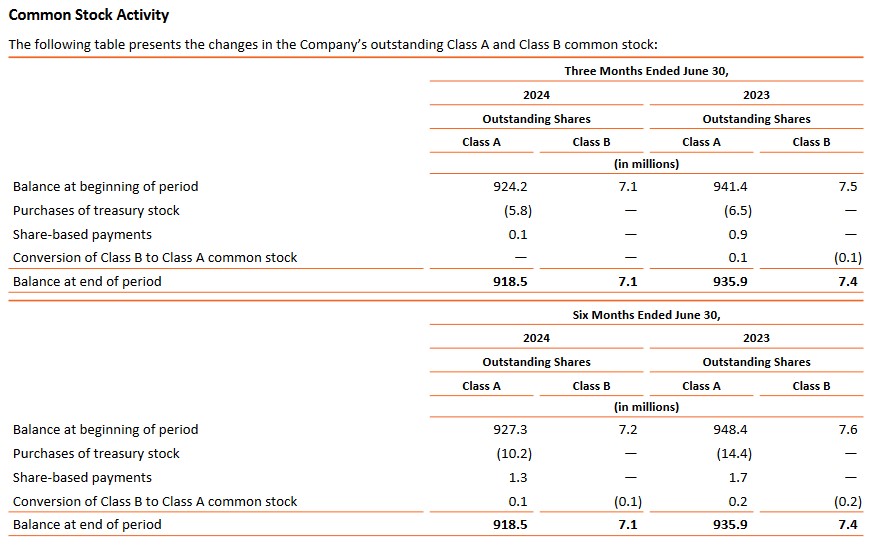
The following, extracted from MA’s Q2 2024 Form 10-Q, reflects the Q2 and YTD2024 share repurchase activity.
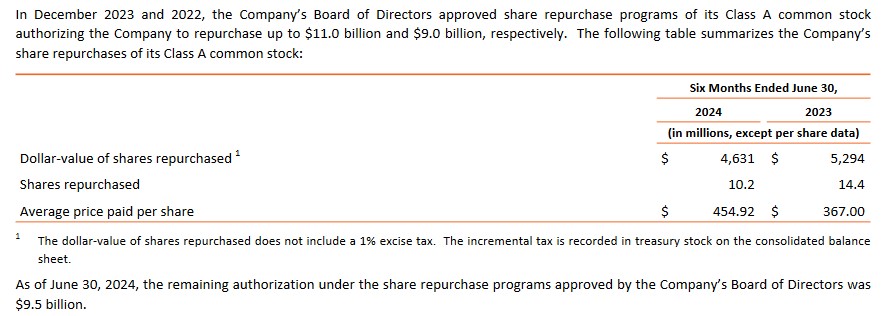
The following, provided for comparison, summarizes MA’s share repurchase authorizations of its Class A common stock for the years ended December 31.

Source: MA – FY2023 Form 10-K
Valuation
MA’s FY2013 – FY2023 diluted P/E ratio is 32.98, 29.61, 29.87, 28.52, 35.28, 38.11, 44.30, 53.59, 44.20, 34.74, and 37.18.
MA’s diluted EPS and adjusted diluted EPS in FY2013 – FY2023 are: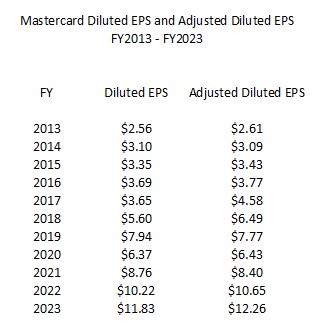
On July 25, I acquired shares @ ~$432.05. Using this purchase price and brokers’ adjusted diluted earnings estimates, the forward adjusted diluted PE levels are:
- FY2024 – 36 brokers – mean of $14.30 and low/high of $13.98 – $14.65. Using the mean estimate, the forward adjusted diluted PE is ~30.2.
- FY2025 – 36 brokers – mean of $16.62 and low/high of $15.94 – $17.23. Using the mean estimate, the forward adjusted diluted PE is ~26.
- FY2026 – 21 brokers – mean of $19.34 and low/high of $18.54 – $20.31. Using the mean estimate, the forward adjusted diluted PE is ~22.3.
As I compose this post on August 1, however, the share price is ~$462. Using this price and brokers’ adjusted diluted earnings estimates, the forward adjusted diluted PE levels are:
- FY2024 – 36 brokers – mean of $14.30 and low/high of $13.98 – $14.65. Using the mean estimate, the forward adjusted diluted PE is ~32.3.
- FY2025 – 36 brokers – mean of $16.62 and low/high of $15.94 – $17.23. Using the mean estimate, the forward adjusted diluted PE is ~27.8.
- FY2026 – 21 brokers – mean of $19.34 and low/high of $18.54 – $20.31. Using the mean estimate, the forward adjusted diluted PE is ~23.9.
In the first half of FY2024, MA generated FCF of ~$4.136B. If it generates $9B for the year and we use a weighted average number of shares outstanding of 930 million for FY2024, we arrive at ~$9.68 of FCF/share. Using my ~$432.05 purchase price, the forward adjusted P/FCF is ~44.6. If we use the current ~$462 share price, the forward adjusted P/FCF is ~47.7.
If MA has a strong second half of FY2024 thus enabling it to attain ~$11B of FCF for FY2024, we get ~$11.42 FCF/share. The P/FCF thus becomes ~37.8 using my ~$432.05 purchase price and ~40.5 using the current ~$462 share price.
Final Thoughts
The Final Thoughts regarding the swipe fee litigation reflected in my July 25 V post applies to MA.
I don’t care whether MA is a better long-term investment than V or vice versa. I just choose to own both.
MA was my 2nd largest holding (a distant 2nd after V) when I completed my 2023 Year End FFJ Portfolio Review. Because of changes to the tax treatment of capital gains in Canada, our tax advisors recommended the liquidation of all shares in a specific account prior to June 26; MA is one of the companies in which I had to liquidate shares. This led to MA being my 5th largest holding when I completed my 2024 Mid Year FFJ Portfolio Review.
Following the acquisition of 300 MA shares on July 25, however, it is now my 2nd or 3rd largest holding.
I currently hold 664 shares in ‘Core’ accounts and 300 shares in a ‘Side’ account in the FFJ Portfolio. A young investor I am helping on their journey to financial freedom also owns MA shares. I do not, however, disclose details regarding this investor’s holdings.
The time to acquire shares in great companies is when its share price weakens. MA’s share price, unfortunately, has surged following my July 25 purchase.
Given MA’s share price volatility, a retracement to ~$432 or lower should not be ruled out. I am not, therefore, immediately adding to my exposure.
I wish you much success on your journey to financial freedom!
Note: Please send any feedback, corrections, or questions to finfreejourney@gmail.com.
Disclosure: I am long MA and V.
Disclaimer: I do not know your circumstances and do not provide individualized advice or recommendations. I encourage you to make investment decisions by conducting your research and due diligence. Consult your financial advisor about your specific situation.
I wrote this article myself and it expresses my own opinions. I do not receive compensation for it and have no business relationship with any company mentioned in this article.