![]()
I initiated a Zoom Communications (ZM) position on August 22, 2023 with the purchase of 400 shares @ $64.58 in a ‘Core’ account in the the FFJ Portfolio. Another 600 shares were acquired at later dates bringing my current exposure to 1000 shares at an average cost of ~$64.38.
I last reviewed ZM in this November 25, 2025 post at which time the company had released its Q3 and YTD2026 results. I revisit this existing holding now that ZM’s Q4 and FY2026 results are available.
Business Overview
ZM has Class A (publicly traded shares) and Class B shares. The Class A and B shares have 1 and 10 votes per share, respectively. There is ~5.5x more Class A shares outstanding than Class B shares.
The Class B shareholders have significant influence over the management and all matters requiring stockholder approval, including the election of directors and significant corporate transactions, such as a merger or other sale of ZM or its assets. Within the Risk Factors section of ZM’s Form 10-Q and Form 10-K, there is commentary regarding this dual-class structure.
Part 1, Item 1 in ZM’s FY2024 Form 10-K (see SEC Filings) provides a comprehensive overview of the business, competition, and risks.
On September 17 and 18, ZM held Zoomtopia 2025, its annual flagship event. This event showcased innovations, particularly in the area of AI features and collaboration tools. ZM’s presentation and webcast of this event is accessible here.
‘Land and Expand’ Strategy
This strategy is a core business model designed to minimize the friction of acquiring a new customer and maximizing the lifetime value through a multi-stage growth process. Using this strategy ZM has been able to expand from a simple video tool into a comprehensive ‘AI-powered system of action’.
The goal in the ‘Land’ phase of this strategy is to get a ‘foot in the door’ by acquiring a customer with a low-risk, high-value entry point.
ZM primarily lands through its ‘Freemium’ model whereby individual employees or small teams often start using the free version for meetings, creating a grassroots adoption within an organization. By eliminating a complex account creation for participants, ZM bypasses traditional IT procurement hurdles.
When targeting larger enterprises, the ‘land’ phase may consist of a small contract for a single department rather than a company-wide rollout. Once ZM has ‘landed’ by establishing itself as a trusted vendor, it will move to deepen the relationship by:
Upselling
As one department finds success with ZM, usage (seat growth) naturally spreads to other departments.
In other instances, ZM customers may move from ‘Pro’ to ‘Enterprise’ tiers as they reach meeting duration limits or require advanced security and administrative features.
Cross-selling
In recent years, ZM has aggressively expanded its product suite to move beyond video calls.
Products
Key expansion products include:
Zoom Phone
This is a cloud-based VoIP phone system that has become one of ZM’s fastest-growing segments. As of February 2026, ZM surpassed 10 million paid seats on this platform. This milestone was officially reached in October 2025, marking a rapid ascent for a product that was only launched in 2019. The growth of Zoom Phone is a key part of the company’s expansion strategy, as it represents the successful conversion of meeting-only users into full-stack communication customers.
Zoom Contact Center (CCaaS)
This is an AI-first solution for customer service teams. It has recently gained ‘Leader’ status in industry assessments like IDC MarketScape.
As of late February 2026, ZM has surpassed 1,100 customers on its Zoom Contact Center (CCaaS) platform.
This figure was officially highlighted during ZM’s Q4 and FY2026 earnings report. The growth in this segment is a major success story for the company’s ‘Land and Expand’ strategy, as the platform effectively doubled its customer base YoY. CCaaS has become ZM’s fastest-growing ‘expansion’ product after Zoom Phone.
Zoom AI Companion
This offering uses AI features (meeting summaries, chat compose) to make the platform ‘sticky’ and indispensable for daily workflows.
As of the Q4 and FY2026 earnings report, ZM confirmed that adoption surged more than 4x over the last fiscal year. In the final quarter of FY2026, AI Companion Monthly Active Users (MAU) more than tripled YoY, driven by the launch of AI Companion 3.0 (which introduced agentic capabilities like cross-app task execution).
100% of Zoom’s top 10 enterprise deals in Q4 2026 included specific AI implementation strategies.
ZM also reported a 35% sequential increase in Zoom Phone users engaging with AI features (like real-time call summaries and sentiment analysis).
ZM essentially uses AI Companion as a ‘defensive moat’ to keep customers from switching to competitors like Microsoft Teams. The success of this strategy is demonstrated by record low churn with ZM’s ‘Online’ (small business/individual) churn rate hitting a historic low of 2.7% in 2026. Management directly attributes this to the high perceived value of the AI Companion.
The base AI Companion remains free. ZM, however, is successfully moving customers toward the Custom AI Companion (launched in late 2025/early 2026). This is a paid add-on ($12/user/month) for companies that require specialized, industry-specific AI models.
Workvivo
In Q1 FY2024, ZM closed the acquisition of this Ireland-based company.
As of early 2026, Workvivo has become a cornerstone of ZM’s ‘Land and Expand’ strategy, serving as its primary Employee Experience platform.
Workvivo is an internal communication and engagement platform designed to replace outdated corporate intranets. It functions like a ‘private social network’ for a company, featuring:
- Activity Feeds: A social-style feed for company news, shout-outs, and updates.
- Employee Recognition: Tools for peer-to-peer recognition and celebrating milestones.
- Community Spaces: Digital hubs for interest-based groups or specific departments.
- Mobile-First Design: Specifically built to reach frontline workers such as those in retail or manufacturing who do not spend their day at a desk or in ZM meetings.
According to ZM’s Q4 FY2026 financial reports, Workvivo has ~ 1,225+ customers. This represents roughly 70% – 80% YoY growth, accelerating significantly as Meta (Facebook) began sunsetting its ‘Workplace from Meta’ platform and recommending Workvivo as its preferred migration partner.
The platform is increasingly winning mega-deals. In late 2025, ZM reported signing three Workvivo deals worth over $1 million in Annual Recurring Revenue (ARR) each with major global brands. In addition, the number of Workvivo customers contributing more than $100,000 in ARR rose by over 140% in the last year.
Financials
Q4 and FY2026 Results
ZM’s Q4 2026 earnings material (including the transcript of management’s commentary on the earnings call) is accessible here.
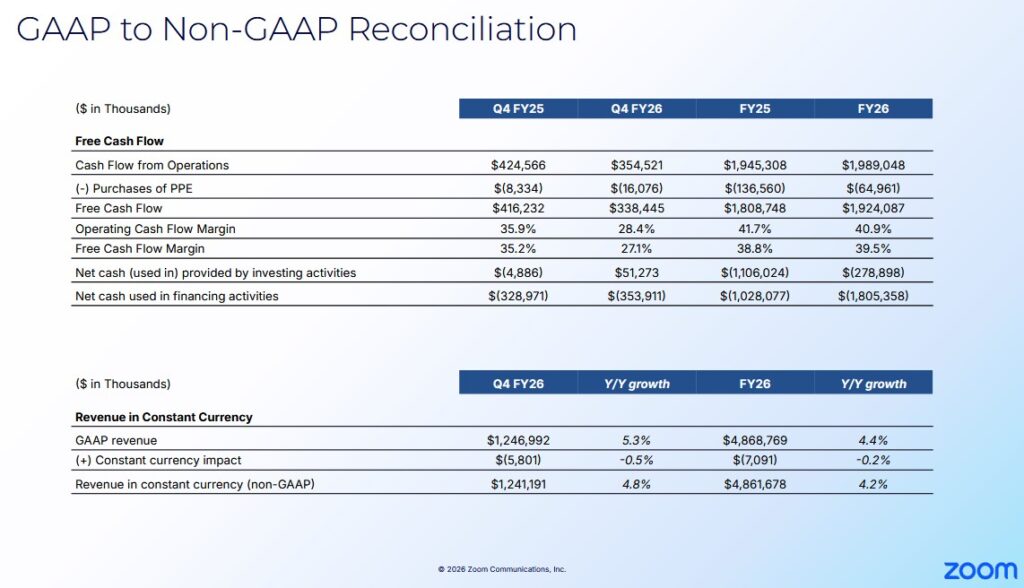
The Q4 and FY2025 and Q4 and FY2026 GAAP to Non-GAAP reconciliation is accessible through the Q4 2026 earnings presentation.
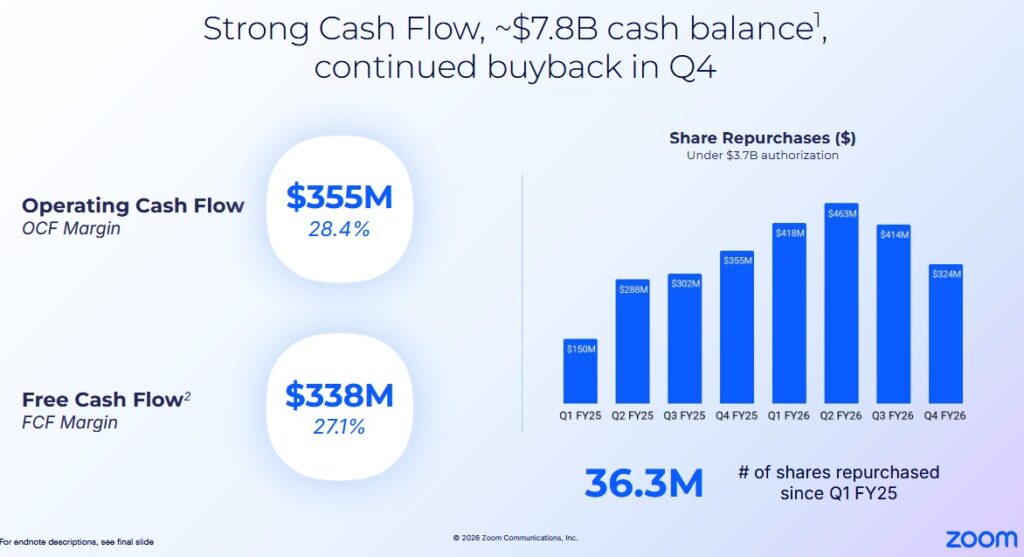
ZM’s cash and cash equivalents and marketable securities at FYE2026 was ~$7.817B versus ~$7.79B at FYE2025 and ~$7B at FYE2024. This is impressive considering ZM repurchased ~$2.715B of its shares in FY2025 and FY2026.
A concern I had when I initiated a position in 2023 was the extent of ZM’s monthly churn. Monthly churn, however, has gradually improved and ZM’s online business continues to show signs of stabilizing.
- Q3 – Q4 2022 was 3.7% and 3.8%;
- Q1 – Q4 2023 was 3.6%, 3.6%, 3.1%, and 3.0%;
- Q1 – Q4 2025 was 3.2%, 2.9%, 2.7%, and 2.8%; and
- Q1 – Q4 2026 was 2.8%, 2.9%, 2.7%, and 2.9%.
NOTE: ZM reported a ~$0.97B Net Gain on Strategic Investments in FY2026. This number looks great on a GAAP basis but warrants caution. This gain is primarily driven by unrealized gains on ZM’s portfolio of minority investments in other technology companies.
ZM has a venture arm that invests in AI, collaboration, and enterprise software startups. Under modern accounting standards, companies must report changes in the market value of their equity investments in their quarterly earnings, even if they have not sold their investment. In a bullish market, the fair value of these private or newly public holdings is adjusted upward. In a bearish market, the value of the equity investments must be revised lower.
Investors need to be cautious because this ‘gain’ is ‘Non-Operational’ and ‘Non-Cash’. This can mask the true health of the core business.
This gain is ‘paper wealth’. If the tech sector or AI valuations pull back, this ‘gain’ can instantly turn into a ‘Net Loss on Strategic Investments’ thus creating massive volatility in GAAP earnings.
Conventional And Modified Free Cash Flow (FCF) Calculations (FY2019 – FY2025)
The following compares ZM’s FCF using the ‘conventional’ and ‘modified’ calculation methods.
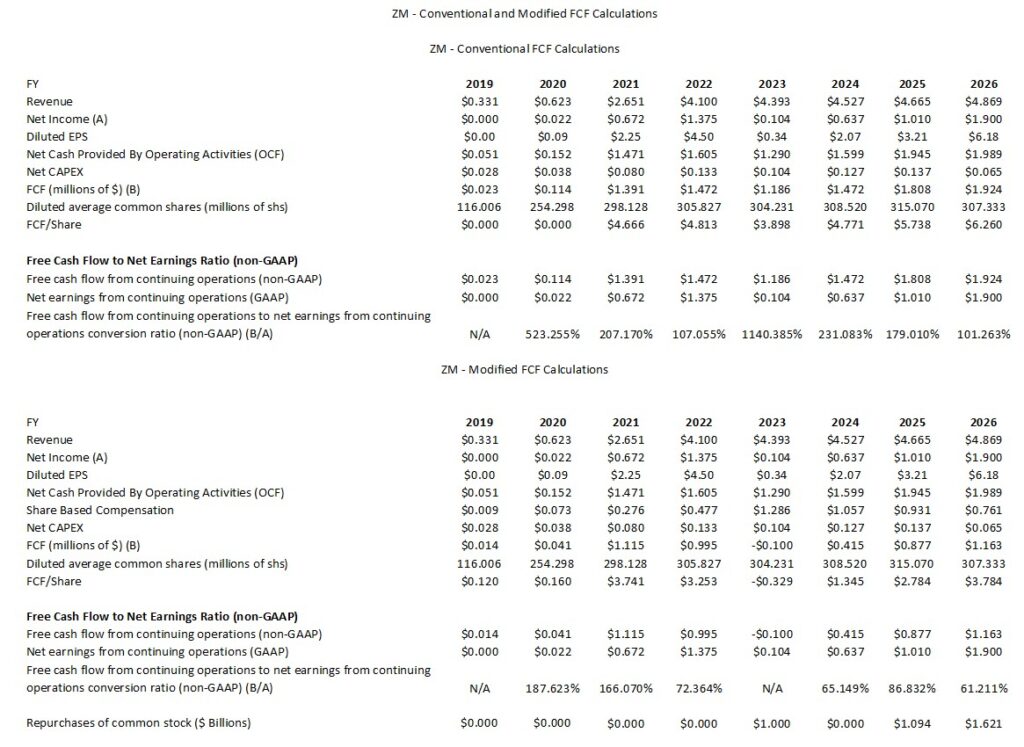
The following reflects the manner in which ZM calculates FCF for Q4 and FY2025 and Q4 and FY2026. ZM does not deduct share based compensation. Its figures, therefore, only agree with my FCF calculations under the ‘conventional’ method.
Capital Allocation
The capital allocation priority is to reinvest in the company. This can include acquisitions. The opportunistic repurchase of Class A shares comes next.
ROIC and WACC
Return on Invested Capital (ROIC) provides an indication of a company’s efficiency. In essence, is a company actually creating value or ‘burning’ cash for the sake of growth?
A company with a higher ROIC is mathematically worth more because it requires less reinvestment to achieve that growth.
A good indication of how well a company is performing is to compare ROIC to the Weighted Average Cost of Capital (WACC). WACC, however, is not a metric officially reported by ZM but it can be roughly estimated based on the company’s credit profile and market conditions.
The generally accepted high-level formula used by Wall Street is:
ROIC = NOPAT/Average Invested Capital
with the Net Operating Profit After Tax (NOPAT) formula being Operating Income (EBIT) x (1-tax rate)
This shows how much profit the core business makes while ignoring how much debt the company has.
The Average Invested Capital is the total money tied up in the business.
- The Operating Approach formula is
- The Financing Approach is
One shortcoming with ROIC is that it is a non-GAAP metric meaning the input data plugged into the ROIC formula is inconsistent.
When analyzing ZM’s ROIC, we need to look at both its hyper-growth pandemic years and its current transition into an AI-first enterprise platform.
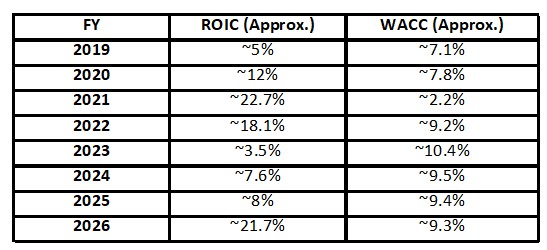
ZM’s massive cash hoard can create a misleading picture of the company’s actual operational efficiency. This is because in many automated financial models, ‘Invested Capital’ is calculated by simply looking at Total Assets minus Non-Interest Bearing Current Liabilities. ZM, however, had ~$7.817B in cash and cash equivalents and marketable securities on its balance sheet at FYE2026 so the denominator in the ROIC equation becomes artificially large.
If we include ~$7.817B in the capital base, we are measuring the return on money that is essentially sitting in relatively safe treasury bills or money market funds earning a low rate of return rather than the return on money actually being put to work in the business which generate much higher returns.
To measure ZM’s true efficiency, we can look at Adjusted ROIC where we strip away the idle cash and focus only on the capital used for operations. When we do this, the Operational ROIC often exceeds 30% – 40%.
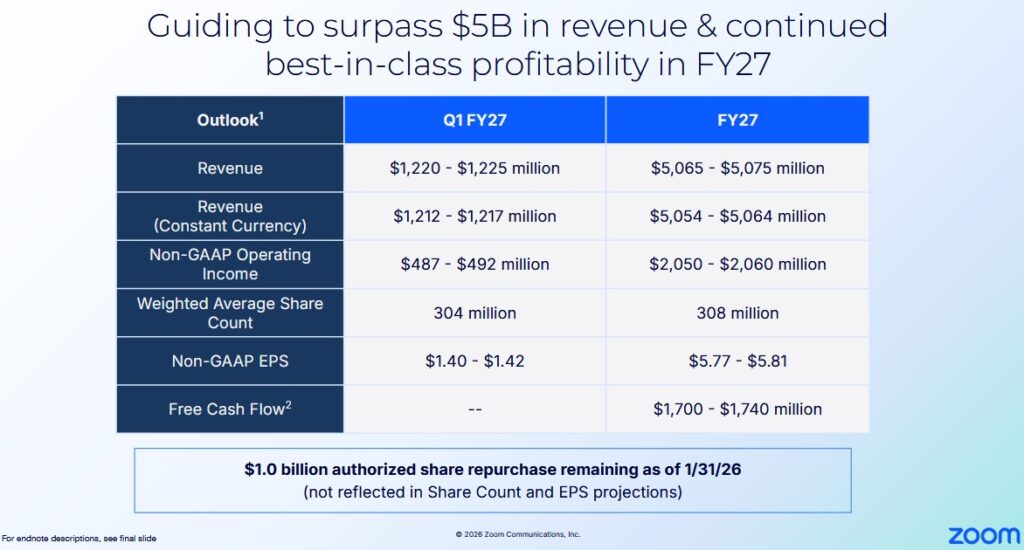
Q1 and FY2027 Outlook
The following reflects ZM’s Q1 and FY2027 outlook.
Risk Assessment
ZM has no debt to rate.
Dividends and Share Repurchases
Dividend and Dividend Yield
Management specifically states the following in its Form 10-Q and Form 10-K:
We do not intend to pay dividends for the foreseeable future.
We have never declared nor paid cash dividends on our capital stock. We currently intend to retain any future earnings to finance the operation and expansion of our business, and we do not expect to declare or pay any dividends in the foreseeable future. As a result, stockholders must rely on sales of their Class A common stock after price appreciation as the only way to realize any future returns on their investment.
Share Repurchases
One of my concerns when I initiated a ZM position on August 22, 2023 was the magnitude of its annual SBC.
A core part of ZM’s strategy to improve profitability and appease investors who were concerned about share dilution, however, has been better control of SBC. While SBC is still a component of ZM’s compensation structure, it has been dramatically scaled back.
After the hiring spree of the pandemic years, where SBC reached high levels to attract talent, the company has stabilized its headcount. This has allowed it to let previous, high-value equity grants vest without replacing them with equally massive new grants at the same scale.
Looking at ZM’s financial statements for the past several quarters, we see a shift toward variable pay and cash incentives. Since ZM generates significant FCF it can offer competitive cash bonuses that do not dilute existing shareholders.
In addition to scaling back SBC, ZM’s board has significantly increased the company’s repurchase authorizations. In FY2026, for example, ZM deployed ~$1.621B toward the repurchase of ~20.4 million shares. Furthermore, ZM’s Board authorized an additional $1.0B share repurchase authorization in November 2025.
Information about ZM’s Stockholders’ Equity and Equity Incentive Plans is found in each Form 10-Q and Form 10-K.
Valuation
ZM looks incredibly inexpensive if we rely on the PE ratio based on GAAP numbers because the earnings are artificially inflated by a ~$0.97B one-time net gain on strategic investments.
To address the artificial inflation of earnings we can strip out these gains to see what the actual software business is earning.
GAAP net income for FY2026 was ~$1.9B or $6.18/share.
Non-GAAP net income amounting to $1.820B for FY2026 or $5.92/share, however, adjusts for:
- stock-based compensation expense and related payroll taxes;
- expenses related to charitable donation of common stock;
- net impairment of assets;
- litigation settlements;
- net gains on strategic investments;
- acquisition-related expenses;
- income tax benefits from discrete activities; and
- the tax effects on non-GAAP adjustments.
As I compose this post on February 26, ZM’s share price is ~$74. Management’s FY2026 adjusted diluted EPS guidance is $5.77 – $5.81 for a forward adjusted diluted PE of ~12.74 – ~12.82.
Using this current share price and the currently available adjusted diluted EPS broker estimates, ZM’s forward adjusted diluted PE levels are:
- FY2027 – 29 brokers – ~ 12.4 using a mean of $5.97 and low/high of $5.77 – $6.64.
- FY2028 – 24 brokers – ~ 12 using a mean of $6.17 and low/high of $5.10 – $7.13.
- FY2029 – 7 brokers – ~ 11.6 using a mean of $6.38 and low/high of $5.13 – $7.13.
The data reflected above will change over the next several days as the brokers update their estimates. I place very little reliance on broker estimates, however, as much can happen to make these estimates irrelevant. Furthermore, the disparity in estimates implies that the brokers which cover ZM have very different outlooks.
Management’s FY2027 FCF outlook is $1.7B – $1.74B but this does not include any deduction for SBC. ZM is scaling back its SBC but to be conservative I leave the FY2027 SBC at the FY2026 level of ~$0.761B. I am also increasing CAPEX to ~$0.1B from ~$0.065B in FY2026. Deducting this SBC and CAPEX level from ZM’s FY2027 FCF outlook, we get a modified FCF range of ~$0.839B – ~$0.879B.
If the weighted average share count is 308 million, the FY2027 FCF/share range is ~$2.72 – ~$2.85. Divide ~$74 by this range and we get a P/FCF range of ~26 – ~27.2.
In my prior post I reflect the following:
The November 24, 2025 closing share price was $78.60 and management’s current FY2026 adjusted diluted EPS outlook is $5.95 – $5.97. Using this share price and the ~$5.96 mid point of management’s outlook, the forward adjusted diluted PE is ~13.2.
Using this current share price and the currently available adjusted diluted EPS broker estimates, ZM’s forward adjusted diluted PE levels are:
- FY2026 – 27 brokers – ~ 13.1 using a mean of $5.99 and low/high of $5.81 – $8.46.
- FY2027 – 28 brokers – ~ 13.1 using a mean of $5.99 and low/high of $5.40 – $6.87.
- FY2028 – 15 brokers – ~ 12.5 using a mean of $6.28 and low/high of $5.10 – $7.17.
The data reflected above will change over the next several days as the brokers update their estimates. I place very little reliance on broker estimates, however, as much can happen to make these estimates irrelevant. Furthermore, the disparity in estimates implies that the brokers which cover ZM have very different outlooks.
Conventional FCF Calculation
Management’s FY2026 FCF guidance is $1.86B – $1.88B and the diluted weighted average shares outstanding forecast is 308 million (the outlook at the beginning of the year was 318 million). This gives us a FCF/share estimate of ~$6.04 – ~$6.10. Based on a $78.60 share price, the forward P/FCF is ~12.9 – ~13.
The diluted weighted average shares outstanding for the first 3 quarters of FY2026 is 308.7 million. The weighted average in Q3, however, is ~305 million. ZM continues to allocate money toward share purchases and the FY2026 diluted weighted average outstanding shares could end up being ~305 million. Divide the $1.87B mid point of management’s FY2026 FCF guidance by 305 million shares and the FCF/share estimate is ~$6.13. Based on a $78.60 share price, the forward P/FCF is ~12.8.
Modified FCF Calculation
YTD2026 SBC is ~$0.576B. If we increase this value by 33.33%, the FY2026 SBC estimate is ~$0.768B. Deduct this value from the ~$1.87B mid point of ZM’s FY2026 FCF outlook and we get a FY2026 FCF estimate of ~$1.102B. Dividing this by 305 million shares results in FY2026 FCF/share of ~$3.61. Using the current $78.60 share price, we get a P/FCF of ~21.8.
The following is my assessment of ZM’s valuation at the time of my August 22, 2025 post.
Management’s current FY2026 adjusted diluted EPS outlook is $5.81 – $5.84. The August 21, 2025 closing share price was $73.17. Using this share price and the ~$5.825 mid point of management’s outlook, the forward adjusted diluted PE is ~12.56.
Using this current share price and the currently available adjusted diluted EPS broker estimates, ZM’s forward adjusted diluted PE levels are:
- FY2026 – 23 brokers – ~13 using a mean of $5.65 and low/high of $5.55 – $5.88.
- FY2027 – 29 brokers – ~ 12.7 using a mean of $5.78 and low/high of $5.17 – $6.77.
- FY2028 – 14 brokers – ~ 12.2 using a mean of $6.02 and low/high of $4.96 – $7.46.
I place little reliance on broker estimates and almost no reliance on any estimates beyond those for the current fiscal year. This is because much can happen beyond the current fiscal year that can make these estimates irrelevant. Furthermore, the disparity in estimates implies that the brokers which cover ZM have very different outlooks.
Conventional FCF Calculation
Management’s FY2026 FCF guidance is $1.74B – $1.78B and the diluted weighted average shares outstanding forecast is 308 million (the outlook at the beginning of the year was 318 million). This gives us a FCF/share estimate of ~$5.65 – ~$5.78. Based on a $73.17 share price, the forward P/FCF is ~12.7 – ~13.
ZM, however, still has $0.725B authorized share repurchase remaining at the end of Q2 2026. It is, therefore, entirely possible that the FY2026 diluted weighted average outstanding shares could end up being lower than 308 million!
Modified FCF Calculation
When we deduct YTD2026 SBC of ~$0.39B, we get $0.581B of YTD FCF.
If SBC in the second half of FY2026 is similar to the first half, FY2026 SBC should be ~$0.78B. Deduct this from management’s FY2026 FCF guidance of $1.74B – $1.78B and we get a modified FCF range of ~$0.96B – ~$1B. Divide this by 308 million shares and we get a FCF/share range of ~$2.53 – ~$3.25. Using the a $73.17 share price, we get a P/FCF range of ~22.51 – ~29.
These valuations are more favorable than at the time of my February 25, 2025 and May 27, 2025 posts.
Final Thoughts
When I completed my 2025 Mid-Year Portfolio Review and 2025 Year-End Investment Holdings Review, I held 1000 Zoom Communications (ZM) shares in a ‘Core’ account in the FFJ Portfolio. It has never been a top 30 holding.
Management has set a goal of $5B+ of annual revenue in FY2027. The combination of steady growth and a reduction in the weighted average diluted shares outstanding bodes well for a boost in the company’s stock price.
ZM is aggressively repurchasing shares while maintaining a ‘fortress balance sheet’ to fund its pivot into AI-driven collaboration and Contact Center services. It continues to maintain a capital structure that provides it with sufficient cash to acquire AI startups but not so much that it makes the company look stagnant and inefficient.
The probability of ZM’s share price returning to the ~$500 level it briefly reached in late 2020 is highly unlikely to occur for a very long time. A $100 share price by the end of FY2028, however, is realistic if the company can continue to steadily grow and shrink the share count.
ZM might not have a wide moat. It is, however, successfully acquiring new customers while simultaneously seeing increasing contributions from the up-market segment.
As mentioned in multiple previous posts, I want attractive valuations. For this to occur, share prices often need to come under pressure. If we overpay when acquiring shares the probability for terrible total investment returns increases.
In late January 2026, ZM’s share price was an unrealistic ~$97 – ~$98. Following the release of Q4 and FY2026 results, ZM’s share price is ~$74 making shares currently attractively valued.
I wish you much success on your journey to financial freedom!
Note: Please send any feedback, corrections, or questions to finfreejourney@gmail.com.
Disclosure: I am long ZM.
Disclaimer: I do not know your circumstances and do not provide individualized advice or recommendations. I encourage you to make investment decisions by conducting your research and due diligence. Consult your financial advisor about your specific situation.
I wrote this article myself and it expresses my own opinions. I do not receive compensation for it and have no business relationship with any company mentioned in this article.