In January 2025, on the advice of our tax accountants, we effected partial RRSP withdrawals as part of our RRSP meltdown strategy. I discuss the rationale for this strategy in prior posts.
Based on the year-to-date performance of our investments, our tax accountants have instructed us to make further RRSP withdrawals.
I like to acquire shares in great companies when I think their valuation is attractive. Conversely, I want to sell shares if I deem their valuation to be rich AND I need to sell.
This brings me to Walmart (WMT) in which I have been a shareholder for over 2 decades.
It was my 3rd largest holding at the time of my last 3 investment portfolio reviews; the most recent review was in mid-2025.
Despite being one of my largest holdings, I rarely pay any attention to this holding. My last 2 reviews were published on November 2, 2024 and August 16, 2024. In both those posts, I concluded that WMT was significantly overvalued. I continue to consider WMT to be overvalued hence my decision to sell some WMT shares held within Registered Retirement Savings Plan accounts (RRSP) @ ~$107/share.
NOTE: I do not disclose details of our RRSP holdings, and therefore, provide no information on the number of shares sold.
RRSP Meltdown Strategy
In Canada, RRSP holders must convert their RRSP to a Registered Retirement Income Fund (RRIF) by December 31 of the year in which the account holder turns 71. Once the RRSP is converted to a RRIF, annual minimum RRIF withdrawals are required. The minimum to be withdrawn annually is calculated by multiplying the value of the RRIF on January 1st by a prescribed percentage factor that is based on your age (or your spouse’s age). These limits increase with age.
Additional information is accessible on the Government of Canada website; this page shows the prescribed factor you should use based on the age of the RRIF annuitant or the spouse or common-law partner.
Depending on the value of your RRIF and other sources of income, a tax payer could find that their total income during retirement places them in the top income tax bracket hence the importance of seeking sound tax planning advice. A high level explanation of the onerous tax levels in different Canadian provinces is accessible here.
If you have been employed in Canada and have contributed to the Canada Pension Plan (CPP), you may be eligible to receive CPP benefits. This contributory, earnings-related social insurance program provides retirement, disability, and survivor benefits to Canadians. It is funded by contributions from employees, employers, and the self-employed, and its retirement pension replaces part of a person’s income upon retirement. To qualify for a CPP retirement pension, you must be at least 60 years old and have made at least one valid contribution.
An overview of the average and maximum monthly payment amounts for CPP pensions and benefits, except for the death benefit, which is a one-time payment and not a monthly payment, is accessible here.
In addition, the Canadian Federal government offers Old Age Security (OAS) which is a monthly taxable pension available to Canadian citizens and legal residents aged 65 and older who meet residency requirements. It provides a basic income for seniors and can be supplemented by other benefits like the non-taxable, income-based Guaranteed Income Supplement (GIS) for low-income pensioners. You can choose to start receiving the pension at 65 or delay it up to age 70 to increase the monthly payment amount.
Further details about OAS are accessible here.
OAS is considered taxable income and is subject to a recovery tax if your individual net annual income is higher than the net world income threshold set for the year ($90,997 for 2024).
In essence, the entire amount of your OAS could be subject to claw back.
In addition to the OAS pension, there are 3 other benefits available under the OAS program. Your annual income levels have to be so low to qualify for these other benefits that I hope you never qualify for them.
Business Overview
Read Part 1 Items 1 and 1A in the FY2025 Form 10-K that is accessible through the SEC Filing section of the company’s website.
The store units and square footage metrics provide an indication of just how massive WMT is. Despite the extent of its global presence, WMT has ample opportunity to expand its operations!
Financials
Q2 and YTD2026 Results
WMT’s Q2 2026 material (including the Form 10-Q) is accessible here.
Despite consumers’ financial constraints, WMT’s benefits of scale, attractive price positions, and convenient digital shopping options, is leading it to gain market share.
Following the Q2 2026 earnings call, WMT’s management team held a ‘buy side follow up call‘. During this call, management disclosed that the company is gaining share in households with income over $100,000.
WMT’s US e-commerce growth has accelerated to its highest level in over 2 years and various growth metrics on percentage terms exceed those of Amazon North America, Costco, BJ’s, and Target.
Conventional Free Cash Flow (FCF) Calculations (FY2020 – FY2025 and YTD2026)
FCF is a non-GAAP measure, and therefore, its method of calculation is open to debate. Most companies subtract capital expenditures (CAPEX) from Net Cash Provided by Operating Activities found in the Consolidated Statement of Cash Flows.
I generally analyze a company’s FCF from ‘conventional’ and ‘modified’ perspectives. The ‘conventional’ calculations do not deduct share-based compensation (SBC) while the ‘modified’ calculations deduct SBC. In several posts, I touch upon why I deduct SBC when analyzing a company’s FCF.
I am unable to determine WMT’s SBC (no reference is made in the Consolidated Statement of Cash Flows). I, therefore, I merely analyze WMT’s FCF from a conventional perspective.
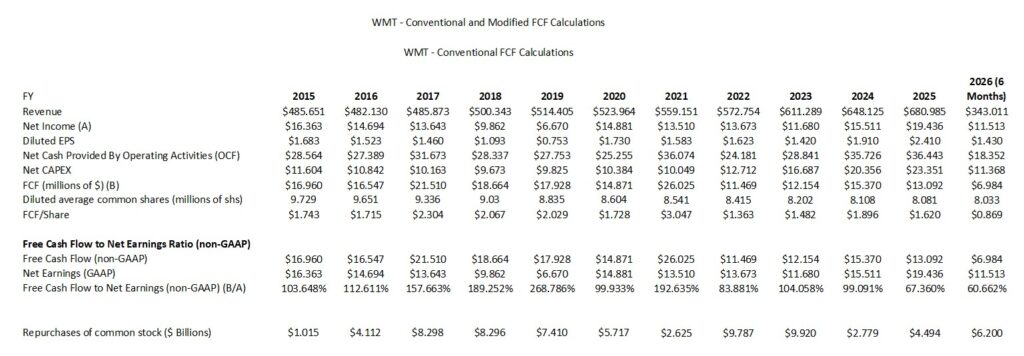
All data is from WMT’s Form 10-Ks. The diluted EPS, diluted average common shares, and FCF/share account for the 3-for-1 February 26, 2024 stock split.
The Net CAPEX deducts ‘Proceeds from disposal of property and equipment’ from ‘Payments for property and equipment’.
The YTD2026 results are only for the first 2 quarters of the current fiscal year.
As evidence of the inconsistency in calculating a company’s FCF, I provide the following from WMT’s Q2 2026 earnings presentation.
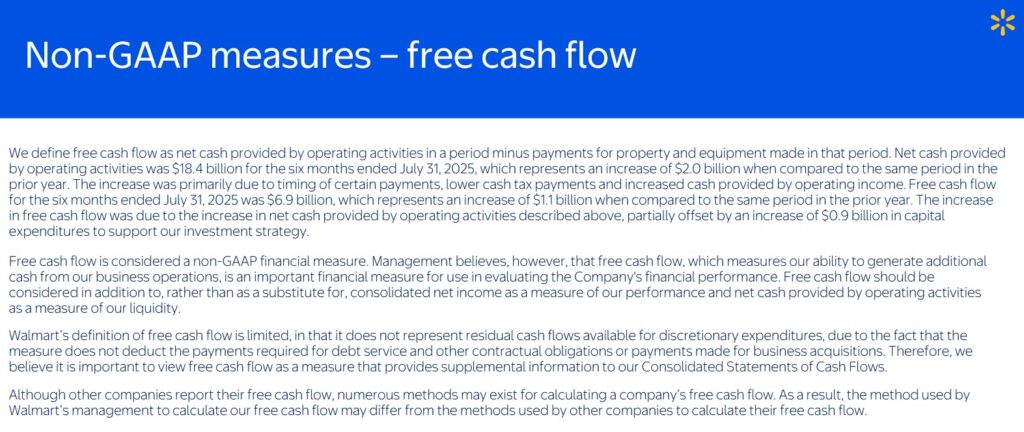
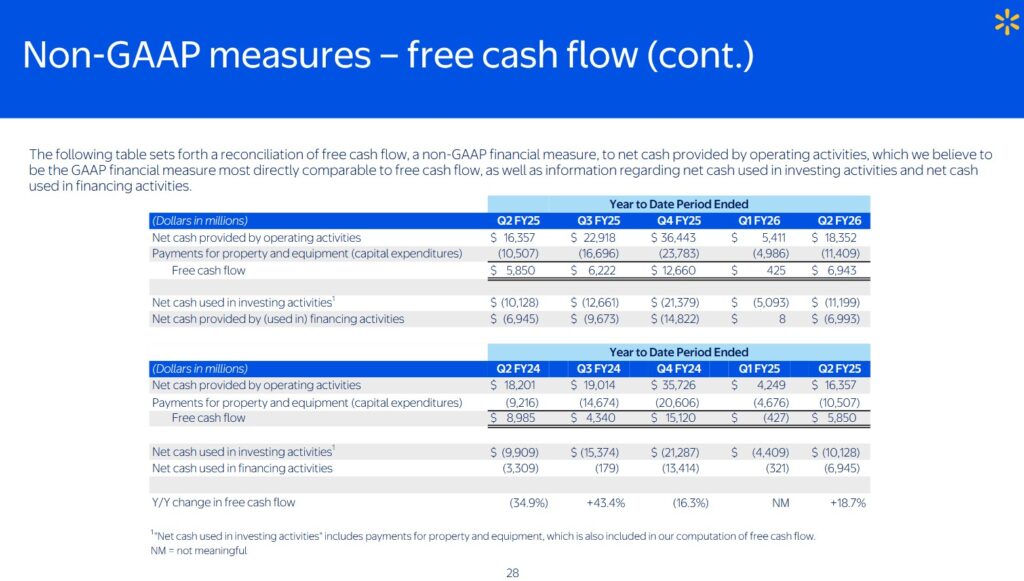
We see that WMT’s YTD2026 FCF totals total ~$6.943B versus my calculation of ~$6.984B. The ~$0.041B variance is because I add back ~$0.041B of proceeds from disposal of property and equipment.
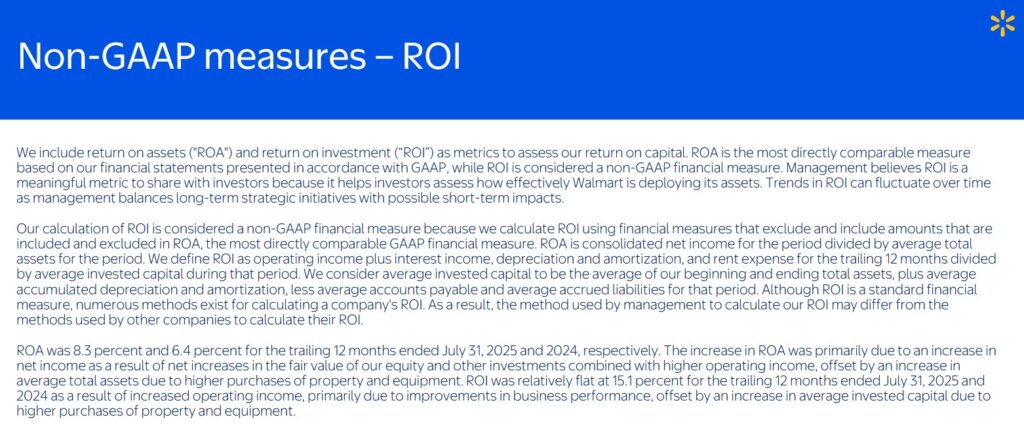
Return On Invested Capital (ROIC)
High quality companies often generate a high ROIC. If a company generates a high ROIC, it needs to invest less to achieve a certain growth rate thus reducing the need for external capital.
When a company consistently generates a high ROIC over the long term and it is growing its revenue, it can reinvest a portion of its profits under favorable conditions thereby leading to a compounding effect. I would much rather invest in a growing company that can reinvest to create greater shareholder value than to invest in a company that has limited growth opportunities and thus chooses to distribute a growing dividend.
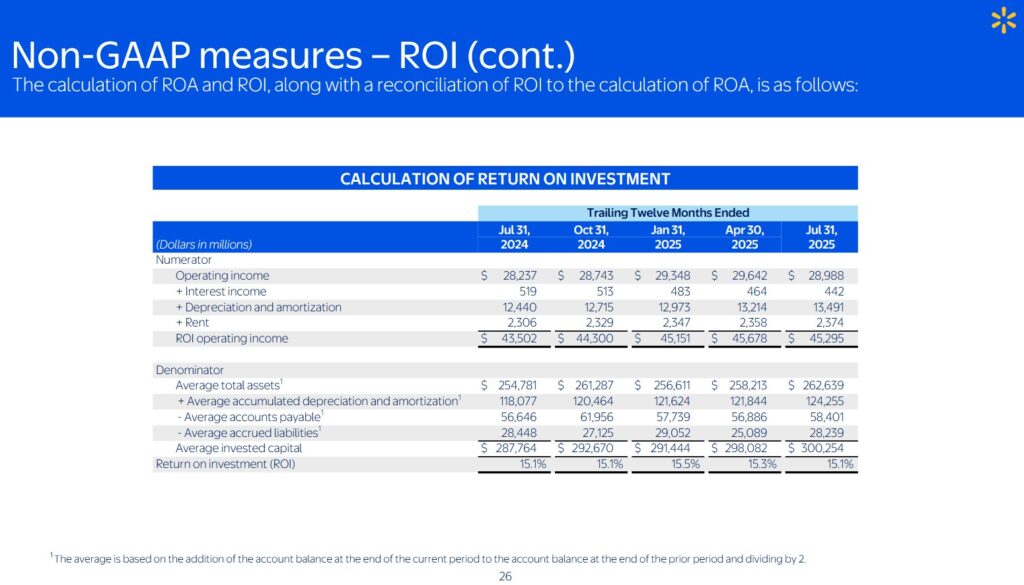
A company that generates $0.15/profit for every $1 invested, for example, achieves a ROIC of 15%. I consider a ~15%+ ROIC to be a reasonable minimum threshold because most of the time, a company’s cost of capital will be lower than this level.
Capital Allocation
On the Q2 2026 earnings call, WMT’s management states:
I think we’re very fortunate to be a company that has so many opportunities to invest a dollar for high returns.
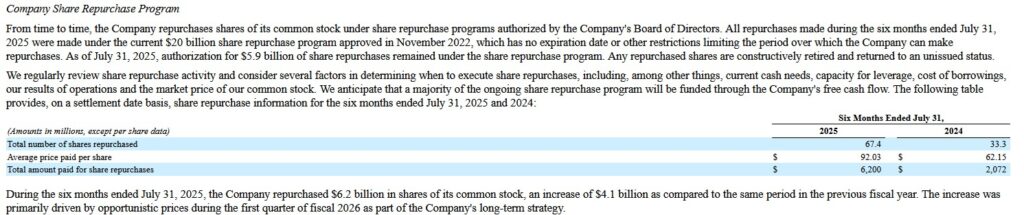
As I’ve said before, though, every dollar has to compete for that highest return. And I think we’re fortunate to have opportunities to invest in ourselves in things like technology, AI, supply chain automation to drive returns in some cases, in the 20% range. Because we generate a fair amount of free cash flow we have an opportunity to be balanced there. And in the most recent quarter, we also were aggressive in buying back more stock. Year-to-date, we bought back over $6 billion of our shares, and that’s 50% more than we did all of last year.
And so as the market dislocated a little bit with some of the concerns around tariffs earlier in the year, we were more aggressive, and we’ll continue to be aggressive buyers of our stock when we see prices dislocate because of all the things that you’ve heard today.
We have a lot of conviction in our plan. We like where we’re going. We like our strategy, and we believe that that’s going to generate returns well in excess of what we’ve done historically.
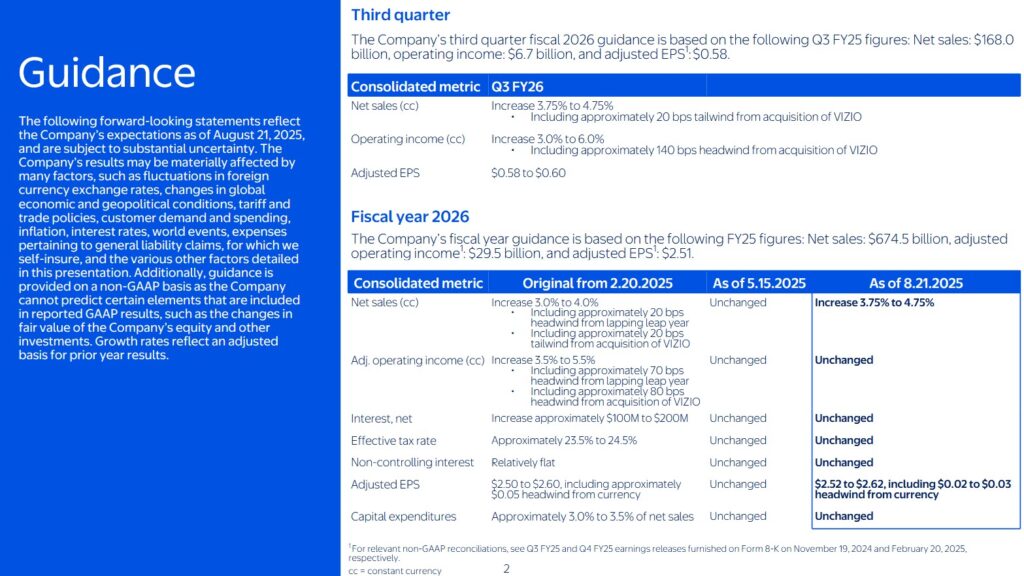
Q3 and FY2026 Guidance
The following reflects WMT’s most recent guidance. It will, however, be issuing its Q3 and YTD2026 results and Q4 and updated FY2026 guidance on November 20 2025.
Risk Assessment
Some investors fixate on an investment’s potential return and overlook the various risk aspects of the investment to their detriment. This is why I strongly encourage investors to read the ‘Risks’ section of a company’s Form 10-K.
While I try to assess a company’s risk, I also look at how the rating agencies perceive the company’s risk.
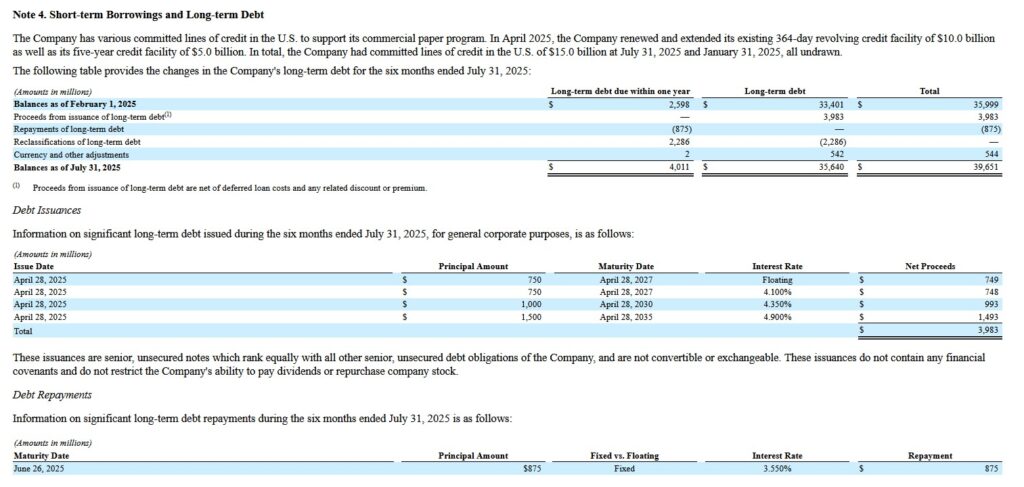
WMT’s current domestic long-term unsecured debt ratings and outlook are:
- Moody’s: Aa2 (stable) last reviewed October 13, 2022.
- S&P Global: AA (stable) last reviewed April 22, 2025.
- Fitch: AA (stable) last reviewed October 7, 2025.
All 3 ratings are the middle tier of the high-grade investment-grade category.
These ratings define WMT as having a very strong capacity to meet its financial commitments. It differs from the highest-rated obligors only to a small degree.
Dividend and Dividend Yield
WMT’s dividend history is accessible here. WMT declared a 3 for 1 stock split in February 2024 and did NOT lower its quarterly dividend in early 2024.
The table in the Conventional Free Cash Flow (FCF) Calculations (FY2020 – FY2025 and YTD2026) section of this post reflects the extent to which WMT has been reducing the weighted average shares outstanding.
The following is from WMT’s Q2 2026 Form 10-Q.
Valuation
WMT’s FY2026 outlook calls for non-GAAP EPS of ~$2.52 – ~$2.62. Using the current ~$107.73 share price, the forward adjusted diluted PE is ~41.1 – ~42.75.
Its valuation using the current broker guidance is:
- FY2026 – 36 brokers – mean of $2.61 and low/high of $2.55 – $2.71. Using the mean, the forward adjusted diluted PE is ~41.3.
- FY2027 – 37 brokers – mean of $2.93 and low/high of $2.75 – $3.14. Using the mean, the forward adjusted diluted PE was ~36.8.
- FY2028 – 22 brokers – mean of $3.27 and low/high of $3.04 – $3.67. Using the mean, the forward adjusted diluted PE was ~33.
WMT has generated FCF of ~$6.984B in the first half of FY2026. If it generates a comparable amount of FCF in the second half of FY2026, it should generate ~$14B for the year. Furthermore, let’s assume the weighted average shares outstanding for the year declines to 7.9B. This gives us ~$1.77 of FCF/share or a P/FCF of ~60.9.
If WMT were to generate ~$14B of FCF and the weighted average shares outstanding for the year were to decline to 7.7B, we get ~$1.82 of FCF/share giving us a P/FCF of ~59.2.
Should the share price drop to ~$90, and we use ~$1.80 FCF/share, the P/FCF becomes ~$50. Using ~$2.61 in FY2026 adjusted diluted EPS, and ~$90/share, the P/E is ~34.5.
Final Thoughts
I think WMT’s share price remains detached from its projected earnings and FCF. WMT’s valuation would still be rich even if the share price were to plummet to ~$90.
I need to withdraw funds from our retirement accounts for tax planning purposes. Despite liking WMT’s long-term outlook, its rich valuation is why I have chosen to cull my exposure.
Determining how long WMT’s valuation will remain rich is a crapshoot. Anyone who invested in WMT in mid-December 1999, however, had to wait until mid-2012 in order to reach their mid-December 1999 purchase price.
I still have WMT exposure but given the recent sale of WMT shares, I suspect it may not be a top 10 holding when I perform my 2026 year end portfolio review.
I wish you much success on your journey to financial freedom!
Note: Please send any feedback, corrections, or questions to finfreejourney@gmail.com.
Disclosure: I am long WMT.
Disclaimer: I do not know your circumstances and do not provide individualized advice or recommendations. I encourage you to make investment decisions by conducting your research and due diligence. Consult your financial advisor about your specific situation.
I wrote this article myself and it expresses my own opinions. I do not receive compensation for it and have no business relationship with any company mentioned in this article.