![]()
I last reviewed Veeva Systems (VEEV) in this August 28, 2025 post at which time the Q2 and YTD2026 results were the most current. With the release of Q3 and YTD2026 results following the November 20, 2025 market close, this is an opportune time to revisit the company’s valuation.
For the sake of full disclosure, I acquired an additional 100 shares on November 20, 2025 @ ~$239.1772. My current VEEV exposure is 600 shares in a ‘Core’ account in the FFJ Portfolio at an average cost of $212.5916.
Industry Overview
In September 2025, Research and Markets published its ‘Pharma And Biotech CRM Software Global Market Opportunities And Strategies To 2034‘ report. This report spans historic data (2019-2024) and forecasts through 2034, covering detailed regional and country-level analysis, market segmentation trends, and strategic market insights for pharma and biotech CRM software.
Findings from this analysis suggest a ~$4.33B global pharma and biotech Customer Relationship Management (CRM) software market. The expectation is for this market to grow to ~$6.55B by 2029 at a CAGR of 8.60%, ultimately reaching $9.85B by 2034. Key growth drivers include rising telemedicine, increasing clinical trials, growing healthcare expenditure, and demand for cloud-based solutions. This growth, however, faces challenges such as regulatory complexity and data privacy concerns.
The market is segmented by technology, deployment, enterprise size, and industry. In 2024, conventional CRM held the largest technology share (81.95%). AI-based CRM, however, is the fastest-growing segment with a CAGR of 14.6% through 2029. The cloud-based deployment segment is dominant (61.82%) and also the fastest growing (9.91% CAGR). Large enterprises currently dominate the market (62.22%), but small and medium enterprises (SMEs) are the fastest-growing segment (11.0% CAGR). Pharmaceutical companies represent the majority industry segment (68.10%), with biotech growing fastest (10.64% CAGR).
Regionally, North America is the largest market (36.24% share), followed by Asia Pacific and Western Europe. The Asia Pacific and Middle East regions exhibit the fastest growth among regions, with CAGRs of 10.02% and 9.53%, respectively.
The market is highly concentrated, with the top 10 players controlling nearly 95% of the market. Veeva Systems Inc. (VEEV) leads with a 26.81% market share, followed by IQVIA, Salesforce, Oracle, SAP, Microsoft, Zoho, Pega, HubSpot, and Indegene.
Future growth opportunities lie in integrating electronic health records, AI-driven CRM personalization, generative AI enhancements, cloud solutions, omnichannel campaigns, and strategic partnerships. Challenges include resistance to digital adoption, talent shortages, and trade tensions.
Business Overview
VEEV is the leading provider of industry cloud solutions for the global life sciences industry. Its offerings span cloud software, data, and business consulting and are designed to meet customers’ unique needs and their most strategic business functions ranging from R&D through commercialization. These solutions help life sciences companies develop and bring products to market faster and more efficiently, market and sell more effectively, and maintain compliance with government regulations.
The best way to learn about the company is to review the company’s website and Part 1 in the most recent Form 10-K found in the SEC Filings section of the company’s website.
In 2019, VEEV set an ambitious target of achieving $3B of annual revenue by 2025. Having achieved this target, the company’s new ambitious target is to double revenue to $6B by FY2030.
Financial Review
Q3 and YTD2026
Material related to the Q3 and YTD2026 earnings release (including management’s prepared remarks) is accessible here.
Operating Cash Flow (OCF), Free Cash Flow (FCF), and CAPEX
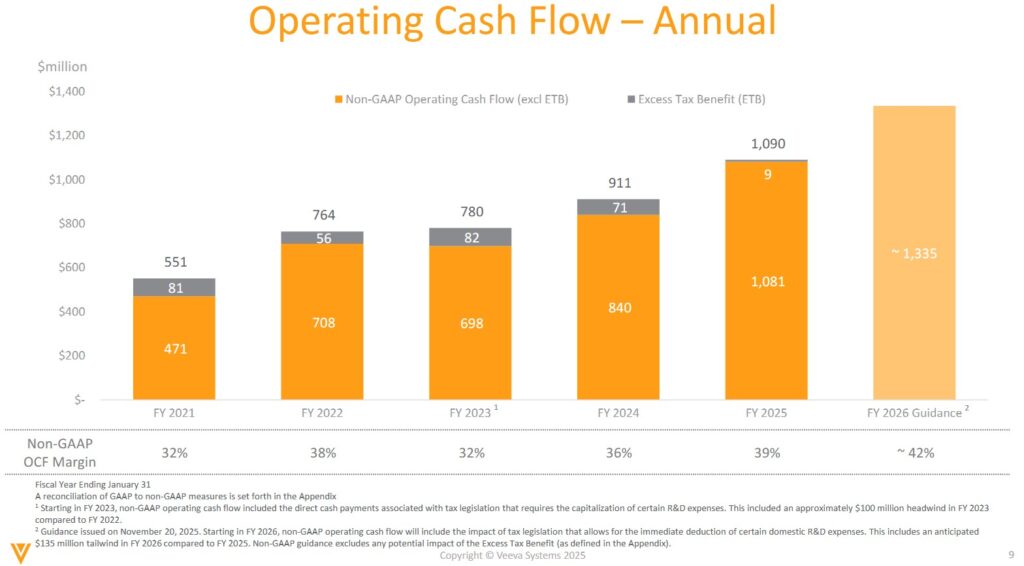
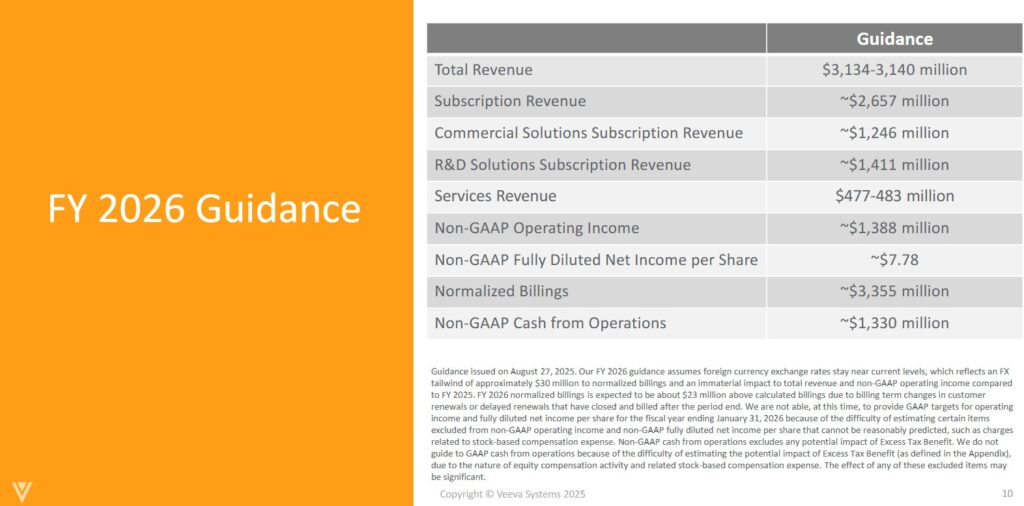
VEEV reports the following annual OCF over the past few years. The current FY2026 guidance calls for ~$1.335B of OCF and a non-GAAP OCF margin of ~42%.
The guidance released with Q2 2026 results on August 27, 2025, was ~$1.330B and ~42%.
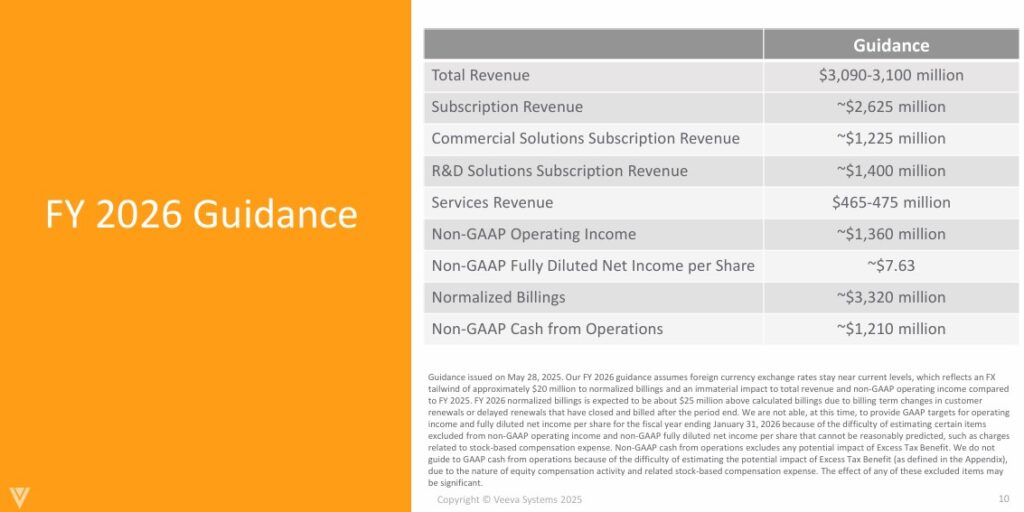
The guidance released with Q1 2026 results on May 28, 2025, was ~$1.21B and ~39%.
VEEV deducts CAPEX from OCF to calculate its FCF. In prior posts, however, I explain my rationale for also deducting share-based compensation (SBC) from a company’s OCF.
The following reflects VEEV’s FCF using the conventional and modified methods. We see from the historical results that the magnitude VEEV’s SBC has a material impact on FCF/share.
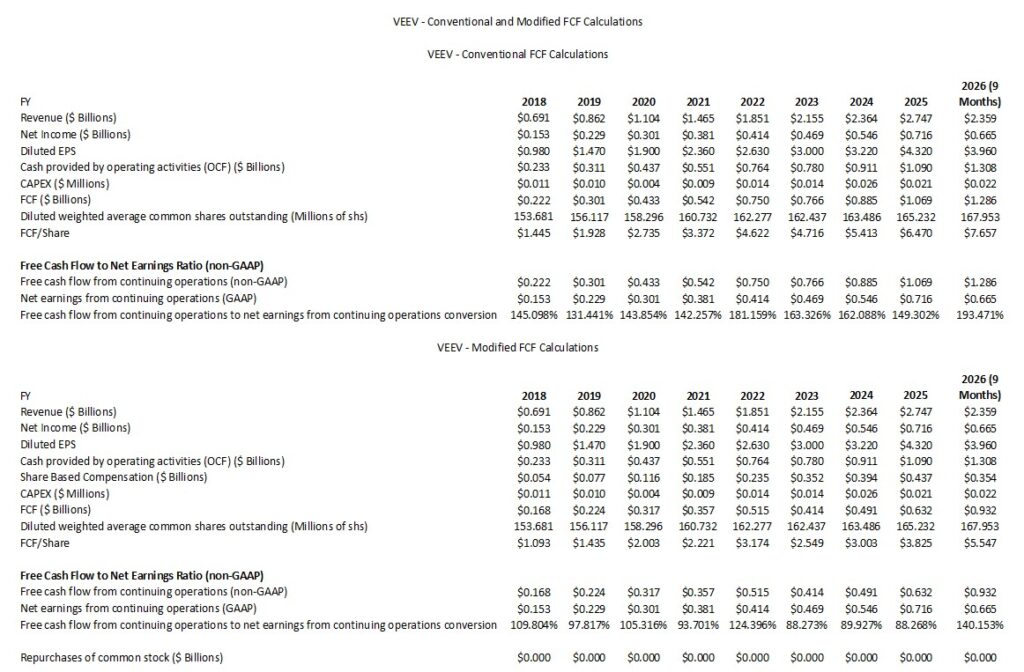
I suspect VEEV’s YTD2026 FCF/Net Earnings ratio will retrace to historical levels by the end of FY2026.
VEEV’s CAPEX might be relatively insignificant. You should be aware, however, that it spends a considerable amount on research and development (~$0.512B and ~$0.569B in the first 9 months of FY2025 and FY2026).
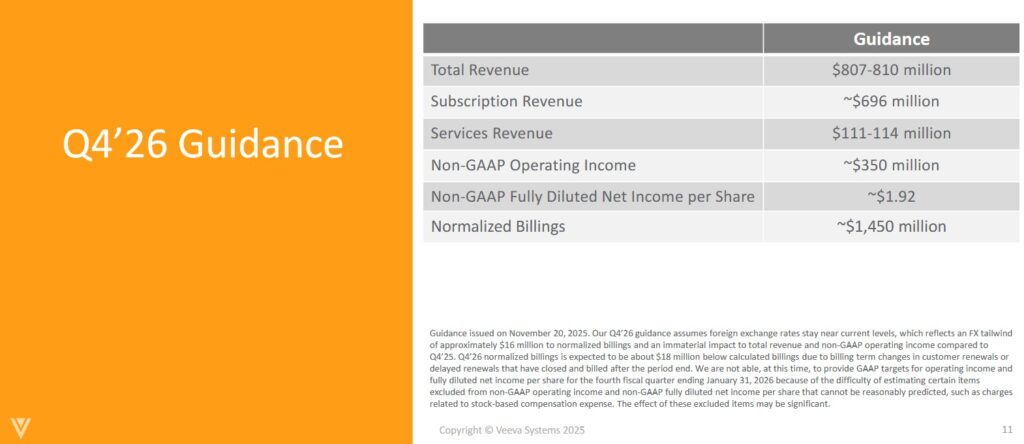
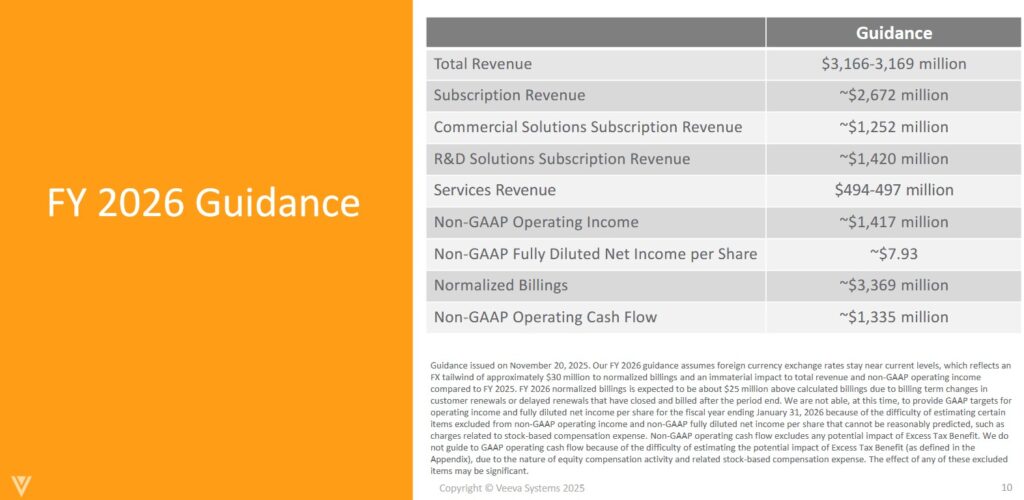
Q4 and FY2026 Outlook
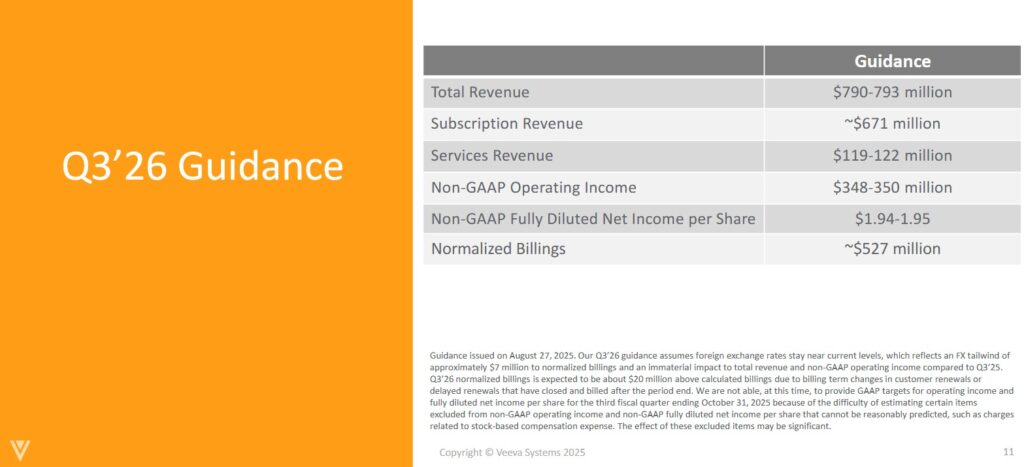
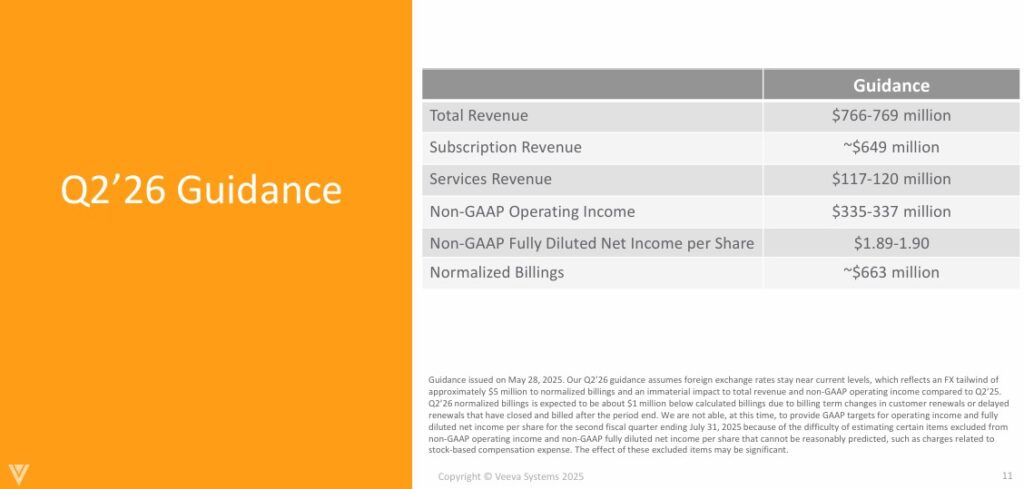
The following reflects VEEV’s current and prior outlook. All metrics have been guided higher each quarter in FY2026.
This is the outlook VEEV released with Q2 2026 results.
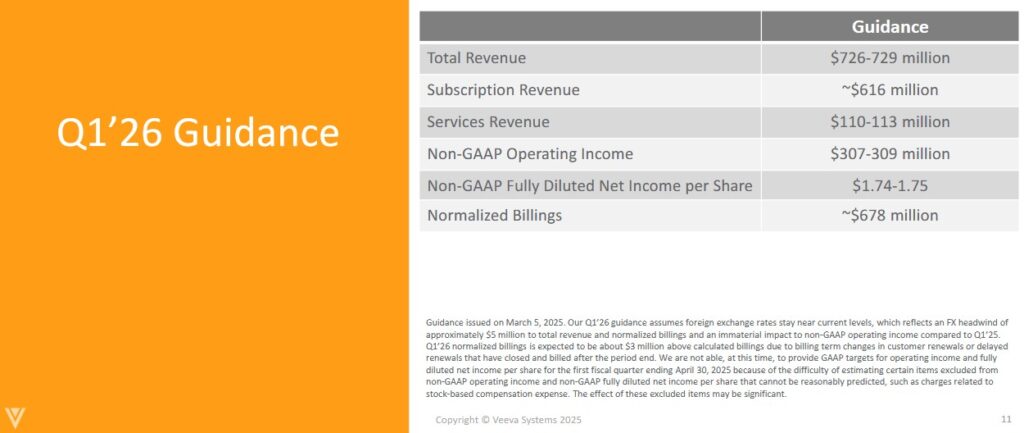
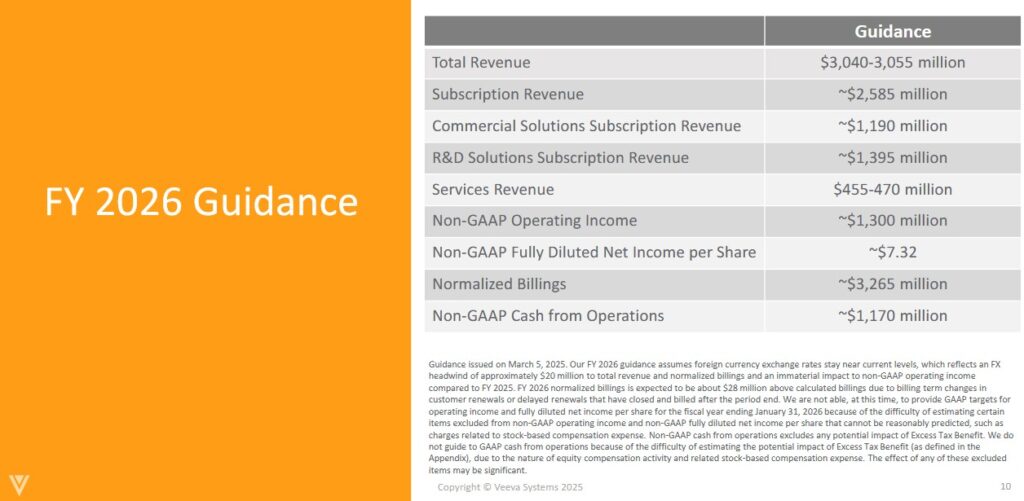
The following reflects VEEV’s outlook released with Q1 2026 results.
The following reflects VEEV’s outlook released with Q4 2025 results.
Risk Assessment
VEEV has no debt to rate.
At the end of Q3 2026, VEEV had ~$1.660B in cash and cash equivalents and ~$4.977B in short-term investments for a total of ~$6.637B. In comparison, it had:
- ~$1.930B and ~$4.473B for a total of ~$6.403B at the end of Q2 2026;
- ~$1.965B and ~$4.103B for a total of ~$6.068B at the end of Q1 2026;
- ~$1.119B and ~$4.031B for a total of ~$5.15B at FYE2025; and
- ~$0.703B and ~$3.324B for a total of ~$4.027B at FYE2024.
Its total liabilities at the end of Q3 2026 was ~$1.057B of which ~$0.822B was deferred revenue (funds received from clients in advance of services being provided) leaving ~$0.235B in all other liabilities. In comparison, it had:
- ~$1.361B in total liabilities of which ~$1.108B was deferred revenue leaving ~$0.253B in all other liabilities at the end of Q2 2026;
- ~$1.554B in total liabilities of which ~$1.246B was deferred revenue leaving ~$0.308B in all other liabilities at the end of Q1 2026;
- ~$1.507B in total liabilities of which ~$1.274B was deferred revenue leaving ~$0.233B in all other liabilities at FYE2025; and
- ~$1.266B in total liabilities of which ~$1.050B was deferred revenue leaving ~$0.216B in all other liabilities at FYE2024.
VEEV satisfies my risk-averse investor profile.
Dividends and Dividend Yield
VEEV does not distribute a dividend.
The weighted average number of diluted shares outstanding (in millions rounded) in FY2021 – 2025 is 160.7, 162.2, 162.4, 163.5, and 165.2. The weighted average in the first 9 months of FY2026 was 167.953 and 168.935 in Q3.
If I have one concern about VEEV, it is the extent to which it compensates employees by way of SBC. VEEV typically does not repurchase shares to offset the shares it issues annually as part of its employee compensation structure. I think VEEV will, at some point, need to address the increase in the weighted average number of diluted shares outstanding. Until such time as share repurchases form part of VEEV’s capital allocation strategy, I am satisfied that funds be retained in the company to finance growth.
Valuation
Following the share price pullback after the release of Q3 and YTD2026 results and the increase in management’s guidance, VEEV’s valuation is attractive. I have, therefore, acquired an additional 100 shares in a ‘Core’ account in the FFJ Portfolio @ ~$239.1772 on November 21, 2025.
Valuation Based On FCF Estimates
The company’s FY2026 Non-GAAP Fully Diluted Net Income per Share outlook is ~$7.93. The non-GAAP and GAAP diluted EPS values in FY2022 – FY2025 reflect an increasing variance between GAAP and non-GAAP earnings.
- In FY2025, VEEV generated $6.60 and $4.32 of non-GAAP and GAAP earnings per share, a variance of $2.28.
- In FY2024, VEEV generated $4.84 and $3.22 of non-GAAP and GAAP earnings per share, a variance of $1.62.
- In FY2023, VEEV generated $4.28 and $3.00 of non-GAAP and GAAP earnings per share, a variance of $1.28.
- In FY2022, VEEV generated $3.73 and $2.63 of non-GAAP and GAAP earnings per share, a variance of $1.10.
In the first 9 months of FY2026, VEEV generated $6.00 and $3.96 of non-GAAP and GAAP earnings per share for a variance of $2.04.
If the variance continues at the same pace as in the first 3 quarters, the variance for the entire year could be ~$2.80. Deduct ~$2.80 from the ~$7.93 FY2026 non-GAAP outlook and the FY2026 GAAP EPS could be ~$5.13.
If we apply a 140% FCF to net earnings ratio (to be somewhat consistent with prior years), VEEV’s FCF/share could be ~$7.18 (~$5.13 x 140%) when calculated under the conventional method.
If we apply a 95% FCF to net earnings ratio (to be somewhat consistent with prior years), VEEV’s FCF/share would be ~$4.87 (~$5.13 x 95%) when calculated under the modified method.
VEEV’s share price has plunged of late yet the company is still performing well. As a result, I acquired 100 additional shares @ ~$239.1772 on November 21, 2025. Using this purchase price, VEEV’s P/FCF is ~33.3 if we use ~$7.18 or ~49.1 if we use ~$4.87.
These valuations are far superior to those reflected in my prior post.
Valuation Based On Adjusted Diluted EPS Broker Estimates
Broker earnings estimates are currently under revision. At the moment, however, the following are VEEV’s forward adjusted diluted PE levels using the current broker estimates and my ~$239.1772 purchase price.
- FY2026 – 30 brokers – mean of $7.89 and low/high of $7.78 – $8.04. Using the mean estimate, the forward adjusted diluted PE is ~30.3.
- FY2027 – 30 brokers – mean of $8.49 and low/high of $7.55 – $8.91. Using the mean estimate, the forward adjusted diluted PE is ~28.2.
- FY2028 – 22 brokers – mean of $9.71 and low/high of $8.54 – $13.42. Using the mean estimate, the forward adjusted diluted PE is ~24.6.
In my August 28, 2025 post I reflect the following:
Valuation Based On FCF Estimates
The company’s FY2026 Non-GAAP Fully Diluted Net Income per Share outlook is ~$7.78. The non-GAAP and GAAP diluted EPS values in FY2022 – FY2025 reflect an increasing variance between GAAP and non-GAAP earnings.
- In FY2025, VEEV generated $6.60 and $4.32 of non-GAAP and GAAP earnings per share, a variance of $2.28.
- In FY2024, VEEV generated $4.84 and $3.22 of non-GAAP and GAAP earnings per share, a variance of $1.62.
- In FY2023, VEEV generated $4.28 and $3.00 of non-GAAP and GAAP earnings per share, a variance of $1.28.
- In FY2022, VEEV generated $3.73 and $2.63 of non-GAAP and GAAP earnings per share, a variance of $1.10.
In the first half of FY2025, VEEV generated $3.12 and $2.02 of non-GAAP and GAAP earnings per share, a variance of $1.10. In comparison, VEEV generated $3.96 and $2.56 of non-GAAP and GAAP earnings per share (a $1.40 variance) in the first half of FY2026.
If the variance in the second half of FY2026 is similar to that in the first half, the variance for the entire year could be ~$2.80. Deduct ~$2.80 from the ~$7.78 FY2026 non-GAAP outlook and the FY2026 GAAP EPS could be ~$4.98.
If we apply a 140% FCF to net earnings ratio (to be somewhat consistent with prior years), VEEV’s FCF/share could be ~$6.97 (~$4.98 x 140%) when calculated under the conventional method.
If we apply a 95% FCF to net earnings ratio (to be somewhat consistent with prior years), VEEV’s FCF/share would be ~$4.73 (~$4.98 x 95%) when calculated under the modified method.
With shares trading at ~$278 as I compose this post, VEEV’s P/FCF is ~40 if we use ~$6.97 or ~58.8 if we use ~$4.73.
At the time of my May 29, 2025 post, VEEV’s share price was ~$279. My calculations suggested that VEEV’s forward P/FCF was ~39.5 and ~66.6 calculated using the conventional and modified FCF.
Valuation Based On Adjusted Diluted EPS Broker Estimates
Broker earnings estimates are currently under revision. At the moment, however, the following are VEEV’s forward adjusted diluted PE levels using the current broker estimates and a ~$278 share price.
- FY2026 – 30 brokers – mean of $7.75 and low/high of $7.62 – $7.93. Using the mean estimate, the forward adjusted diluted PE is ~35.9.
- FY2027 – 30 brokers – mean of $8.42 and low/high of $7.55 – $8.96. Using the mean estimate, the forward adjusted diluted PE is ~33.
- FY2028 – 18 brokers – mean of $9.66 and low/high of $8.24 – $13.78. Using the mean estimate, the forward adjusted diluted PE is ~28.8.
At the time of my May 29, 2025 post, the following were VEEV’s forward adjusted diluted PE levels using the current broker estimates and a ~$279 share price.
- FY2026 – 29 brokers – mean of $7.50 and low/high of $7.17 – $7.76. Using the mean estimate, the forward adjusted diluted PE is ~37.2.
- FY2027 – 29 brokers – mean of $8.24 and low/high of $7.58 – $8.69. Using the mean estimate, the forward adjusted diluted PE is ~33.9.
- FY2028 – 12 brokers – mean of $9.38 and low/high of $8.56 – $10.10. Using the mean estimate, the forward adjusted diluted PE is ~29.7.
Final Thoughts
I retired in May 2016 with absolutely no intention of returning to the workforce. Despite the termination of ‘paycheque’, I did not want to fall in the trap of retiring and trying to stretch our ‘nest egg’ during retirement. I set an objective of at least doubling our net worth every decade. If we apply the rule of 72, this means I need to generate a ~7.2% annual rate of return.
So far, we have surpassed this annual rate of return. I, however, have no idea what the future holds. Given this, I do not ‘shoot for overnight home runs’ as my risk tolerance is conservative.
Some investors may look at our FFJ Portfolio and wonder if I am on drugs. No worries. I like to sleep at night. With the holdings in this portfolio and our retirement accounts, I don’t really care if we get a 50%+ market correction. The companies in which I have invested have a reasonable probability of being stronger a decade from now.
VEEV is a good example of a company where I don’t need to worry about it imploding overnight. The share price may experience considerable volatility but the underlying fundamentals are unlikely to quickly deteriorate.
Note: Please send any feedback, corrections, or questions to finfreejourney@gmail.com.
Disclosure: I am long VEEV.
Disclaimer: I do not know your circumstances and do not provide individualized advice or recommendations. I encourage you to make investment decisions by conducting your own research and due diligence. Consult your financial advisor about your specific situation.
I wrote this article myself and it expresses my own opinions. I do not receive compensation for it and have no business relationship with any company mentioned in this article.