![]()
The recent Thomson Reuters (TRI) sell-off has sent shockwaves through the professional services sector. TRI’s share price has tumbled just over 50% in the last 6 months!
Despite Q4 and FY2025 results beating analyst expectations and posting solid growth, many investors are gripped by a sudden bout of AI anxiety which is largely fueled by Anthropic’s recent launch of Claude legal automation tools.
A closer look at the fundamentals, however, suggests the panic is fundamentally disconnected from the data. On the on February 5, 2026 Q4 2025 earnings call, TRI’s CEO labels the reaction as ‘anxiety, not fundamentals’.
In this December 15, 2025 post I disclose a new TRI position with the purchase of 300 shares @ USD~$131.75 in one of the ‘Core’ accounts in the FFJ Portfolio. I subsequently purchased an additional 200 shares on January 20, 2026 @ $USD122.72 in the same account. I disclose this purchase in this January 10, 2026 post.
The closing share price on February 6, 2026, however, is ~USD$88.00.
NOTE: TRI is a Canadian company that reports in USD. Shares are listed on the New York Stock Exchange (NYSE) and the Toronto Stock Exchange (TSX) in Canada. I own the US shares.
Industry Overview
I provide a very high level industry overview in my December 15, 2025 post.
Business Overview
A good overview of the company is found:
- in Part 1 Item 1 in the FY2024 Form 40-F accessible through the SEC Filings section of the company’s website; and
- the company’s website.
A more current filing can expected in early March 2026.
I also recommend reviewing TRI’s 2024 Investor Day presentation.
NOTE: TRI changed the names of its Tax & Accounting Professionals segment to Tax, Audit & Accounting Professionals and its Reuters News segment to Reuters to reflect the broader scope of the activities in each of the respective segments. These name changes did not change the segments’ composition or the measurement of the segments’ results as previously or currently reported.
Financials
Q4 and FY2025 Results
TRI’s Q4 and FY2025 results are accessible in the Form 6-K filed on February 5 (see SEC Filings).
TRI faces risks but the company is keenly aware of these risks. In a January 2026 report from the Thomson Reuters Institute, the warning is of a potential ‘AI bubble’. This report highlights what could occur if the bubble bursts or client budgets tighten due to broader economic cooling. Firms may shift from ‘premium value’ providers like TRI to ‘lower-cost’ firms or software.
None of these risks come as a ‘surprise’ to TRI’s management and on the Q4 2025 earnings call prepared remarks and the subsequent Q&A session, management highlights several critical risks that can be categorized into competitive disruption, execution challenges, and macroeconomic pressures and how the company will adapt in a rapidly changing environment.
Competitive Disruption
The most immediate risk is the emergence of low-cost, high-capability AI alternatives.
On January 30, 2026, Anthropic released a legal plug-in for its Claude model that automates contract reviews and legal briefings. This represents a risk whereby law firms and corporate legal departments may elect to bypass premium products like TRI’s Westlaw for cheaper, general-purpose AI tools.
The competition may be unable to match TRI’s data quality. Their presence, however, may put pressure on pricing packages for basic and mid-level legal tasks. This could compress TRI’s high margins in the Legal Professionals segment. In FY2025, this business segment generated a ~47.3% adjusted EBITDA margin and ~38.4% of FY2025 Revenue.
TRI intends to to fend off the competition which will require heavy CAPEX expenditures. As evidence that TRI has anticipated a changing competitive landscape, it acquired Casetext for ~$0.65B in 2023. This acquisition was designed to accelerate TRI’s AI roadmap, specifically by integrating Casetext’s CoCounsel (the first-ever AI legal assistant powered by GPT-4) into the Westlaw and Practical Law ecosystems. The risk with such a significant investment is that it may not generate a proportional increase in ‘Annualized Contract Value’ (ACV) if customers perceive AI as a standard feature rather than a premium upgrade.
Furthermore, TRI’s own AI tools make legal and tax professionals more efficient. It is possible that TRI’s clients may require fewer seats or licenses, potentially cannibalizing TRI’s traditional volume-based revenue models.
Market Sentiment
General-purpose AI competitors present a risk. O the Q4 2025 earnings call, however, TRI’s CEO emphasizes the ‘moat’ created by TRI’s proprietary editorially enhanced content. Nevertheless, there is ongoing investor concern that general-purpose models could eventually compete with professional-grade AI tools.
Segment Specific Headwinds
The Legal Professionals segment faces headwinds in its government business. Management expects a growth slowdown in Q1 2026 due to the impact of prior contract cancellations, which may cause quarterly variability in the broader legal segment’s performance.
The long-standing trend of declining print revenues continues with a 6% YoY declined in Q4. This aligns with expectations, however, it remains a persistent drag on total revenue growth.
There was a ‘one-off decline’ in generative AI-related content licensing revenue for Reuters in 2025 compared to the previous fiscal year. Management’s expectation is for a rebound in FY2026.
Regulatory and Ethical Risks
As TRI moves toward ‘Agentic AI’ that performs multi-step tasks, the risk of incorrect legal/tax advice increases. Any high-profile failure of a TRI-backed AI tool could lead to significant reputational damage or professional liability claims.
TRI possesses vast troves of legal, tax and accounting content that is has amassed over decades. This is curated by a staff of more than 2,700 attorney editors and tax experts which should enable it to train better AI-based products than its newer competitors. Most of those competitors, for example, are merely using AI to build new tools to help legal professionals with research, document drafting and other repeatable tasks that can be at least partly automated. Companies such as Anthropic, for example, are building tools that are good at automating general-purpose tasks. Unless they make the huge investments to buy content and acquire expert staff, however, they will struggle to replicate TRI’s offerings.
In FY2025, TRI spent more than US$0.2B on AI upgrades and the expectation is for this to recur in FY2026. This investment will allow TRI to do complex tasks that have multiple steps with fewer prompts from human users.
The very nature of the services provided by the lawyers and tax professionals makes the stakes very high. They must be able to rely on accurate information to make their decisions.
Talent and Workforce Challenges
TRI has specifically identified talent shortages in the tax and accounting sectors that could impact the growth of their professional services and the ability of its clients to fully utilize their products.
TRI’s shift toward an ‘AI-first’ company involves significant restructuring. It recorded $19 million in severance expenses in Q4 related to transformation initiatives. Additional costs are anticipated as they continue to ‘re-imagine’ workflows.
Financial and Macroeconomic Risks
Interest expenses were higher than forecast, driven by the pace of the share repurchase program and fluctuations in market interest rates.
Foreign currency movements negatively impacted adjusted EBITDA margins by ~30 bps in Q4 2025.
Management acknowledges that M&A is ‘inherently tricky’. The goal, however, is to deploy ~$11B of capital through 2028. This will expose TRI to risks related to high private market valuations and the integration of new acquisitions.
Operational Execution
The adoption of AI-enabled products such as Westlaw Advantage and CoCounsel has been strong. TRI’s FY2026 outlook, however, depends heavily on the continued rapid scaling of these GenAI offerings. Any delay in customer migration or product performance issues could impact the 7.5% – 8.0% organic revenue growth target.
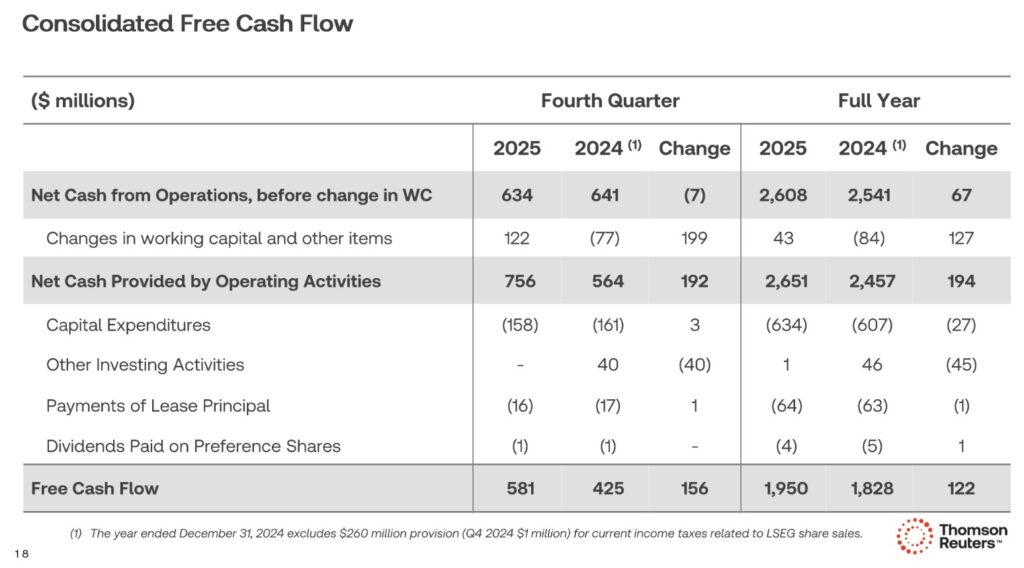
Operating Cash Flow (OCF), Free Cash Flow (FCF), and CAPEX
In prior posts I touch upon my rationale for deducting stock-based compensation (SBC) to calculate FCF. I, therefore, dispense with explaining this again.
The sale of the majority stake in the Financial & Risk (F&R) business (renamed Refinitiv) in 2018 resulted in a massive decline in TRI’s reported consolidated revenue. Prior to the sale, the F&R business was TRI’s largest division by revenue.
The sale reflected TRI’s strategic pivot to focus on high-growth, recurring-revenue businesses. The revenue reduction was not a complete loss of revenue from the F&R business because TRI retained a 45% equity stake in the new Refinitiv business and it entered into a 30-year agreement for Reuters News to supply news and editorial content to Refinitiv. This created a new revenue stream for the News segment.
TRI sold its remaining 45% stake in Refinitiv to the London Stock Exchange Group (LSEG) in an all-share transaction that closed in January 2021, further completing the strategic separation from the financial data business.
The following compares TRI’s FCF using the ‘conventional’ and ‘modified’ calculation methods.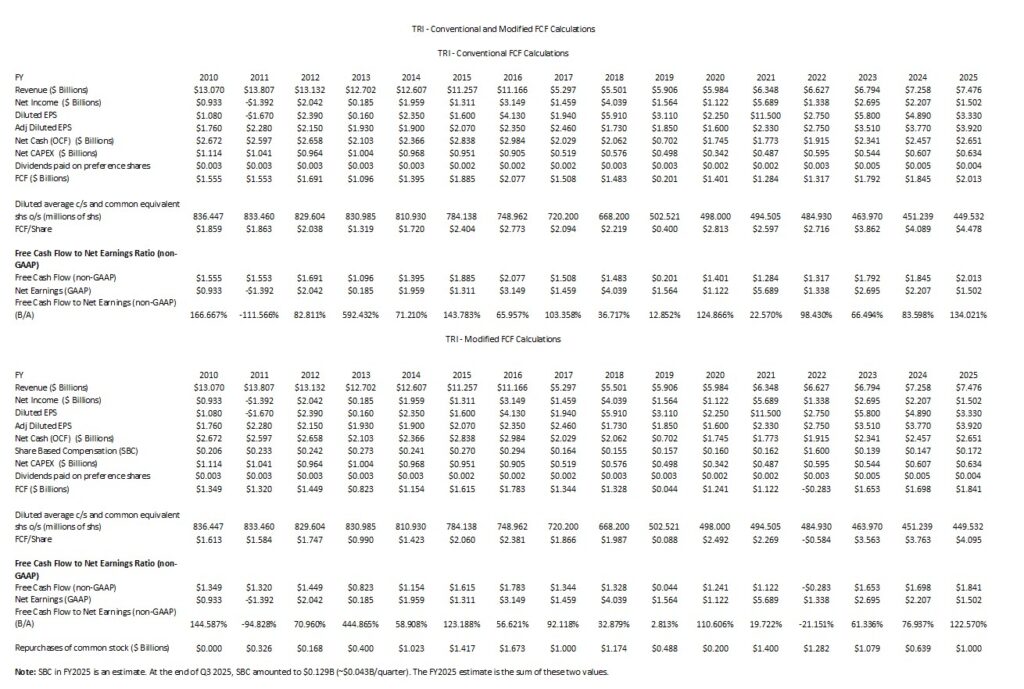
My FCF calculations differ slightly from those calculated by TRI. This is because TRI includes the ‘Other Investing Activities’ and ‘Payments of Lease Principal’ line items in its calculations. The values of these line items are relatively insignificant. They, therefore, have no meaningful impact on my analysis. My ‘modified’ FCF calculations, however, reflect lower FCF because the value of annual SBC is in excess of ‘Other Investing Activities’ and ‘Payments of Lease Principal’.
Capital Allocation
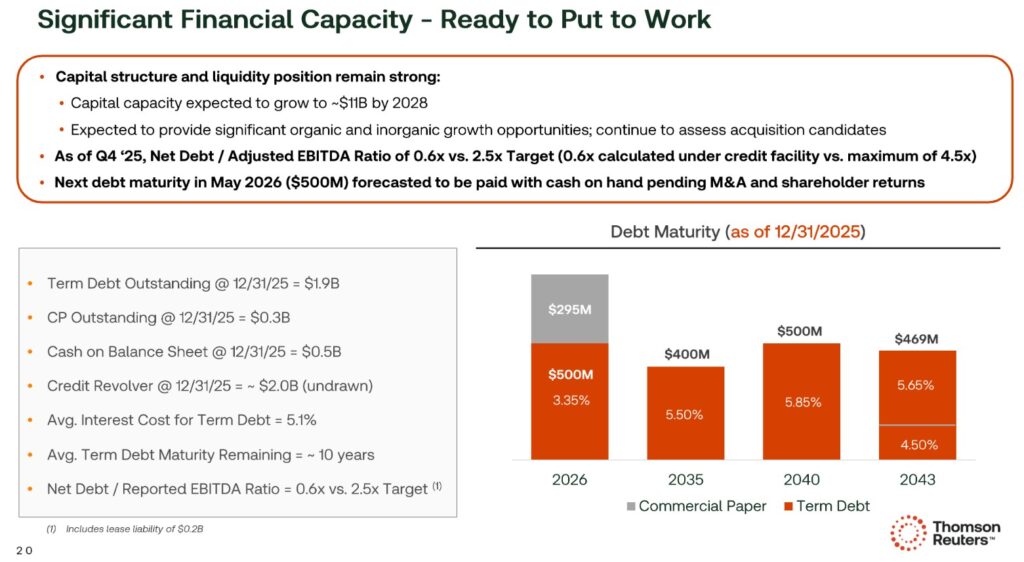
TRI has historically maintained a disciplined capital strategy that balances growth, long-term financial leverage, credit ratings, and returns to shareholders.
A key focus is to have the investment capacity to drive revenue growth, both organically and through acquisitions, while also maintaining long-term financial leverage and credit ratings and continuing to provide returns to shareholders. The firm’s principal sources of liquidity are cash and cash equivalents and cash provided by operating activities. From time to time, TRI will also issue commercial paper, issue debt securities and borrow under its credit facility. The principal uses of cash are for debt repayments, debt servicing costs, dividend payments, capital expenditures, share repurchases and acquisitions.
TRI’s capital strategy approach has provided it with a strong capital structure and liquidity position thus enabling it to pursue organic and inorganic opportunities in key growth segments to drive shareholder returns. Its disciplined approach and highly recurring cash generative business model have allowed it to weather economic volatility in recent years caused by macroeconomic and geopolitical factors, while continuing to invest in the business.
The company expects that the operating leverage of its business will increase FCF if revenues increase as contemplated by management’s outlook.
TRI’s maximum leverage ratio is 2.5x net debt to adjusted EBITDA and it continues to target:
- a payout of 50% – 60% of expected FCF as shareholder dividends;
- a return of at least 75% of annual FCF to shareholders in the form of dividends and share repurchases; and
- a return on invested capital (ROIC) that is double or more of the firm’s weighted-average cost of capital over time.
FY2026 Outlook
The following reflects TRI’s preliminary FY2026, current FY2026 outlook, and FY2025 results.
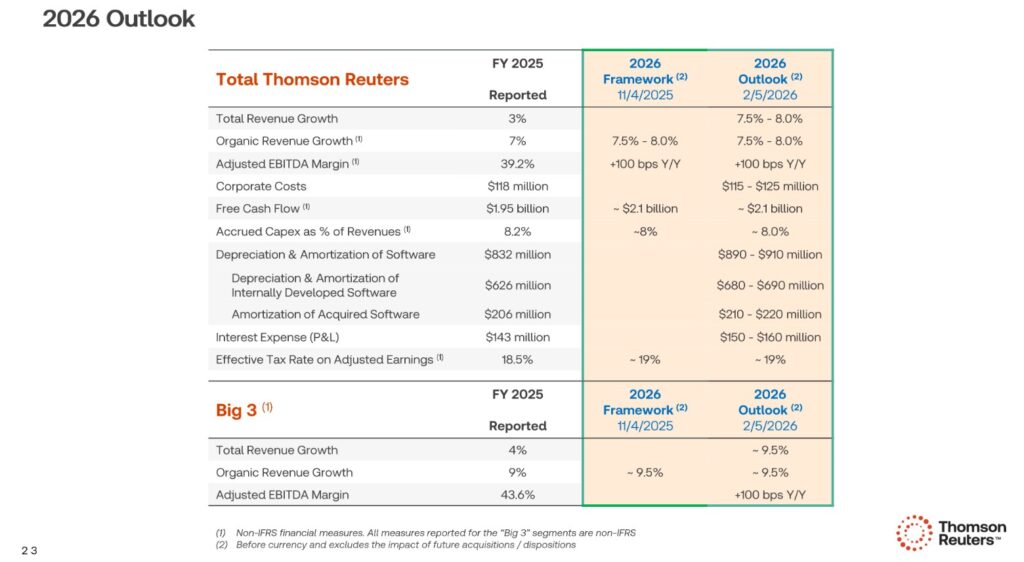
On the Q4 2025 earnings call, management reaffirmed its FY2026 outlook for organic revenue growth of 7.5% – 8% including ~9.5% for the ‘Big 3’ Segments combined (Legal Professionals, Corporates and Tax, Audit & Accounting Professionals). As of the Q4 2025 earnings report, these three segments collectively represented ~82% of total company revenue.
ROIC and WACC
Return on Invested Capital (ROIC) provides an indication of a company’s efficiency. In essence, is a company actually creating value or ‘burning’ cash for the sake of growth?
A company with a higher ROIC is mathematically worth more because it requires less reinvestment to achieve that growth.
A good indication of how well a company is performing is to compare ROIC to the Weighted Average Cost of Capital (WACC). WACC, however, is not a metric officially reported by TRI but it can be roughly estimated based on the company’s credit profile and market conditions.
The generally accepted high-level formula used by Wall Street is:
ROIC = NOPAT/Average Invested Capital
with the Net Operating Profit After Tax (NOPAT) formula being Operating Income (EBIT) x (1-tax rate)
This shows how much profit the core business makes while ignoring how much debt the company has.
The Average Invested Capital is the total money tied up in the business.
- The Operating Approach formula is
- The Financing Approach is
One shortcoming with ROIC is that it is a non-GAAP metric meaning the input data plugged into the ROIC formula is inconsistent.
TRI has undergone a significant transformation between FY2020 and FY2025, and therefore, represents a significant transformation. The company evolved from a diversified holding company into a focused “Content-Led Technology” firm, which is reflected in the steady expansion of its ROIC.
TRI generally uses Adjusted ROIC (which it typically defines as Adjusted NOPAT divided by average invested capital).
The dramatic rise in ROIC from ~8.4% in 2020 to ~18.4% in 2025 is attributed to:
- The launch in 2021 of an initiative focused on eliminating departmental silos and automating internal workflows. Management reports that this which significantly boosted operating margins.
- The sale of shares in the London Stock Exchange Group (LSEG). This removed a large, non-operating asset from TRI’s balance sheet, effectively lowering the ‘Invested Capital’ denominator while redeploying cash into higher-margin AI businesses.
- The shift from one-time ‘Print’ or ‘Desktop’ sales to high-margin, recurring cloud subscriptions (SaaS) improved the quality and predictability of TRI’s arnings.
TRI’s WACC was at its lowest in FY2020 – FY2021 due to near-zero interest rates and TRI’s massive cash position following the Refinitiv deal.
The WACC increased in FY2022 – FY2025 as central banks raised rates. TRI’s WACC, however, remained lower than many peers because of its credit ratings (see below), which allowed it to issue debt at more favorable spreads.
In finance, value is created when ROIC exceeds WACC. In 2020, In FY2020, the spread between ROIC and WACC was sub 2%. By FY2025, the spread has widened to the upper single digit range (~8% – 9.9%). This suggests TRI’s successful pivot to GenAI-integrated professional tools.
Risk Assessment
Many investors fixate on the potential return of an investment but overlook potential risks.
The risk aspect of an investment differs for each and every investor as risk tolerance and circumstances differ for each and every investor. As a result, what I consider to be a ‘risky’ investment may satisfy another investor’s risk tolerance OR vice versa.
As part of my risk assessment process, I consider how the major credit rating agencies assess a company’s risk. Their risk ratings are assigned to a company’s debt, and therefore, I consider that my risk exposure is greater since I invest in a company’s equity. As a shareholder, I rank ‘dead last’ should a company’ fall off the rails’. It is for this reason that I almost always restrict my investments to companies with reasonably strong investment grade credit ratings.
As I compose this post, the following are TRI’s domestic unsecured long-term debt credit ratings:
- Moody’s: Baa1 raised from Baa2 on November 27, 2023. This is the top tier of the lower-medium investment grade category.
- Morningstar DBRS:BBB (high) confirmed on June 27, 2025 with a stable outlook. This is the top tier of the lower-medium investment grade category.
- S&P Global: A- raised from BBB+ on May 30, 2025 with a stable outlook. This is the bottom tier of the upper-medium investment grade category.
- Fitch: A- raised from BBB+ on September 26, 2025 with a stable outlook. This is the bottom tier of the upper-medium investment grade category.
The rating assigned by Moody’s and Morningstar DBRS define TRI as having an adequate capacity to meet its financial commitments. Adverse economic conditions or changing circumstances, however, are more likely to lead to TRI having a weakened capacity to meet its financial commitments.
The rating assigned by S&P Global and Fitch define TRI as having a strong capacity to meet its financial commitments. TRI, however, is somewhat more susceptible to the adverse effects of changes in circumstances and economic conditions than obligors in higher-rated categories.
These ratings reaffirm my observation that TRI’s credit risk is acceptable for my relatively conservative risk profile.
Dividends and Share Repurchases
Dividend and Share Consolidation
Details about TRI’s dividend are accessible here.
On February 5, 2026, TRI declared a USD$0.655/share dividend payable on March. This is an increase from $0.5950/share.
Declaration and distribution of the quarterly dividend is in USD. Shareholders, however, can elect to have dividends paid in Canadian dollars or British Pounds Sterling.
The dividend component of a TRI investment is of no relevance in my decision to invest in the company. Nevertheless, you may be interested to know that TRI temporarily suspended its Dividend Reinvestment Program (DRIP) in December 2018 and June 2023 in anticipation of a major transaction involving a return of capital and a share consolidation (reverse stock split).
The reason for the 2018 DRIP Suspension was to facilitate the Return of Capital transaction associated with the sale of a 55% interest in Refinitiv to a consortium led by Blackstone (BX). This generated substantial cash proceeds with a significant portion being returned to shareholders through a combination of a cash distribution and a share consolidation (reverse stock split). The DRIP needed to be suspended to properly execute the complex return of capital transaction and the share consolidation which fundamentally changed the number of outstanding shares and involved a special cash payment.
This transaction involved a USD $4.45 cash distribution and 1 pre-consolidated share for 0.9079 post-consolidated shares.
The reason for the 2023 DRIP Suspension was for the same reason as the 2018 suspension – another large Return of Capital transaction. This transaction involved a return of capital to shareholders funded by a portion of the proceeds from the sale of its interest in the London Stock Exchange Group (LSEG) shares which it received from the subsequent sale of Refinitiv to LSEG. As in 2018, this involved a cash distribution to shareholders along with a share consolidation (reverse stock split). Suspending the DRIP was necessary to manage the logistics of the cash distribution and the resulting share consolidation, ensuring all shareholders were treated correctly in the special transaction.
This transaction involved a USD $4.67 cash distribution and 1 pre-consolidated share for 0.963957 post-consolidated shares.
In both instances, TRI resumed the DRIP after the completion of the respective return of capital and share consolidation transactions.
Share Repurchases
We see from the table provided in the Operating Cash Flow (OCF), Free Cash Flow (FCF), and CAPEX section of this post the extent to which TRI has reduced the number of diluted shares outstanding since FY2010.
In August 2025, TRI announced its intention to repurchase up to $1B of its common shares under a new Normal Course Issuer Bid (NCIB) that was approved by the Toronto Stock Exchange (TSX); this is the term used in Canada for a common type of share repurchase program. The terminology in the US is ‘share repurchase program’ or ‘buyback program’.
In October, TRI completed the $1B share repurchase program announced in August and retired 6 million shares.
Although the weighted average diluted shares outstanding in FY2025 was 449.5 million, the weighted average in Q4 was 445.6 million.
The following is TRI’s CFO’s response to an analyst’s question on the Q4 2025 earnings call:
We agree with your comment and assessment that share repurchases are definitely attractive at the current levels, and we look forward to continuing our ongoing discussions with the Board in that regard. We plan to deliver on our commitment to return 75% of our free cash flow to investors in 2026. In order to achieve that 75%, we would need about $500 million of share repurchases to achieve this commitment, which is in addition to the dividends previously mentioned.
Valuation
Shares now trade at ~$88 as I compose this post on February 6, 2026.
In FY2025, TRI generated diluted EPS and adjusted diluted EPS from continuing operation of $3.33 and $3.92, respectively. Using the current share price, the diluted PE and adjusted diluted PE are ~26.3 and ~22.4.
Using this share price and the currently available adjusted diluted EPS broker estimates, TRI’s forward adjusted diluted PE levels are:
- FY2026 – 16 brokers – ~20 using a mean of $4.39 and low/high of $4.17 – $4.57.
- FY2027 – 14 brokers – ~17.6 using a mean of $5.01 and low/high of $4.70 – $5.26.
- FY2028 – 6 brokers – ~15.5 using a mean of $5.66 and low/high of $5.10 – $6.20.
I place very little reliance on broker estimates since much can happen to make these estimates irrelevant. Furthermore, the disparity in estimates implies the brokers which cover TRI have very different outlooks.
If TRI only manages to generate ~$4.17 in adjusted diluted EPS in FY2026, the forward adjusted diluted PE is ~21.1. This valuation is far more attractive than in recent years.
My preference, however, is to analyze a company’s valuation using FCF.
Conventional FCF Calculation
In FY2025, TRI generated $4.478 of FCF calculated using my conventional method of calculating FCF. Divide ~$88 by ~$4.478 and the P/FCF is ~19.7.
Modified FCF Calculation
In FY2025, TRI generated $4.095 of FCF calculated using my modified method of calculating FCF. Divide ~$88 by ~$4.095 and the P/FCF is ~21.5.
In my January 20, 2025 post I reflect the following:
Using my $122.72 purchase price and the currently available adjusted diluted EPS broker estimates, TRI’s forward adjusted diluted PE levels are:
- FY2025 – 16 brokers – ~31.5 using a mean of $3.90 and low/high of $3.77 – $4.00.
- FY2026 – 16 brokers – ~27.6 using a mean of $4.45 and low/high of $4.22 – $4.66.
- FY2027 – 12 brokers – ~24.4 using a mean of $5.03 and low/high of $4.70 – $5.42.
The forward adjusted diluted PE levels are slightly superior to when I initiated a position.
Conventional FCF Calculation
In the first 9 months of FY2025, TRI generated $3.141 of FCF calculated using my conventional method of calculating FCF (see December 15, 2025 post for calculations). If I extrapolate the YTD FCF for the first 9 months of the year, TRI should generate another $1.047 of FCF in Q4 2025 ($3.141/3 = $1.047). Adding $3.141 and $1.047 we get $4.188. Using a margin of safety, TRI could generate ~$4.10 of FCF for the year for a forward P/FCF of ~30 (based on my ~$122.72 purchase price).
Modified FCF Calculation
In the first 9 months of FY2025, TRI generated $2.855 of FCF calculated using my modified method of calculating FCF. If I extrapolate the YTD FCF for the first 9 months of the year, TRI should generate another $0.95 of FCF in Q4 2025 ($2.855/3 = $0.95). Adding $2.855 and $0.95 we get $3.805. Using a margin of safety, TRI could generate ~$3.75 of FCF for the year for a forward P/FCF is ~32.7 (based on my ~$122.72 purchase price).
In my prior post I reflect the following:
On December 15, 2025, I initiated a position @ $131.75. In the first 9 months of FY2025, it generated $2.59 diluted EPS and $2.85 adjusted diluted EPS. If it generates similar results in Q4 as in the first 3 quarters, TRI should generate an additional ~$0.86/share of diluted EPS and ~$0.95/share in adjusted diluted EPS. This would lead to ~$3.45 of diluted EPS and ~$3.80 of adjusted diluted EPS for FY2025.
Using my purchase price, the forward diluted PE and adjusted diluted PE estimates are ~38.2 and ~34.7.
My diluted EPS and adjusted diluted EPS estimates do not consider the repurchase of another 2.1 million common shares already made in Q4.
Using my purchase price and the currently available adjusted diluted EPS broker estimates, TRI’s forward adjusted diluted PE levels are:
- FY2025 – 16 brokers – ~33.8 using a mean of $3.90 and low/high of $3.77 – $4.00.
- FY2026 – 16 brokers – ~29.5 using a mean of $4.46 and low/high of $4.22 – $4.66.
- FY2027 – 12 brokers – ~26.2 using a mean of $5.03 and low/high of $4.70 – $5.42.
I place very little reliance on broker estimates as much can happen to make these estimates irrelevant. Furthermore, the disparity in estimates implies that the brokers which cover TRI have very different outlooks.
My preference is to analyze a company’s valuation using the free cash flow a company generates.
Conventional FCF Calculation
In the first 9 months of FY2025, TRI generated $3.141 of FCF calculated using my conventional method of calculating FCF. If I extrapolate the YTD FCF for the first 9 months of the year, TRI should generate another $1.047 of FCF in Q4 2025 ($3.141/3 = $1.047). Adding $3.141 and $1.047 we get $4.188. Using a margin of safety, TRI could generate ~$4.10 of FCF for the year for a forward P/FCF of ~32.1.
Modified FCF Calculation
In the first 9 months of FY2025, TRI generated $2.855 of FCF calculated using my modified method of calculating FCF. If I extrapolate the YTD FCF for the first 9 months of the year, TRI should generate another $0.95 of FCF in Q4 2025 ($2.855/3 = $0.95). Adding $2.855 and $0.95 we get $3.805. Using a margin of safety, TRI could generate ~$3.75 of FCF for the year for a forward P/FCF is ~35.1.
Final Thoughts
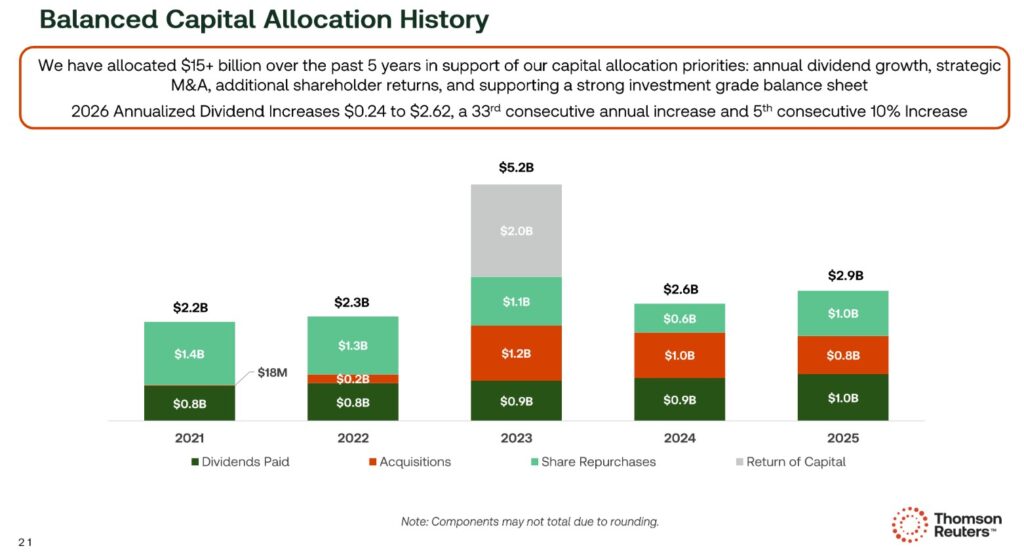
In FY2025, TRI returned slightly more than 100% of its FY2025 FCF through dividends and buybacks. This is ahead of the company’s 75% return commitment.
On the Q4 2025 earnings call, management states that TRI remains highly focused on strategic M&A. It, however, expects to again deliver to the 75% free cash flow return commitment in FY2026.
The AI disruption narrative has weighed on TRI and other companies in this sector since mid-July 2025 which is when TRI’s share price reached a 52-week high of US$218.42.
Anthropic’s Claude’s legal plug-in is the first direct push into legal technology by a major large language model provider. Claude’s legal plug-in targets in-house legal teams to aid with tasks like contract reviews, legal briefings, and templated responses. This broadens the disruption story previously driven by AI-native startups like Harvey.
The risk presented to TRI is lower growth as users are able to do more in-house rather than outsource to legal technology providers.
The plug-in, however, has nothing to do with legal research, which is TRI’s core value proposition and wide-moat foundation.
In my December 15, 2025 post I touch upon the importance of ‘following the money’. The Thomson family (Canada’s wealthiest) owns ~70% of TRI through their holding company (The Woodbridge Company Limited). They (and their senior management team members) undoubtedly make strategic decisions for the long-term benefit of the company.
TRI has been well aware of the disruption a product such as Claude may create (see January 2026 report from the Thomson Reuters Institute).
I think TRI’s ‘Big 3 segments’ clients are extremely aware of the Regulatory and Ethical Risks they face if they suddenly adopt an AI plug-in such as Claude. There are already instances where judges have admonished legal counsel that relied on AI plug-ins to prepare their ‘cases’. The risk of something like this happening with high profile cases is far too great. I think many of TRI’s clients value the quality of the information TRI’s platforms provide. TRI may lose some ‘low end clients’ but its major clients are unlikely to make any radical changes in the short-term.
I deem the current sell-off to be a ‘knee jerk’ reaction and consider this to be an opportunity to acquire shares at an attractive valuation.
I wish you much success on your journey to financial freedom!
Note: Please send any feedback, corrections, or questions to finfreejourney@gmail.com.
Disclosure: I am long TRI (the US listed shares).
Disclaimer: I do not know your circumstances and do not provide individualized advice or recommendations. I encourage you to make investment decisions by conducting your research and due diligence. Consult your financial advisor about your specific situation.
I wrote this article myself and it expresses my own opinions. I do not receive compensation for it and have no business relationship with any company mentioned in this article.