 My last Thermo Fisher (TMO) review was in this October 31, 2025 post at which time the most recent financial information was for Q3 and YTD2025. When I composed that post, shares were trading at ~$565 and I considered shares to be undervalued.
When I completed my 2025 Year-End Investment Holdings Review, TMO was my 11th largest holding with 358 shares in ‘Core’ accounts and 100 shares in a ‘Side’ account in the FFJ Portfolio. At the time of that year-end review, shares were trading at ~$579.50. As I compose this post on January 30, the share price is ~$577.50.
With the release of Q4 and FY2025 results on January 29, this is an opportune time to revisit this exiting holding.
Business Overview
TMO has multiple brands (eg. Thermo Scientific, PPD, Patheon, Applied Biosystems, etc). I encourage you to access the websites of these brands to see the magnitude of TMO’s product offering. I also recommend reviewing the company’s website and Part 1, Item 1 in the FY2024 Form 10-K.
It is arguably the premier life science supplier. Its portfolio of products, resources, and manufacturing capabilities is unmatched thus enabling it to increase its ‘share of wallet’ across all channels.
A large portion of TMO’s business mix is consumables and services (~82% of sales) much of which is recurring business.
TMO’s annual revenue has grown from ~$17B in FY2015 to ~$44.56B in FY2025. Organic growth and several acquisitions have fueled this impressive growth. The company’s more notable acquisitions in recent years are accessible here.
As I compose this post, this web page does not yet include TMO’s planned acquisition of Clario Holdings. Clario is a market leader in digital endpoint data solutions, one of the fastest-growing areas and an essential capability in drug development and clinical research. In 2025, the business generated ~$1.25B in revenue. I provide details of this impending acquisition in my October 31, 2025 post.
Financials
Q4 and FY2025 Results
The Q4 and FY2025 Earnings Materials are accessible here. In addition, I recommend reviewing the Q4 2025 GAAP/Non-GAAP Reconciliation & Financial Information.
TMO’s experienced ~3% organic growth in Q4 2025. Challenges in the academic and government end markets, however, continue with growth declining in low single digits in this segment. Demand, however, rebounded moderately across most other channels.
In pharma and biotech, TMO delivered high-single-digit growth, with strength in the bioproduction, research, and safety channel.
China continues to be a drag, down in the low single digits, as tariffs and trade uncertainties represent a demand challenge.
Cost-reduction efforts are partially mitigating the impact of tariffs and currency.
The operating margin came down modestly in Q4 2025, with cost-reduction efforts partially mitigating the impact of tariffs and currency.
Conventional And Modified Free Cash Flow (FCF) Calculations (FY2019 – FY2025)
FCF is a non-GAAP measure, and therefore, the manner in which it is calculated is inconsistent. Many investors deduct CAPEX from OCF to arrive at FCF. In my How Stock Based Compensation Distorts Free Cash Flow post, I explain why I now also deduct stock based compensation (SBC) that is found in the Consolidated Statements of Cash Flows to determine FCF.
The following table reflects TMO’s FCF without/with the deduction of SBC.

NOTE: The annual Net CAPEX figures deduct ‘proceeds from sale of property, plant and equipment’ from ‘purchases of property, plant and equipment’.
The FY2025 SBC is merely an estimate as the currently available Consolidated Statements of Cash Flows reflects ‘Other non-cash expenses, net’ of $0.765B at FYE2025. This figure includes SBC.
Since SBC at the end of Q3 2025 amounted to ~$0.226B, my FY2025 value of ~$0.325B is merely an estimate. The actual value may end up being closer to ~$0.3B. I prefer, however, to err on the side of caution. Furthermore, a ~$0.025B variance (~$0.325B – ~$0.3B) is relatively immaterial.
The table does NOT reflect the repurchase of $3B of shares (4.9 million shares) after FYE2025; the remaining repurchase authorization is $2B.
Return On Invested Capital (ROIC)
High quality companies often generate a high ROIC. If a company generates a high ROIC, it needs to invest less to achieve a certain growth rate thus reducing the need for external capital.
When a company consistently generates a high ROIC over the long term and it is growing its revenue, it can reinvest a portion of its profits under favorable conditions thereby leading to a compounding effect. I would much rather invest in a growing company that can reinvest to create greater shareholder value than to invest in a company that has limited growth opportunities and thus chooses to distribute a growing dividend.
TMO makes various adjustments (see schedule below) to arrive at its adjusted ROIC (%).
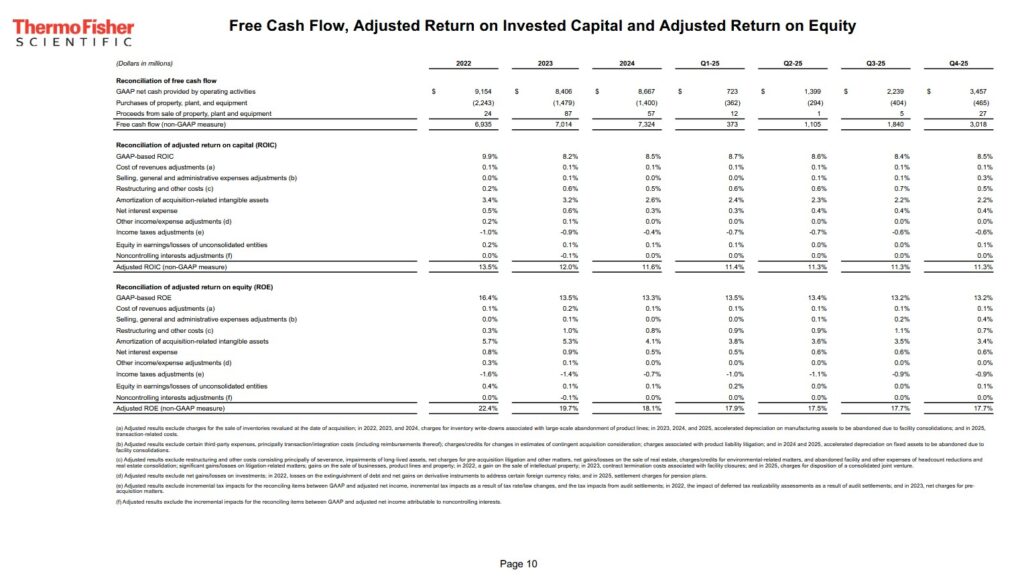
Looking at ROIC in isolation is pointless. We must compare a company’s ROIC relative to its Weighted Average Cost of Capital (WACC). It is important, however, to remember that ROIC and WACC metrics are non-GAAP metrics. In essence, these metrics depend on the input data used to compute them.
TMO’s WACC in FY2019 – FY2022 was in the ~4.70% – ~7.5% range. In FY2023, it rose to ~8.74% as its cost of debt rose following Federal Reserve rate hikes.
In FY2024, the WACC rose to ~9.24% given the higher interest rate environment and the additional debt related to the Olink acquisition.
TMO’s WACC is now closer to ~9% – ~10% in late 2025 and early FY2026.
The GAAP-based ROIC levels in recent years are below or comparable to TMO’s WACC. On an adjusted basis, however, TMO ROIC is marginally greater than its WACC.
FY2026 Guidance
The following is TMO’s FY2026 guidance.
Revenue of $46.3B – $47.2B which represents 4%-6% reported revenue growth over FY2025 and assumes 3%-4% organic growth for the year. The guidance assumes 3% – 4% organic revenue growth, a $0.3B revenue tailwind from foreign exchange, and 50 bps of adjusted operating margin expansion.
Adjusted diluted EPS guidance of $24.22 – $24.80 which represents 6%-8% growth.
The midpoint of TMO’s guidance assumes organic revenue growth of slightly above 3%.
Future acquisitions or divestitures are excluded from guidance, and therefore, does not include the benefit of the pending Clario acquisition which is expected to close mid-2026. If this deal closes as planned, TMO expects $0.20 – $0.25 of incremental adjusted EPS for FY2026. This would represent roughly 1 additional point of adjusted EPS growth for 2026, taking the total company growth into the ~7% – ~9% range.
Guidance includes ~$0.6B of inorganic revenue from the acquisitions closed in 2025. These acquisitions are progressing well versus TMO’s deal model expectations.
TMO expects ~$0.5B of net interest expense in 2026.
The FY2026 adjusted income tax rate forecast is ~11.5%.
Management expects ~$1.8B – $2B of net capital expenditures in 2026. The increase over 2025 is driven by TMO’s investment in U.S. manufacturing.
The FCF forecast is ~$6.8B – ~$7.3B.
On the capital deployment front, the assumption is for ~$3B of share buybacks. This was almost already completed in January 2026.
The full year average diluted share count forecast is 370 – 375 million shares.
TMO expects to return ~$0.7B to shareholders in the form of dividends in FY2026.
Risk Assessment
There are no changes to TMO’s domestic unsecured long-term debt ratings from the time of my prior review.
- Moody’s upgraded the rating to A2 from A3 on November 17, 2025.
- S&P Global continues to assign an A- rating with a stable outlook. Last reviewed June 24, 2025.
- Fitch continues to assign an A- rating with a stable outlook. Last reviewed September 30, 2025.
Moody’s rating is the middle tier of the upper-medium investment-grade tier while S&P’s and Fitch’s rating is the bottom tier of the upper-medium investment-grade tier. They define TMO as having a STRONG capacity to meet its financial commitments. TMO, however, is somewhat more susceptible to the adverse effects of changes in circumstances and economic conditions than obligors in higher-rated categories.
These ratings satisfy my conservative investment profile.
The following schedule reflects TMO’s net debt/adjusted trailing 12 month EBITDA ratio for FY2022 – FY2025.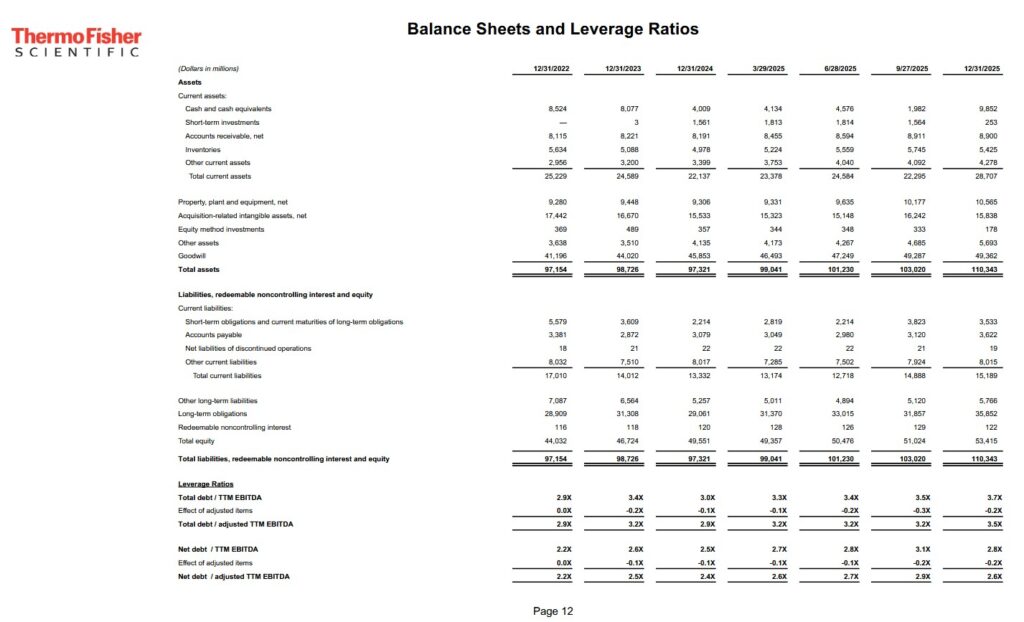
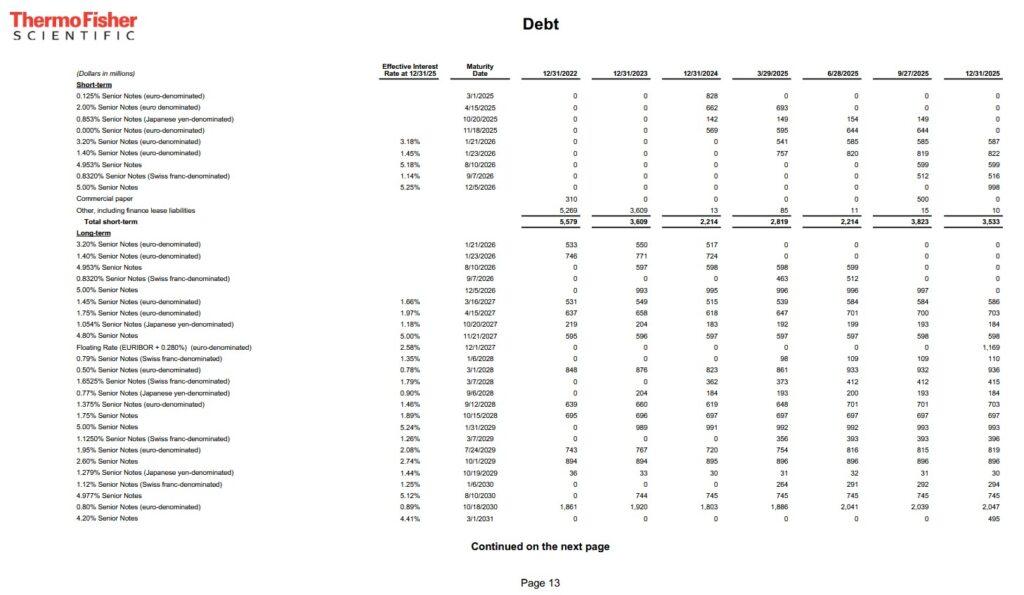
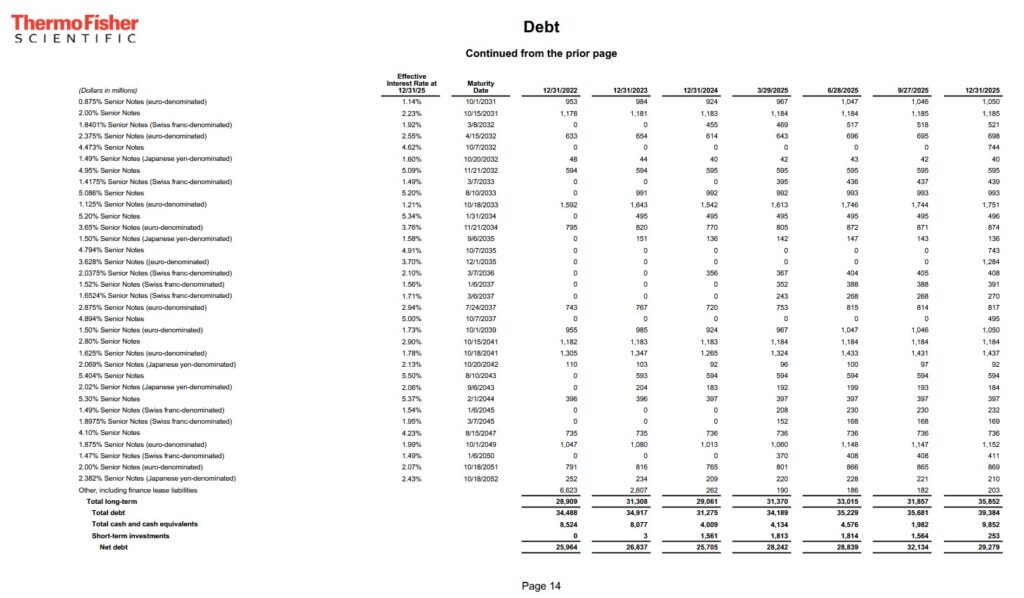
The following is TMO’s current debt maturity schedule.
Dividend and Dividend Yield
TMO’s dividend history is accessible here.
Past performance is not necessarily indicative of future performance. Dividends, however, are a low capital allocation priority. This is unlikely to change in the foreseeable future.
When considering TMO as a potential investment, disregard the dividend metrics.
The following table reflects TMO’s share buybacks in FY2022 – FY2025.
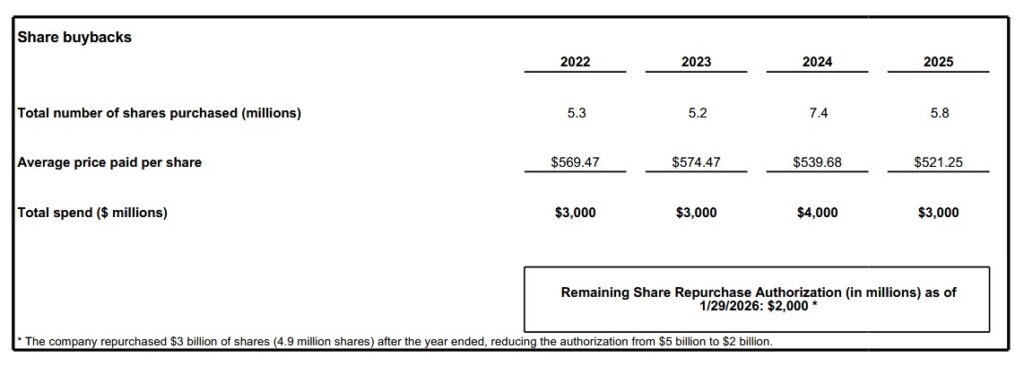
A company incurs an excise tax from share repurchases. I, however, prefer share repurchases over dividend income. This is because I must declare dividend income from holdings within taxable accounts. Furthermore, as a Canadian resident I incur a 15% dividend withholding tax on dividends from US companies on all shares held in taxable accounts.
Until such time as I sell shares, I need not report any share price appreciation on my personal tax return.
I purchased shares on:
- April 17, 2025 @ $431.0333
- April 24, 2025 @ $421.3724
- July 7, 2025 @ $431.0333
I also rely on management being able to appropriately increase my total shareholder return. This includes repurchasing shares at attractive valuations when optimal. The ~$3B of share purchases @ ~$0.330B in January 2026 above ~$600/share striles me as the wrong time to have repurchased shares.
The weighted average diluted shares outstanding in FY2013 (in millions) was 366. TMO, however, issues equity to assist in the funding of some of its acquisitions. This explains why 377 million shares are outstanding in FY2025 despite a considerable level of share repurchases in recent years.
Stock Splits
TMO had three 3 for 2 stock splits in the 1990s (1993, 1995, and 1996).
Valuation
We can not rely entirely on PE and adjusted PE ratios to gauge a company’s valuation. These metrics should merely form part of our assessment.
As I compose this post on January 30, 2026 the share price is ~$577.50 Using this share price and management’s FY2026 $24.22 – $24.80 adjusted diluted EPS guidance, the forward adjusted diluted PE range of ~23.3 – ~23.8.
Using the currently available broker estimates, TMO’s forward-adjusted diluted PE levels are:
- FY2026 – 25 brokers – a forward-adjusted diluted PE of ~23.5 using a mean of $24.56 and low/high of $24.00 – $25.00.
- FY2027 – 23 brokers – a forward-adjusted diluted PE of ~21.4 using a mean of $26.95 and low/high of $26.37 – $27.65.
- FY2028 – 11 brokers – a forward-adjusted diluted PE of ~19.4 using a mean of $29.78 and low/high of $28.85 – $31.00.
Management’s FY2026 FCF outlook is ~$6.8B – ~$7.3B. If FY2026 SBC is ~$0.335B, the modified FCF outlook for FY2026 is ~$0.6465B – ~$6.965B.
The FY2026 full year average diluted share count forecast is 370 – 375 million shares.
Using the 372.5 million shares mid-point the FY2026 FCF/share should be:
- ~$6.965B/372.5 million = ~$18.70
- ~$6.465B/372.5 million = ~$17.36
With shares trading at ~$577.50 the forward P/FCF range is ~30.9 – ~33.3.
In my October 31, 2025 post I wrote:
In the first 3 quarters of FY2025, TMO generated $12.53 and $16.30 of diluted EPS and adjusted diluted EPS. The revised FY2025 adjusted EPS is $22.60 – $22.86. The new $22.73 midpoint implies TMO needs to generate ~$6.43 of adjusted diluted EPS in Q4. This is well in excess of the $5.15, $5.36, and $5.79 it generated in Q1 – Q3 2025.
Management provides no GAAP guidance. I, therefore, continue to estimate that FY2025 diluted EPS will be ~$17.
Using the current ~$565 share price, I estimate a diluted PE of ~33.2 ($565/$17). On an adjusted basis we get ~24.7 – ~25 when using management’s revised adjusted EPS guidance of $22.60 – $22.86.
Using the currently available broker estimates, TMO’s forward-adjusted diluted PE levels are:
- FY2025 – 22 brokers – a forward-adjusted diluted PE of ~24.9 using a mean of $22.73 and low/high of $22.51 – $22.81.
- FY2026 – 22 brokers – a forward-adjusted diluted PE of ~23 using a mean of $24.67 and low/high of $24.00 – $25.87.
- FY2027 – 17 brokers – a forward-adjusted diluted PE of ~21 using a mean of $26.93 and low/high of $26.05 – $28.41.
- FY2028 – 6 brokers – a forward-adjusted diluted PE of ~18.5 using a mean of $30.49 and low/high of $29.39 – $32.31.
Management’s FY2025 FCF outlook is $7B. YTD2025 SBC is ~$0.226B so I will continue to estimate $0.3B for FY2025 SBC. This lowers TMO’s FY2025 FCF to ~$6.7B using the modified method of determining FCF.
The diluted share count is now expected to be ~378 million shares.
Dividing ~$7B by ~378 million of diluted shares outstanding leads to ~$18.52 of FCF using the conventional calculation method.
Dividing ~$6.7B by ~378 million of diluted shares outstanding leads to ~$17.72 of FCF using the modified calculation method.
With shares trading at ~$565, TMO’s P/FCF is ~30.5 and ~31.9 calculated using the conventional and modified calculation methods.
In my July 24, 2025 post, I estimated TMO’s valuation as follows:
In the first half of FY2025, TMO generated $8.26 and $10.51 of diluted EPS and adjusted diluted EPS. Management has revised its FY2025 adjusted EPS to $22.22 – $22.84, a $0.23 increase at the midpoint; the new midpoint is $22.53 meaning expectations are for TMO to generate ~$12.02 adjusted diluted EPS in the second half.
Management provides no GAAP guidance, and therefore, I am conservatively estimating that FY2025 diluted EPS will be ~$17. This is slightly above double the first half’s diluted EPS. My estimate assumes TMO will repurchase no shares in the second half thus leading to a marginal increase in diluted shares outstanding because of shares issued as part of the company’s SBC programs.
Using the current ~$475 share price, I estimate a diluted PE of ~28 ($475/$17). On an adjusted basis we get ~20.8 – ~21.4 when using management’s revised adjusted EPS guidance.
Using the currently available broker estimates, TMO’s forward-adjusted diluted PE levels are:
- FY2025 – 28 brokers – a forward-adjusted diluted PE of ~21.1 using a mean of $22.46 and low/high of $21.99 – $22.70.
- FY2026 – 29 brokers – a forward-adjusted diluted PE of ~19.4 using a mean of $24.44 and low/high of $23.50 – $25.87.
- FY2027 – 21 brokers – a forward-adjusted diluted PE of ~17.6 using a mean of $27.05 and low/high of $25.68 – $28.42.
- FY2028 – 7 brokers – a forward-adjusted diluted PE of ~15.8 using a mean of $30.15 and low/high of $29.22 – $31.78.
I envision adjustments to these estimates over the coming days.
As noted earlier, management’s FY2025 FCF outlook is $7B – $7.4B. I assume SBC will be ~$0.3B since management provides no outlook on this line item. Deduct ~$0.3B from ~$7.2B (the midpoint of management’s guidance) and TMO’s FY2025 FCF should be ~$6.9B calculated using the modified method where we deduct SBC to determine FCF.
Divide ~$7.2B by ~379 million of diluted shares outstanding and we get ~$19 of FCF using the conventional calculation method.
Divide ~$6.9B by ~379 million of diluted shares outstanding and we get ~$18.2 of FCF using the modified calculation method.
With shares trading at ~$475, TMO’s P/FCF is ~25 and ~26.1 calculated using the conventional and modified calculation methods.
Final Thoughts
TMO’s adjusted operating margin in Q4 2025 was 23.6%, down from 23.9% in Q4 2024the year prior. Tariffs, FX volatility and demand from China are driving this margin weakness. This explains why TMO’s results exceeded guidance but the share price has not improved.
I currently hold 300.17433 shares at an average cost of $482.3913. When I completed my 2025 Year-End Investment Holdings Review, TMO was my 11th largest holding. The share price at the time was ~$579.45 and as I compose this post on January 30, 2026 it is ~$577.50.
I consider ~$595 to be a fair price, and therefore, consider shares to be currently slightly undervalued. Nevertheless, I am not immediately adding to my TMO exposure since I think market conditions are ripe for further broad market pullbacks. Should such occur, I anticipate TMO’s share price will be caught in the ‘downdraft’.
I wish you much success on your journey to financial freedom!
Note: Please send any feedback, corrections, or questions to finfreejourney@gmail.com.
Disclosure: I am long TMO.
Disclaimer: I do not know your circumstances and do not provide individualized advice or recommendations. I encourage you to make investment decisions by conducting your research and due diligence. Consult your financial advisor about your specific situation.
I wrote this article myself and it expresses my own opinions. I do not receive compensation for it and have no business relationship with any company mentioned in this article.