![]()
I last reviewed Rollins (ROL) in this November 2, 2025 post at which time the most current financial information was for Q3 and YTD2025. This is an opportune time to revisit this existing holding given the release of Q4 and FY2025 results following the February 11, 2026 market close.
Business Overview
The best way to learn about the company, is to review its website and Item 1 and 1-A in Part 1 in ROL’s FY2024 Form 10-K.
Financials
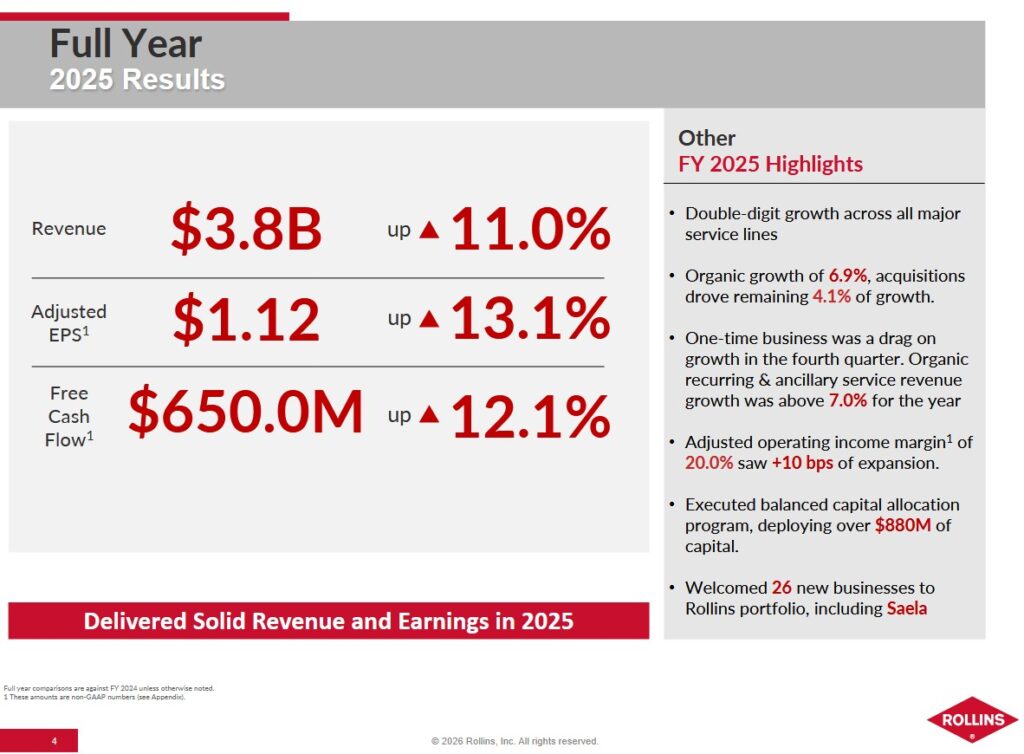
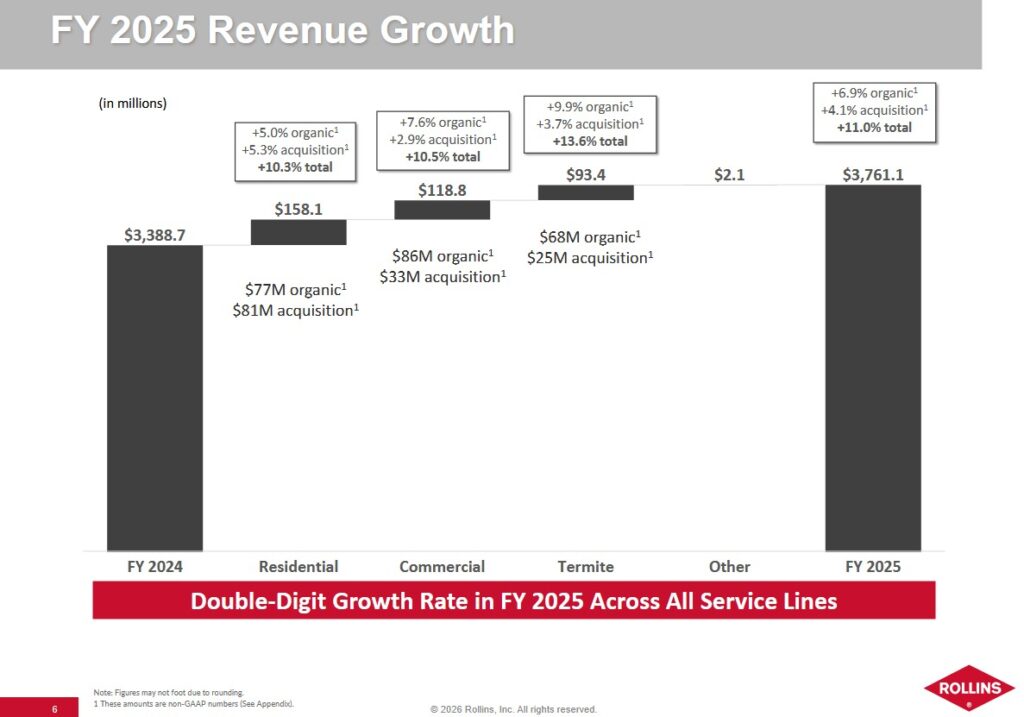
Q4 and FY2025 Results
Material related to ROL’s Q4 and FY2025 results is accessible here.
At FYE2025, ROL’s total current assets were ~$472.682 million and its total current liabilities were ~$785.525 million. Of the total current assets, ~$42.982 million were materials and supplies.
Dividing total current assets by total current liabilities leads to a ~0.602 current ratio. Subtract materials and supplies from total current assets and then divide this amount by total current liabilities. This gives us a 0.547 quick ratio which is what stock screeners will reflect. These ratios suggest ROL could experience short-term cash flow issues.
Within the company’s current liabilities at FYE2025, however, there is $187.67 million of unearned revenue reflected as a current liability. This unearned revenue represents funds received in advance from clients before ROL renders its services. As ROL renders services, it makes adjusting entries that include a reduction in unearned revenue.
When analyzing ROL’s liquidity, I exclude the unearned revenue to determine its current and quick ratios. In doing so, ROL’s current liabilities change to ~$597.86 million. This leads to the current ratio being ~0.79 and the quick ratio being ~0.72 ((~$472.682 – ~$42.982)/~$597.86).
Operating Cash Flow (OCF), Free Cash Flow (FCF), and CAPEX (FY2021 – FY2025)
FCF is a non-GAAP metric, and therefore, there is no standardization in it calculation. In the vast majority of instances where companies calculate FCF, there is no deduction of share based compensation (SBC). While I calculate a company’s FCF using the ‘conventional’ method where there is no SBC is deduction, I deem it prudent to calculate FCF using a ‘modified’ method. Under the ‘modified’ method, I deduct SBC. The deduction of SBC might not have a material impact on the FCF calculations where SBC is a relatively insignificant component of employee compensation. Where SBC is a significant component of employee compensation, however, the variance in the FCF results calculated using both methods can be very significant!
The following table reflects ROL’s FCF using the conventional method and the modified methods.
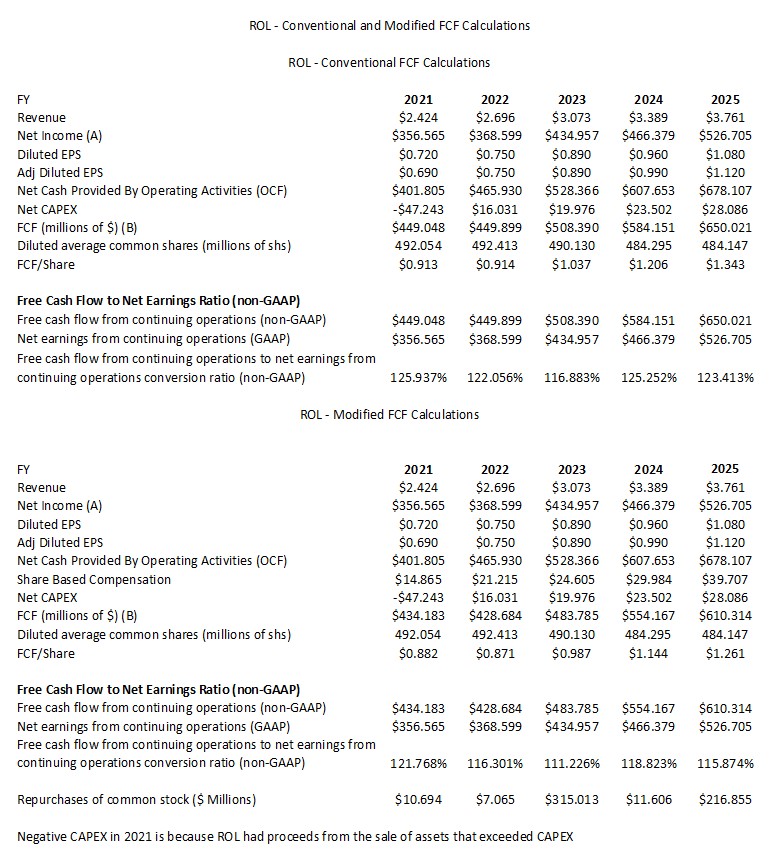
My FCF calculation using the conventional method differs slightly from that calculated by ROL. The difference is that I use Net CAPEX where I include the ‘Proceeds from sale of assets’. The currently available financial results does not reflect ‘Proceeds from sale of assets’ but at the end of Q3 2025, this only amounted to $5.886 million. Historically, ROL’s ‘Proceeds from sale of assets’ is so insignificant that it is a line item in the Consolidated Statement of Cash Flows that has no influence in my investment decision making process.
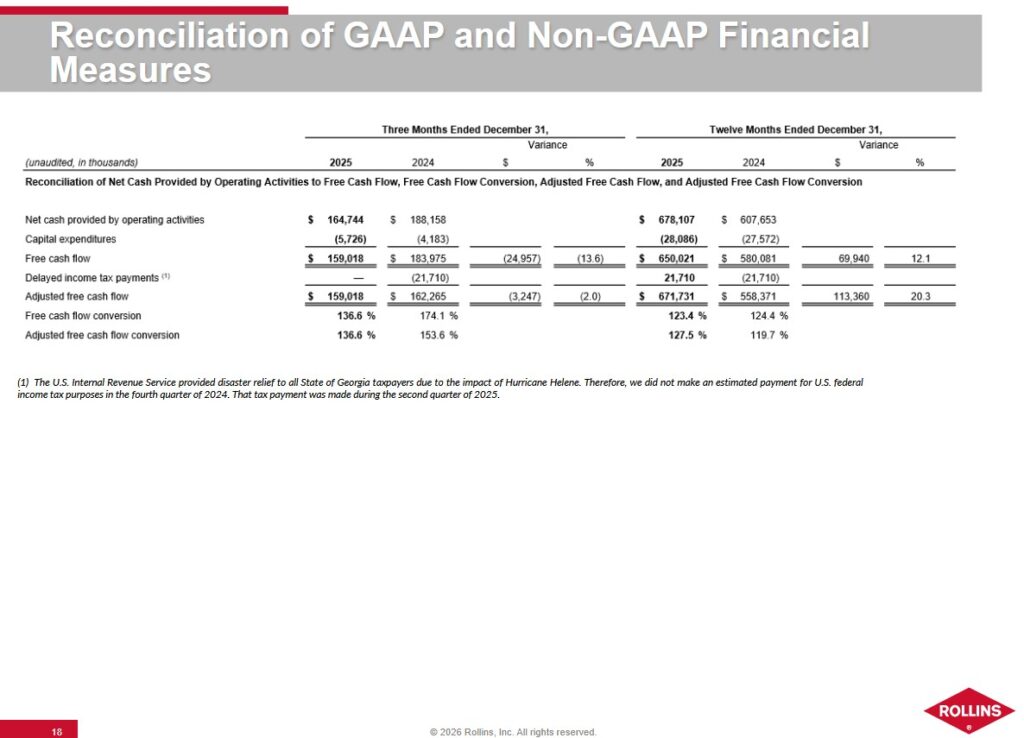
ROL also makes an adjustment to its FY2024 and FY2025 FCF calculations (see above). The amount in question is not that significant and the delayed tax payment adjustments are for an identical amount in FY2024 and FY2025. I choose to disregard this adjustment thus the reason for the variance between the company’s FCF figures and my figures.
Tariffs
ROL does not see a major issue with tariffs. ROL’s cost structure is primarily ‘people’. ‘Fleet and material’ (both being ~3% of sales) is the second biggest component of ROL’s cost structure where tariffs are not that much of an issue. Most of the materials ROL procures are made in the US. It is not reliant upon other geographic regions for its chemical requirements.
Capital Allocation
ROL’s capital allocation priorities are to:
- reinvest in the business;
- grow the dividend; and
- repurchase shares.
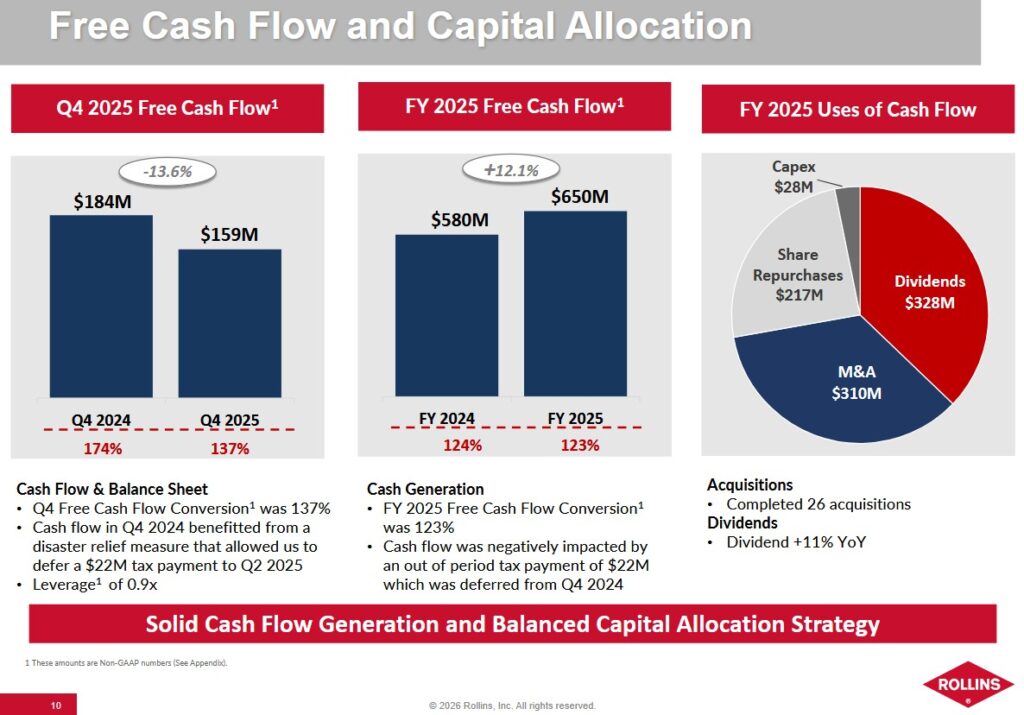
ROL’s capital allocation is highly efficient. It maintains a low debt profile (Adjusted Leverage of ~0.9x EBITDAR), thus leaving it with ‘dry powder’ to remain an aggressive buyer during economic downturns when smaller competitors struggle.
ROL’s capital allocation strategy in recent years is defined by its ability to fund growth through high free cash flow (FCF). Under new management, ROL has begun to strategically use debt to fund growth. Despite the increased use of debt, the company continues to prioritize operational excellence and high-return reinvestment over aggressive, debt-fueled expansion.
M&A is the company’s top priority for excess cash. It operates in a highly fragmented market (over 33,000 pest control companies in the US) and focuses on ‘tuck-in’ acquisitions that are immediately accretive. It has, however, completed larger acquisitions in the last couple of years (Fox Pest Control and Saela Holdings).
Despite being highly acquisitive, ROL is very disciplined and does not overpay for acquisitions nor does it waste capital on low-return projects.
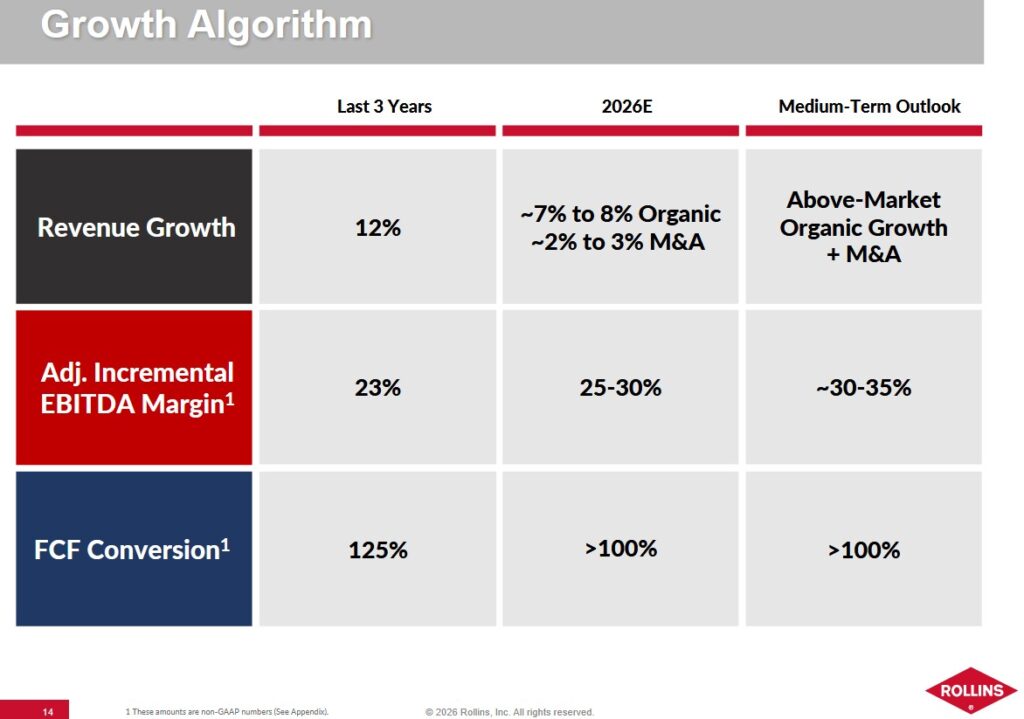
ROL’s acquisitions typically contribute 2% – 3% to annual revenue growth, acting as a multiplier to the firm’s 7% – 8% organic growth target.
It has increased its dividend for many consecutive years. When I initiated a position on June 10, 2021, ROL’s dividend policy included the distribution of an annual variable dividend. It, however, effectively terminated its practice of issuing an annual special (variable) year-end dividend in 2022. This is because new senior management has shifted its capital allocation strategy. The current policy is to aggressively hike the regular quarterly dividend to absorb excess cash into predictable recurring payments.
In FY2023 and FY2025, ROL ramped up share repurchases but these are secondary to M&A and dividend distributions. The purpose of the repurchases is to offset dilution from employee stock programs or to opportunistically retire shares.
ROL is a relatively capital light business with annual CAPEX typically being under 1% of annual revenue.
In the last couple of years, ROL has made significant investments in its BOSS (Branch Operating Support System) and proprietary routing technology to improve ‘technician density’. This technology essentially ensures service technicians spend less time driving and more time at customer sites.
ROL has also transitioned its fleet of service vehicles to more fuel-efficient and technologically equipped service vehicles.
FY2026 Guidance
The quality of ROL’s financial reporting has improved dramatically following changes at senior management levels. It now provides guidance but does not provide diluted EPS or adjusted diluted EPS guidance.
ROIC and WACC
Return on Invested Capital (ROIC) provides an indication of a company’s efficiency. In essence, is a company actually creating value or ‘burning’ cash for the sake of growth?
A company with a higher ROIC is mathematically worth more because it requires less reinvestment to achieve that growth.
A good indication of how well a company is performing is to compare ROIC to the Weighted Average Cost of Capital (WACC). WACC, however, is not a metric officially reported by ROL but it can be roughly estimated based on the company’s credit profile and market conditions.
The generally accepted high-level formula used by Wall Street is:
ROIC = NOPAT/Average Invested Capital
with the Net Operating Profit After Tax (NOPAT) formula being Operating Income (EBIT) x (1-tax rate)
This shows how much profit the core business makes while ignoring how much debt the company has.
The Average Invested Capital is the total money tied up in the business.
- The Operating Approach formula is
- The Financing Approach is
One shortcoming with ROIC is that it is a non-GAAP metric meaning the input data plugged into the ROIC formula is inconsistent.
A good indication of how well a company is performing is to compare ROIC to the Weighted Average Cost of Capital (WACC). WACC, however, is not a metric officially reported by BDX but it can be roughly estimated based on the company’s credit profile and market conditions.
The generally accepted high-level formula used by Wall Street is:
ROIC = NOPAT/Average Invested Capital
with the Net Operating Profit After Tax (NOPAT) formula being Operating Income (EBIT) x (1-tax rate)
This shows how much profit the core business makes while ignoring how much debt the company has.
ROL consistently maintains a high ROIC that significantly exceeds its WACC, indicating strong value creation for shareholders.
Its ROIC in FY201 – FY2025 is in the low 20% range while its WACC is typically in the high single digits. This indicates ROL is creating shareholder value.
With a positive ROIC and WACC variance (excess return) it is understandable why ROL generally has a premium stock valuation
Risk Assessment
ROL has ~$0.486B of long-term debt with a negligible variance from the end of Q3 2025. Note 7 – Debt in the Q3 2025 Form 10-Q reflects details of the senior notes that mature in 2035. The effective interest rate was 5.6% as of September 30, 2025.
There are no changes to ROL’s credit ratings subsequent to my February 14, 2025 post.
- Fitch: BBB+ long term issuer default rating. Initiated on February 13, 2025 and affirmed on December 4, 2025
- S&P Global: BBB local currency long term debt credit rating. Initiated on February 13, 2025.
Fitch’s rating is the top tier of the lower-medium grade investment grade category. S&P assigns a rating that is one tier lower. Both ratings define ROL as having an adequate capacity to meet its financial commitments. Adverse economic conditions or changing circumstances, however, are more likely to lead to a weakened capacity for ROL to meet its financial commitments.
Management is committed to maintaining a strong investment-grade rating with leverage well under 2x supported by healthy cash flow generation and disciplined capital allocation.
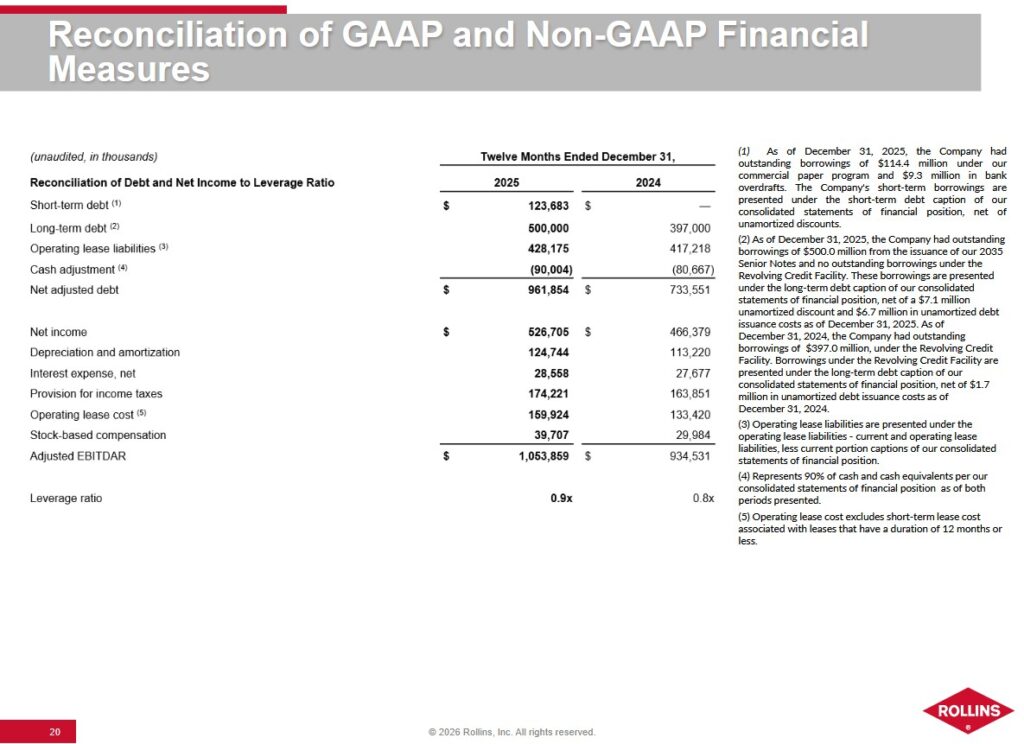
ROL’s leverage ratio is an assessment of overall liquidity, financial flexibility, and leverage. The calculation involves dividing adjusted net debt by adjusted EBITDAR (a non-GAAP metric).
- Adjusted net debt is calculated by adding operating lease liabilities to total long-term debt less a cash adjustment of 90% of cash and cash equivalents.
- Adjusted EBITDAR is calculated by adding back to net income depreciation and amortization, interest expense, net, provision for income taxes, operating lease cost, and stock-based compensation expense.
NOTE: Adjusted EBITDAR is Earnings Before Interest, Taxes, Depreciation, Amortization, and Restructuring or Rent costs. It is calculated by adding back to net income depreciation and amortization, interest expense, net, provision for income taxes, operating lease cost, and stock-based compensation expense. ROL’s management uses this ratio as an assessment of overall liquidity, financial flexibility, and leverage.
Dividends, Share Repurchases, and Stock Splits
Dividend and Dividend Yield
ROL’s Board declared a regular quarterly cash dividend on its common stock of $0.1825/share payable March 10, 2026 to shareholders of record at the close of business on February 25, 2026.
Focusing on dividend metrics is a fundamentally flawed way by which to assess a potential investment. It is preferable that we analyze an investment from potential total return (capital gains and dividends) and risk perspectives.
Share Repurchases
At FYE2016 there were 490.031 million shares outstanding.
In FY2025, ROL repurchased $216.855 million of its shares.
The diluted weighted average shares outstanding in FY2025 and Q4 2025 was 484.147 million and 482.781 million, respectively.
Reinvesting in the company (including mergers and acquisitions) and dividend distributions rank in priority to share repurchases from a capital allocation perspective.
Stock Splits
The 3-for-2 stock split in late 2020 is the most recent.
Valuation
The high amortization expense related to multiple acquisitions makes it impractical to value ROL using Earnings per Share (EPS). Depreciation and Amortization are significant components of the ‘Adjustments to reconcile net income to net cash provided by operating activities’ in the Consolidated Statement of Cash Flows. This is why I like to look at ROL’s valuation using the FCF its generates. Nevertheless, I do look at its valuation from a forward adjusted diluted EPS perspective.
In FY2025, ROL generated $1.09 and $1.12 of diluted EPS and adjusted diluted EPS, respectively. Using the February 12, 2026 $58.69 closing share price, ROL’s valuation based on historical earnings is ~53.8 and ~52.4 on an adjusted basis.
ROL’s current forward adjusted diluted PE levels using the same share price and the current adjusted diluted EPS broker estimates are:
- FY2026 – 16 brokers – mean of $1.26 and low/high of $1.19 – $1.31. Using the mean, the forward adjusted diluted PE is ~46.6.
- FY2027 – 13 brokers – mean of $1.41 and low/high of $1.32 – $1.49. Using the mean, the forward adjusted diluted PE is ~41.6.
- FY2028 – 10 brokers – mean of $1.57 and low/high of $1.46 – $1.69. Using the mean, the forward adjusted diluted PE is ~37.4.
ROL’s FCF conversion ratio in FY2021 – FY2025 is 121.768%, 116.301%, 111.226%, 118.823%, and 115.874%. Management also anticipates a FCF conversion ratio exceeding 100% over the medium term.
I prefer to err on the side of caution, and therefore, estimate ROL’s FCF conversion ratio in Fy2026 will be 114%. The FY2026 mean value of brokers’ forward adjusted diluted EPS is ~$1.26. Multiply this by 114% and we get ~$1.44. Divide ~$58.69 by ~$1.44 and we get a forward P/FCF of ~40.8.
A fair value appears to be closer to the low $50s. At ~$51, for example, the P/FCF ($51/$1.44) is ~35.4.
NOTE: ROL is a high-quality business, and therefore, its valuation is rarely ‘attractive’. Investors, however, typically do not invest in ROL for a bargain. A ROL investment is generally made for the certainty of its long-term compounding.
In my November 2, 2025 post I estimate ROL’s valuation as follows:
In the first 3 quarters of FY2025, ROL generated $0.85 and $0.87 of diluted EPS and adjusted diluted EPS, respectively. If it produces ~$0.29 of adjusted diluted EPS in Q4 2025 (33.33% of YTD2025 adjusted diluted EPS), we should expect FY2025 adjusted diluted EPS to approach ~$1.16. Using the current ~$57.61 share price, the forward adjusted diluted PE is ~50.
Using the same share price and the current adjusted diluted EPS broker estimates, ROL’s current forward adjusted diluted PE levels are:
- FY2025 – 13 brokers – mean of $1.13 and low/high of $1.07 – $1.15. Using the mean, the forward adjusted diluted PE is ~51.
- FY2026 – 13 brokers – mean of $1.26 and low/high of $1.20 – $1.31. Using the mean, the forward adjusted diluted PE is ~45.7.
- FY2027 – 9 brokers – mean of $1.40 and low/high of $1.35 – $1.45. Using the mean, the forward adjusted diluted PE is ~41.15.
ROL’s FCF typically exceeds EPS and this is likely to continue.
The mean current adjusted diluted EPS broker estimate for FY2025 is ~$1.13; the variance between diluted EPS and adjusted diluted EPS is historically slim. If we use a ~1.14 FCF/EPS conversion ratio, ROL’s FY2025 FCF/share could be ~$1.29 ($1.13 x 1.14).
Divide $57.61 by $1.29 and the forward P/FCF is ~44.7. I continue to think a fair value is closer to the low $40s. At ~$43, the P/FCF ($43/$1.29) is ~33.3.
For comparison, my assessment of ROL’s valuation in my June 27, 2025 post was:
The following are ROL’s current forward adjusted diluted PE levels using the current adjusted diluted EPS broker estimates and the current ~$55.81 share price:
- FY2025 – 12 brokers – mean of $1.11 and low/high of $1.06 – $1.14. Using the mean, the forward adjusted diluted PE is ~50.3.
- FY2026 – 12 brokers – mean of $1.25 and low/high of $1.16 – $1.30. Using the mean, the forward adjusted diluted PE is ~44.6.
- FY2027 – 9 brokers – mean of $1.39 and low/high of $1.27 – $1.47. Using the mean, the forward adjusted diluted PE is ~40.2.
My comments regarding ROL’s FCF consistently exceeding EPS remain the same. ROL reported a FCF conversion ratio of 133.1% in Q1 2025 (FCF of $140.111 million versus $105.248 million of net income). If we deduct SBC of $8.799 million, ROL’s Q1 FCF drops to $131.312. This is a ~124.76% FCF conversion ratio.
I previously estimated ROL’s FY2025 FCF conversion ratio may be ~111% when using the modified FCF calculation method. If the remaining 3 quarters in FY2025 are comparable to Q1, it is conceivable that the FCF conversion ratio could be closer to 120%. If this materializes, ROL’s FY2025 FCF/share could be ~$1.33 ($1.11 x 1.20) versus my previous ~$1.23 estimate.
Divide the current ~$55.81 share price by $1.33 and the forward P/FCF is ~42. This level is somewhat greater than my prior estimate. I think a fair value is closer to the low $40s. At ~$43, for example, the P/FCF ($43/$1.33) is ~32.3.
Final Thoughts
ROL shares the same DNA as the ‘picks and shovels’ merchants I touch upon in my West Pharmaceutical – The Silent Winner Of The Obesity Drug Boom post because it provides an essential, non-discretionary service people must pay for regardless of the economy.
It has had a recurring revenue model for decades with ~80% of its revenue recurring. Pest control requires ongoing maintenance. Termites and rodents do not stop breeding during a recession. Because pests are a threat to health and property, customers view ROL’s services as a ‘must-have’. In addition, pest control cannot be replaced by artificial intelligence nor can these ‘hands on’ services be outsourced to a country with cheaper labor.
As noted earlier, ROL operates in a highly fragmented industry where there are over 20,000 small, local pest control businesses just in the US. Because ROL is profitable and generates strong FCF, it has the ability to acquire smaller industry operators. In FY2021 – FY2025, ROL has acquired more than 150 companies. When ROL buys a small competitor, it immediately plugs it into its proprietary routing software and global supply chain thereby instantly making the acquired business more profitable. ROL shares some similarities with Cintas Corporation (CTAS) in that acquisitions permit it to roll up newly acquired customers into existing routes thus increasing route density. If an existing route consists of 75 clients, for example, the benefits of adding another 5-10 clients to the route typically outweigh any additional costs.
ROL frequently buys back its own successful franchises. This is highly profitable because it already knows the business operations and the local market intimately.
While heavily focused on the US market, ROL has been expanding internationally thus diversifying its customer base.
The barriers to entry in this industry may appear to be low in that anyone with a spray tank can compete. In pest control, however, you let a stranger into your home or food-processing plant. The Orkin brand carries a level of trust that a local startup may not be able to easily replicate.
Modern pest control also requires handling specialized chemicals and navigating complex environmental regulations. ROL’s Learning Center provides a scale of expertise that smaller rivals are unable to afford.
Interestingly, ROL has historically been able to raise prices above the rate of inflation without losing customers.
ROL essentially combines leading brand recognition, scale advantages, and efficient cost-control initiatives. Looking at management’s growth algorithm (see above) I anticipate ROL will continue to deliver medium-term revenue growth.
As noted in my prior post, it is difficult to overlook the following:
- The pest control business is relatively steady;
- ROL focuses heavily on efficiency and cost control;
- The FCF conversion ratio is consistently above 100%;
- Management quality has improved considerably and the level of financial reporting continues to improve;
- Capital allocation is superior under new management;
- Investment-grade corporate credit ratings now provide ROL with an important access point to the capital markets; and
- 75+% of business is recurring.
ROL was not a top 30 holding when I completed my 2025 Mid-Year Portfolio Review and 2025 Year-End Investment Holdings Review. While it may be a wonderful company, it is unlikely to ever become a top 30 holding. I will merely increase my exposure through the automatic reinvestment of dividend income.
I wish you much success on your journey to financial freedom!
Note: Please send any feedback, corrections, or questions to finfreejourney@gmail.com.
Disclosure: I am long ROL.
Disclaimer: I do not know your circumstances and do not provide individualized advice or recommendations. I encourage you to make investment decisions by conducting your research and due diligence. Consult your financial advisor about your specific situation.
I wrote this article myself and it expresses my own opinions. I do not receive compensation for it and have no business relationship with any company mentioned in this article.
[…] Mike at The Dividend Guy Blog8 High Yields Of Quality And Value To Buy by RoseNose at Seeking AlphaRollins – Capital Efficiency Makes It A Compounding Machine by Charles Fournier at Financial Freedom Is A […]