![]()
In my December 3, 2025 post, I state my preference to invest in wide moat, profitable, and undervalued/fairly valued growing companies that generate strong earnings and free cash flow. Companies with no debt (or exceptionally low debt levels) are particularly attractive.
Such investment opportunities sometimes present themselves when great companies fall temporarily out of favor with the investment community. Thomson Reuters Corporation (TRI) is currently such a company.
Before entertaining an investment in TRI, consider that the majority shareholder of Thomson Reuters is The Woodbridge Company Limited. This is a Canadian private holding company that serves as the primary investment vehicle for the Thomson family of Canada.
Woodbridge and its affiliates beneficially own ~70% of TRI’s common shares. For so long as Woodbridge maintains its controlling interest in TRI company, it will generally be able to approve matters submitted to a majority vote of its shareholders without the consent of other shareholders, including, among other things, the election of TRI’s Board.
Many Canadians are likely familiar with the Thompson family. It consistently ranks as one of the wealthiest, if not the wealthiest, families in the country. Their wealth, primarily held through The Woodbridge Company Limited, has placed them at the top of many Canadian rich lists for decades.
The Forbes ‘World’s Billionaires List – The Richest In 2025’ currently ranks David, Taylor, and Peter Thomson equally at #264 with a net worth of $10.2B/each.
They are an undeniable cornerstone of the Canadian elite having held a dominant position on Canada’s wealth landscape for generations.
I mention this because I am a strong proponent of ‘following the money’. If TRI is a sizable component of the Thomson family’s net worth, there is a very strong probability they will make strategic decisions to enhance the company’s long-term performance.
NOTE: TRI is a Canadian company that reports in USD. Shares are listed on the New York Stock Exchange (NYSE) and the Toronto Stock Exchange (TSX) in Canada.
Industry Overview
TRI is organized in 5 reportable customer segments: Legal Professionals, Corporates, Tax & Accounting Professionals, Reuters News and Global Print. It is, however, focusing on its 3 core, high-growth, information-enabled software segments since shedding its financial data business (Refinitiv).
Its primary competitors in these 3 segments include:
Financial and News Information
- Bloomberg L.P.: Often considered Thomson Reuters’ most direct and prominent competitor in financial data, news, and analytics, especially with their Bloomberg Terminal.
- Dow Jones: A major global provider of financial news and information, owning publications like The Wall Street Journal and services like Factiva.
- S&P Global (including the former IHS Markit): A key competitor in financial data, analytics, and market intelligence. This includes products like Capital IQ and SNL.
- FactSet: A provider of financial data and analytical applications, competing directly with Thomson Reuters’ financial offerings.
- Morningstar, Inc.: Competes in the financial data space, especially for retail investors and asset management.
Legal Information and Technology
- LexisNexis (a part of RELX Group): This is one of Thomson Reuters’ most significant and long-standing competitors in the legal research and professional services space, particularly through its Lexis+ platform.
- Wolters Kluwer (specifically its CCH division): A major global information services company that is a key competitor in legal, tax, and accounting software and information, including its CCH® SureTax® Platform and legal management solutions like TyMetrix 360.
- Specialized Legal Tech Providers: Companies that focus on specific legal operations software, such as Brightflag, Mitratech, and Legal Files Software.
Tax and Accounting
- Wolters Kluwer (CCH): This is a dominant competitor in tax software and information.
- Avalara: A major competitor in transactional tax compliance and automation, especially for its cloud-based solutions.
- Vertex: A significant player in the sales and use tax compliance software market.
Business Overview
A good overview of the company is found:
- in Part 1 Item 1 in the FY2024 Form 40-F accessible through the SEC Filings section of the company’s website; and
- the company’s website.
Filing of the most current Form 40-F was on March 6, 2025.
I also recommend reviewing TRI’s 2024 Investor Day presentation.
Financials
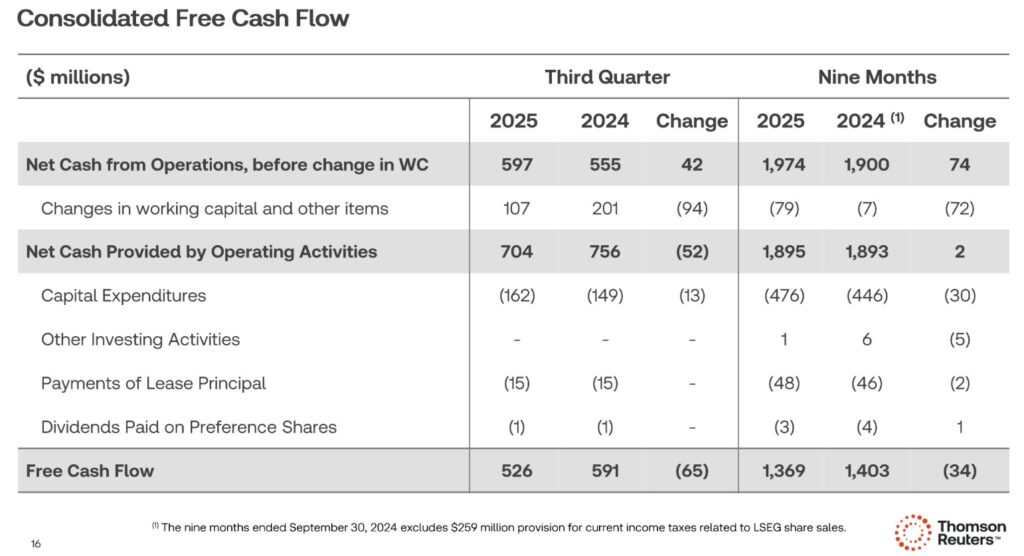
Q3 and YTD2025 Results
TRI’s Q3 and YTD2025 results are accessible in the Form 6-K filed on November 5 (see SEC Filings).
Operating Cash Flow (OCF), Free Cash Flow (FCF), and CAPEX
In prior posts I touch upon my rationale for deducting stock-based compensation (SBC) to calculate FCF. I, therefore, dispense with explaining this again.
The sale of the majority stake in the Financial & Risk (F&R) business (renamed Refinitiv) in 2018 resulted in a massive decline in TRI’s reported consolidated revenue. Prior to the sale, the F&R business was TRI’s largest division by revenue.
The sale reflected TRI’s strategic pivot to focus on high-growth, recurring-revenue businesses. The revenue reduction was not a complete loss of revenue from the F&R business because TRI retained a 45% equity stake in the new Refinitiv business and it entered into a 30-year agreement for Reuters News to supply news and editorial content to Refinitiv. This created a new revenue stream for the News segment.
TRI sold its remaining 45% stake in Refinitiv to the London Stock Exchange Group (LSEG) in an all-share transaction that closed in January 2021, further completing the strategic separation from the financial data business.
The following compares TRI’s FCF using the ‘conventional’ and ‘modified’ calculation methods.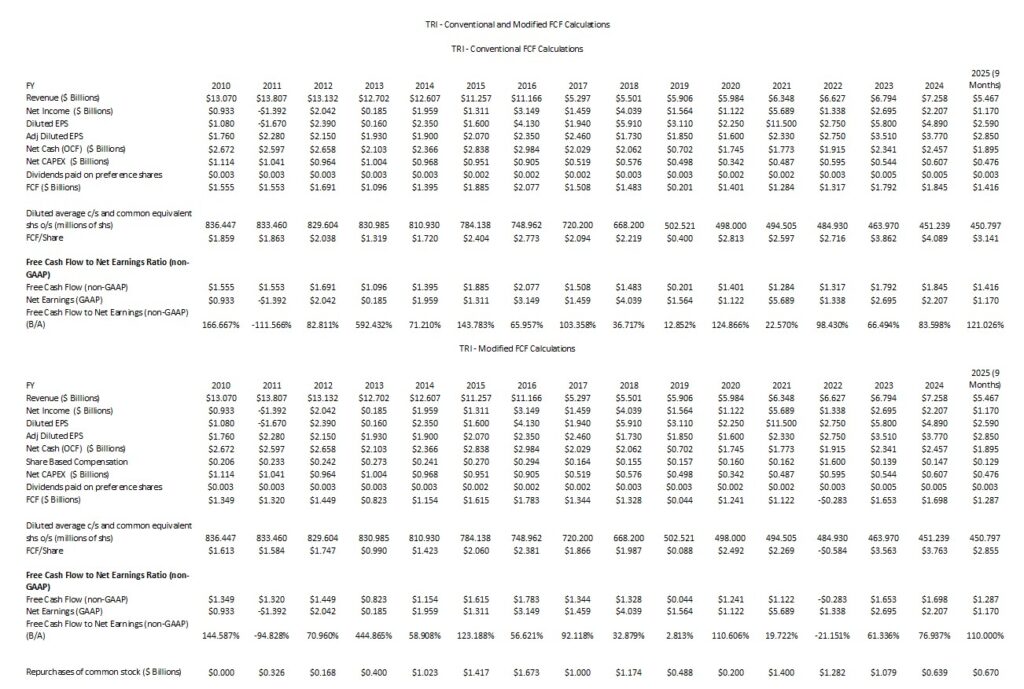
My FCF calculations differ slightly from those calculated by TRI. This is because it includes the ‘Other Investing Activities’ and ‘Payments of Lease Principal’ line items in its calculations. The values of these line items are relatively insignificant. They, therefore, have no meaningful impact on my analysis.
Capital Allocation
TRI has historically maintained a disciplined capital strategy that balances growth, long-term financial leverage, credit ratings, and returns to shareholders. A key focus is to have the investment capacity to drive revenue growth, both organically and through acquisitions, while also maintaining long-term financial leverage and credit ratings and continuing to provide returns to shareholders. The firm’s principal sources of liquidity are cash and cash equivalents and cash provided by operating activities. From time to time, TRI will also issue commercial paper, issue debt securities and borrow under its credit facility. The principal uses of cash are for debt repayments, debt servicing costs, dividend payments, capital expenditures, share repurchases and acquisitions.
TRI’s capital strategy approach has provided it with a strong capital structure and liquidity position thus enabling it to pursue organic and inorganic opportunities in key growth segments to drive shareholder returns. Its disciplined approach and highly recurring cash generative business model have allowed it to weather economic volatility in recent years caused by macroeconomic and geopolitical factors, while continuing to invest in the business.
The company expects that the operating leverage of its business will increase FCF if revenues increase as contemplated by management’s outlook.
TRI’s maximum leverage ratio is 2.5x net debt to adjusted EBITDA and it continues to target:
- a payout of 50% – 60% of expected FCF as shareholder dividends;
- a return of at least 75% of annual FCF to shareholders in the form of dividends and share repurchases; and
- a return on invested capital (ROIC) that is double or more of the firm’s weighted-average cost of capital over time.
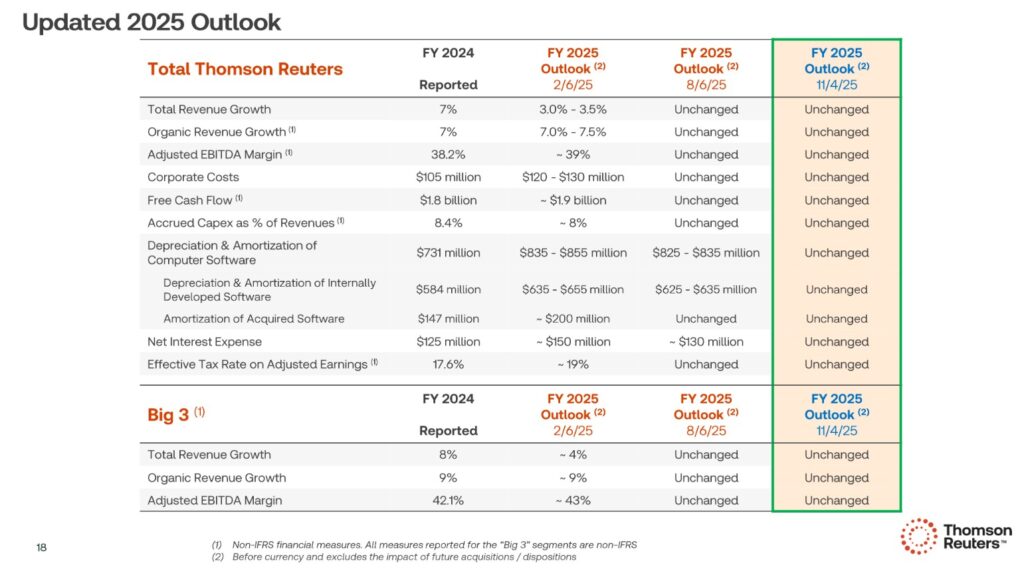
Q4 and FY2025 Goals and Preliminary FY2026 Goals
The following reflects TRI’s FY2024 results and revisions to its FY2025 outlook.
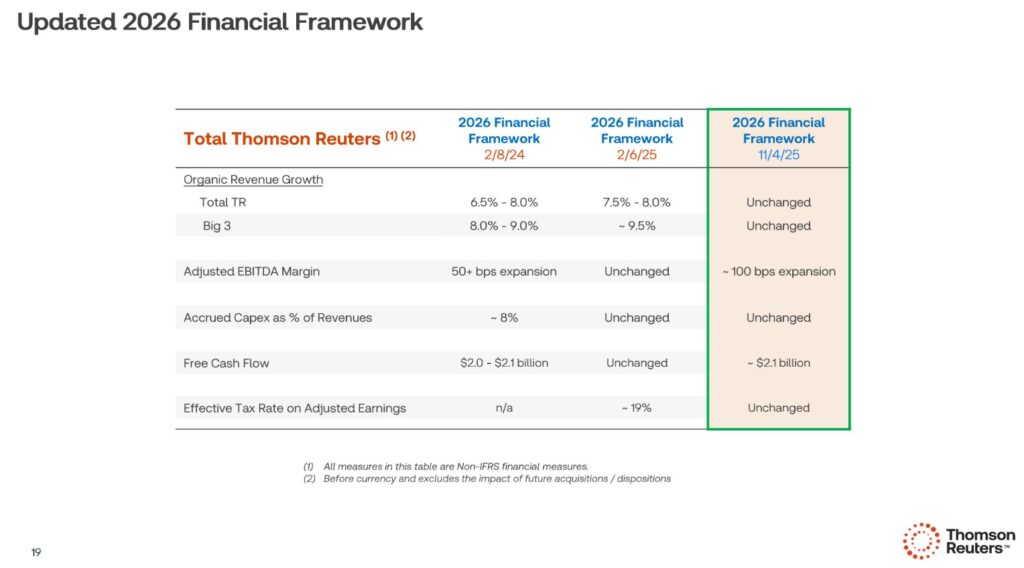
TRI’s updated FY2026 financial framework is provided below.
Risk Assessment
Many investors fixate on the potential return of an investment but overlook potential risks.
The risk aspect of an investment differs for each and every investor as risk tolerance and circumstances differ for each and every investor. As a result, what I consider to be a ‘risky’ investment may satisfy another investor’s risk tolerance OR vice versa.
As part of my risk assessment process, I consider how the major credit rating agencies assess a company’s risk. Their risk ratings are assigned to a company’s debt, and therefore, I consider that my risk exposure is greater since I invest in a company’s equity. As a shareholder, I rank ‘dead last’ should a company’ fall off the rails’. It is for this reason that I almost always restrict my investments to companies with reasonably strong investment grade credit ratings.
As I compose this post, the following are TRI’s domestic unsecured long-term debt credit ratings:
- Moody’s: Baa1 raised from Baa2 on November 27, 2023 with a positive outlook having been assigned on November 13, 2025. This is the top tier of the lower-medium investment grade category.
- Morningstar DBRS:BBB (high) confirmed on June 27, 2025 with a stable outlook. This is the top tier of the lower-medium investment grade category.
- S&P Global: A- raised from BBB+ on May 30, 2025 with a stable outlook. This is the bottom tier of the upper-medium investment grade category.
- Fitch: A- raised from BBB+ on September 26, 2025 with a stable outlook. This is the bottom tier of the upper-medium investment grade category.
The rating assigned by Moody’s and Morningstar DBRS define TRI as having an adequate capacity to meet its financial commitments. Adverse economic conditions or changing circumstances, however, are more likely to lead to TRI having a weakened capacity to meet its financial commitments.
The rating assigned by S&P Global and Fitch define TRI as having a strong capacity to meet its financial commitments. TRI, however, is somewhat more susceptible to the adverse effects of changes in circumstances and economic conditions than obligors in higher-rated categories.
These ratings reaffirm my observation that TRI’s credit risk is acceptable for my relatively conservative risk profile.
Dividends and Share Repurchases
Dividend and Share Consolidation
Details about TRI’s dividend are accessible here. Declaration and distribution of the quarterly dividend is in USD. Shareholders, however, can elect to have dividends paid in Canadian dollars or British Pounds Sterling.
The dividend component of a TRI investment is of no relevance in my decision to invest in the company. Nevertheless, you may be interested to know that TRI temporarily suspended its Dividend Reinvestment Program (DRIP) in December 2018 and June 2023 in anticipation of a major transaction involving a return of capital and a share consolidation (reverse stock split).
The reason for the 2018 DRIP Suspension was to facilitate the Return of Capital transaction associated with the sale of a 55% interest in Refinitiv to a consortium led by Blackstone (BX). This generated substantial cash proceeds with a significant portion being returned to shareholders through a combination of a cash distribution and a share consolidation (reverse stock split). The DRIP needed to be suspended to properly execute the complex return of capital transaction and the share consolidation which fundamentally changed the number of outstanding shares and involved a special cash payment.
This transaction involved a USD $4.45 cash distribution and 1 pre-consolidated share for 0.9079 post-consolidated shares.
The reason for the 2023 DRIP Suspension was for the same reason as the 2018 suspension – another large Return of Capital transaction. This transaction involved a return of capital to shareholders funded by a portion of the proceeds from the sale of its interest in the London Stock Exchange Group (LSEG) shares which it received from the subsequent sale of Refinitiv to LSEG. As in 2018, this involved a cash distribution to shareholders along with a share consolidation (reverse stock split). Suspending the DRIP was necessary to manage the logistics of the cash distribution and the resulting share consolidation, ensuring all shareholders were treated correctly in the special transaction.
This transaction involved a USD $4.67 cash distribution and 1 pre-consolidated share for 0.963957 post-consolidated shares.
In both instances, TRI resumed the DRIP after the completion of the respective return of capital and share consolidation transactions.
Share Repurchases
We see from the table provided in the Operating Cash Flow (OCF), Free Cash Flow (FCF), and CAPEX section of this post the extent to which TRI has reduced the number of diluted shares outstanding since FY2010.
In August 2025, TRI announced its intention to repurchase up to $1B of its common shares under a new Normal Course Issuer Bid (NCIB) that was approved by the TSX; this is the term used in Canada for a common type of share repurchase program. The terminology in the US is ‘share repurchase program’ or ‘buyback program’.
To prevent market manipulation, there are strict limits on the amount of shares a company can repurchase under a NCIB.
- Annual Limit: On the TSX, a company generally cannot purchase more than the greater of 10% of its public float (shares held by non-insiders) or 5% of its issued and outstanding shares over a 12-month period.
- Daily Limit: Daily purchases are also capped, typically at 25% of the average daily trading volume of the stock over the preceding six months, with some exceptions for large single purchases.
- Cancellation of Shares: The shares purchased through a NCIB are usually cancelled, which reduces the number of total outstanding shares.
In the 9 months ended September 30, 2025, TRI repurchased 3.9 million of its common shares for $0.67B at an average price of $172.03 under its August 2025 plan to repurchase up to $1B of its common shares. All these shares were repurchased in Q3 2025.
TRI may also, from time to time, enter into a pre-defined plan with its broker to allow for the repurchase of shares at times when it ordinarily would not be active in the market due to the company’s own internal trading blackout periods, insider trading rules or otherwise. TRI entered into such a plan with its broker on September 4, 2025 and in October 2025, it purchased an additional $0.33B of its common shares, which included 2.1 million common shares at an average price per share of $155.11.
In late October 2025, TRI completed its share repurchase program.
Valuation
On December 15, 2025, I initiated a position @ $131.75. In the first 9 months of FY2025, it generated $2.59 diluted EPS and $2.85 adjusted diluted EPS. If it generates similar results in Q4 as in the first 3 quarters, TRI should generate an additional ~$0.86/share of diluted EPS and ~$0.95/share in adjusted diluted EPS. This would lead to ~$3.45 of diluted EPS and ~$3.80 of adjusted diluted EPS for FY2025.
Using my purchase price, the forward diluted PE and adjusted diluted PE estimates are ~38.2 and ~34.7.
My diluted EPS and adjusted diluted EPS estimates do not consider the repurchase of another 2.1 million common shares already made in Q4.
Using my purchase price and the currently available adjusted diluted EPS broker estimates, TRI’s forward adjusted diluted PE levels are:
- FY2025 – 16 brokers – ~33.8 using a mean of $3.90 and low/high of $3.77 – $4.00.
- FY2026 – 16 brokers – ~29.5 using a mean of $4.46 and low/high of $4.22 – $4.66.
- FY2027 – 12 brokers – ~26.2 using a mean of $5.03 and low/high of $4.70 – $5.42.
I place very little reliance on broker estimates as much can happen to make these estimates irrelevant. Furthermore, the disparity in estimates implies that the brokers which cover TRI have very different outlooks.
My preference is to analyze a company’s valuation using the free cash flow a company generates.
Conventional FCF Calculation
In the first 9 months of FY2025, TRI generated $3.141 of FCF calculated using my conventional method of calculating FCF. If I extrapolate the YTD FCF for the first 9 months of the year, TRI should generate another $1.047 of FCF in Q4 2025 ($3.141/3 = $1.047). Adding $3.141 and $1.047 we get $4.188. Using a margin of safety, TRI could generate ~$4.10 of FCF for the year for a forward P/FCF of ~32.1.
Modified FCF Calculation
In the first 9 months of FY2025, TRI generated $2.855 of FCF calculated using my modified method of calculating FCF. If I extrapolate the YTD FCF for the first 9 months of the year, TRI should generate another $0.95 of FCF in Q4 2025 ($2.855/3 = $0.95). Adding $2.855 and $0.95 we get $3.805. Using a margin of safety, TRI could generate ~$3.75 of FCF for the year for a forward P/FCF is ~35.1.
Final Thoughts
I last analyzed TRI in this February 26, 2021 post at which time I noted that the company was undergoing a significant transformation. This transformation resulted in a radical changes in revenue, earnings, and FCF. The radical transformation now appears to be complete.
As recently as mid-2025, my opinion was that TRI’s valuation was completely irrational. Within a span of 5 months, however, the share price has plunged ~$87/ share from its 52-week high of $218.42. This price decline significantly contributes to a more attractive valuation.
At the outset of this post I touch upon the importance of ‘following the money’. The Thomson family is likely to make strategic decisions for the long-term benefit of the company. Take advantage of their ‘heavy lifting’.
I suspect weakness in TRI’s share price is due to investor fears over artificial intelligence (AI) disruption. TRI, in my opinion, will likely benefit from Generative AI.
Estimating a fair price is not an exact science. Estimates can easily change depending on the input data. A host of events can also dramatically distort a company’s future results. How many TRI investors in FY2013, for example, knew that TRI would sell an interest in Refinitiv to BX?
On December 15, 2025, I initiated a 300 share position @ USD~$131.75 in one of the ‘Core’ accounts in the FFJ Portfolio.
Based on my analysis of TRI’s results and FY2025 outlook and FY2026 financial framework, I think a fair price is within the USD$155 – USD$165 range. Should TRI’s share price rise to USD~$155 in a year, I would be looking at a ~17.6% return (($155 – $131.75)/$131.75). I consider this to be an acceptable rate of return given that the most recent inflation data from Statistics Canada indicates that the annual inflation rate is ~2.2% (even though grocery prices saw a significant acceleration, rising 4.7% YoY in November).
While my current exposure is only 300 shares, I may acquire additional shares if the valuation improves.
I wish you much success on your journey to financial freedom!
Note: Please send any feedback, corrections, or questions to finfreejourney@gmail.com.
Disclosure: I am long TRI (the US listed shares).
Disclaimer: I do not know your circumstances and do not provide individualized advice or recommendations. I encourage you to make investment decisions by conducting your research and due diligence. Consult your financial advisor about your specific situation.
I wrote this article myself and it expresses my own opinions. I do not receive compensation for it and have no business relationship with any company mentioned in this article.