![]()
I last reviewed Paychex (PAYX) in this November 5, 2025 post at which time the most current financial information was for Q1 2026. At the time, shares were trading at ~$115.77. As luck would have it, PAYX continues to generate strong results but the share price as I compose this post on March 26, 2026 is ~$93.50.
I want companies to efficiently allocate capital and the repurchase of undervalued shares is one way in which a company can reward shareholders.
With the release of Q3 and YTD2026 results and revised FY2026 guidance, this is a good opportunity to revisit this existing holding to gauge PAYX’s valuation.
Business Overview
Please review the company’s website and Part 1 in the company’s Form 10-K.
Financial Review
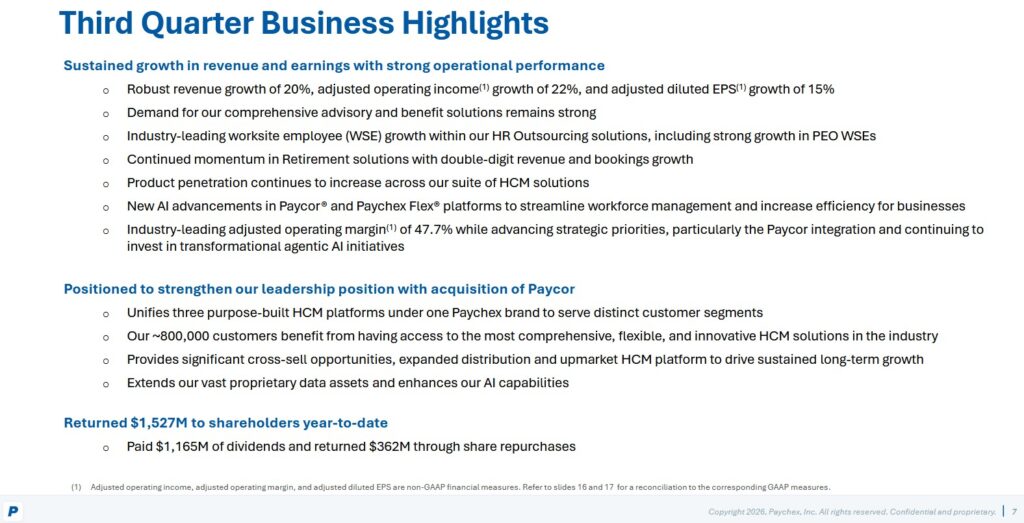
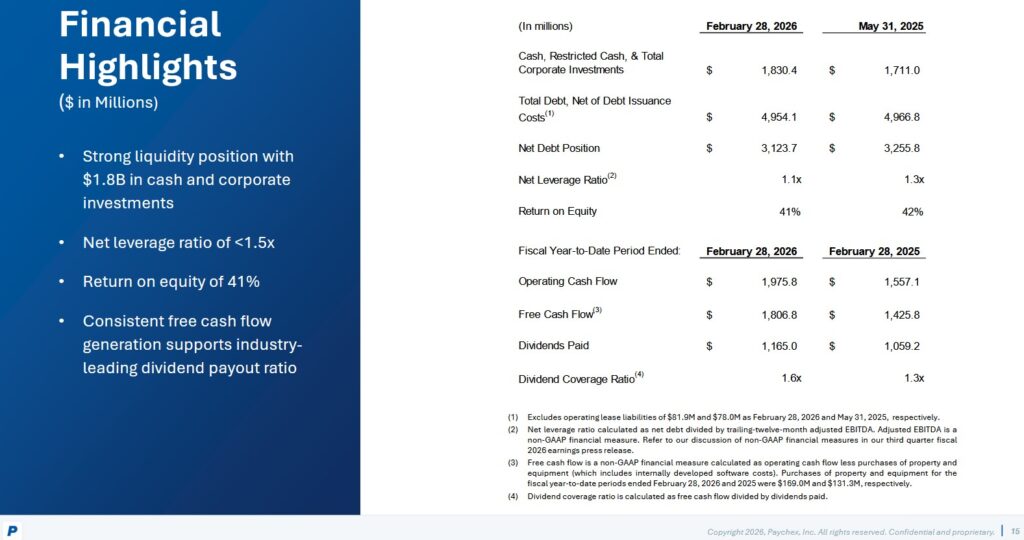
Q3 and YTD2026 Results
PAYX’s Q3 and YTD2026 results are accessible here.
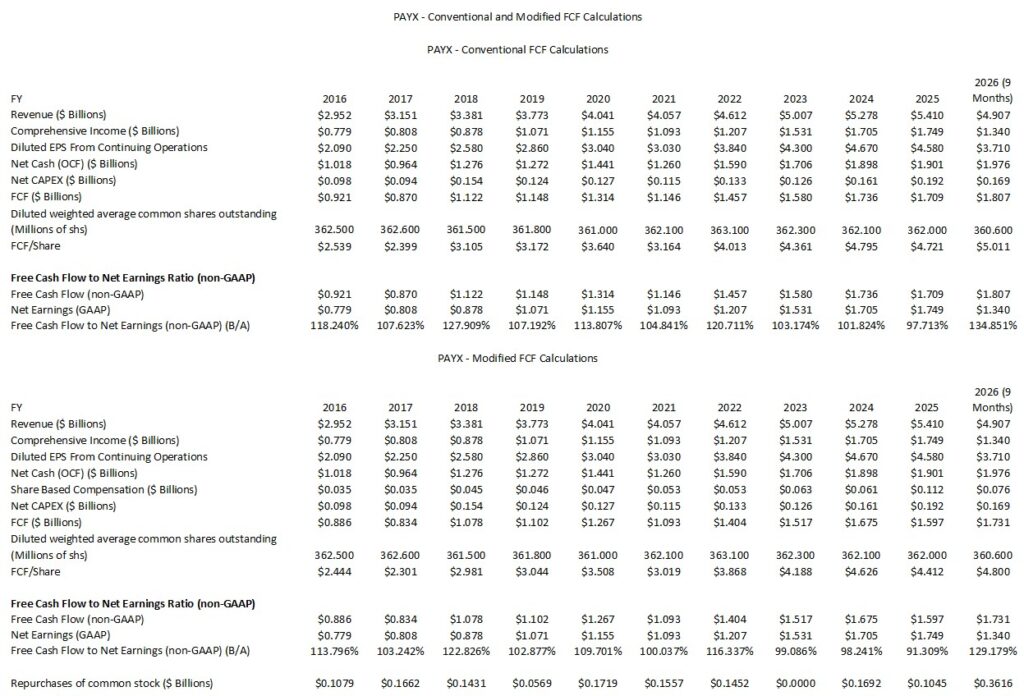
Conventional And Modified Free Cash Flow (FCF) Calculations (FY2016 – FY2025 and YTD2026)
The following reflects PAYX’s FCF using the conventional and modified methods. The modified method deducts share-based compensation (SBC) from OCF.
NOTE: I caution not to read too much into the YTD2026 FCF/EPS ratios. As FY2026 progresses, we are likely to witness a regression to levels similar to those in recent years.
ROIC and WACC
Return on Invested Capital (ROIC) provides an indication of a company’s efficiency. In essence, is a company actually creating value or ‘burning’ cash for the sake of growth?
A company with a higher ROIC is mathematically worth more because it requires less reinvestment to achieve that growth.
A good indication of how well a company is performing is to compare ROIC to the Weighted Average Cost of Capital (WACC). PAYX does not report WACC. A rough estimate is possible, however, by using the company’s credit profile and market conditions.
The generally accepted high-level formula used by Wall Street is:
ROIC = NOPAT/Average Invested Capital
with the Net Operating Profit After Tax (NOPAT) formula being Operating Income (EBIT) x (1-tax rate)
This shows how much profit the core business makes while ignoring how much debt the company has.
The Average Invested Capital is the total money tied up in the business.
- The Operating Approach formula is
- The Financing Approach is
PAYX’s ROIC has consistently outperformed its Weighted Average Cost of Capital (WACC). The 2025 Paycor acquisition added ~$5B in debt and significantly increased the ‘Invested Capital’ denominator (Goodwill and Intangibles). This caused the ROIC to drop from the mid-30% range to the mid-20% range in 2025 and ~18% – ~22% trailing twelve months (TTM) in FY2026.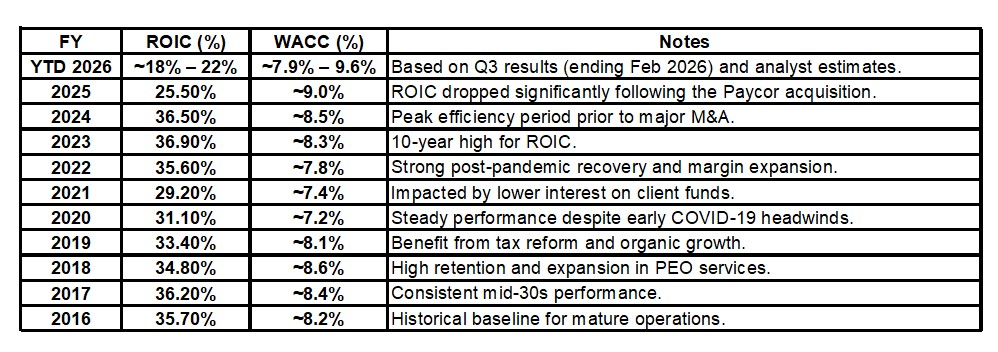
PAYX’s WACC has historically been 7% – 9% with the recent uptick toward 9.6% in some 2026 models reflecting the cost of the new debt used for the Paycor deal and broader market interest rate environments.
Despite the drop in ROIC, the spread (ROIC minus WACC) remains positive at roughly 10% to 12%, indicating that PAYX continues to create significant economic value.
As of the Q3 2026, PAYX is seeing a re-acceleration of revenue growth (20% YoY) and is on track for synergy targets from the Paycor integration, which may stabilize or improve ROIC in the coming fiscal years.
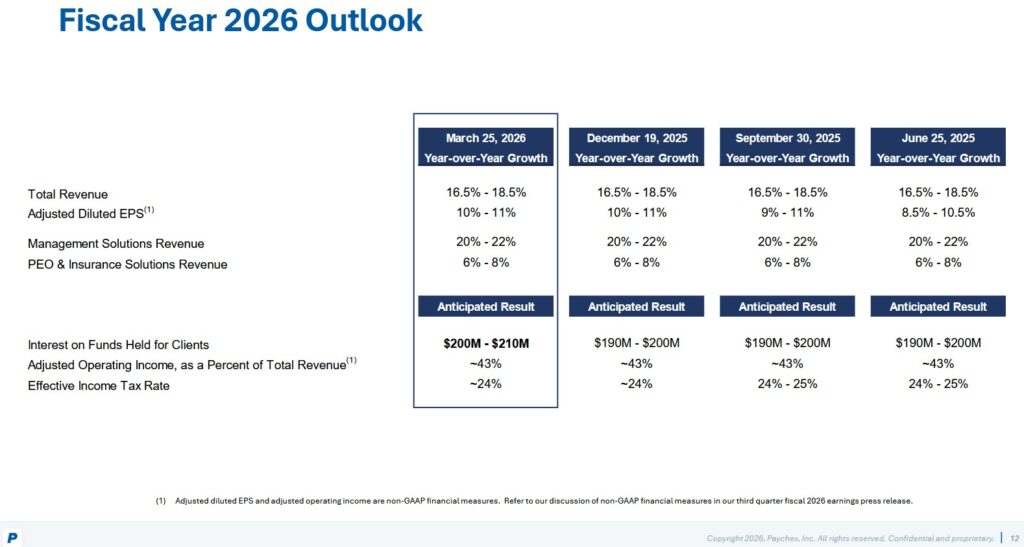
FY2026 Outlook
The following reflects the trend in PAYX’s FY2026 outlook over the last few quarters.
In FY2025, PAYX generated $4.98 of adjusted diluted EPS. Using the current 10.5% growth mid-point outlook, PAYX’s FY2026 adjusted diluted EPS mid-point is ~$5.50.
Risk Assessment
The following is from the Q2 2026 Form 10-Q.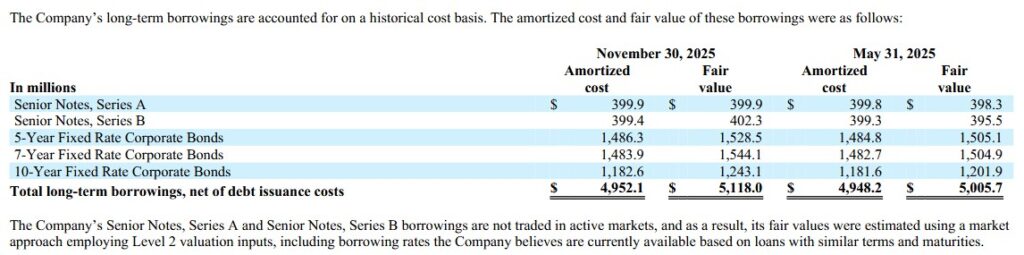
The March 13, 2026 maturity date of the Series A Senior Notes is after the end of Q3 2026 (February 28, 2026). PAYX has ample liquidity to repay these Senior Notes and I presume this has fully been repaid. This will be validated once the FYE2026 results are made available.
Moody’s assigns a Baa1 rating (assigned on March 31, 2025) while S&P Global assigns a BBB+ rating (last reviewed on March 13, 2026).
Both ratings are the top tier of the lower medium grade category. These ratings define PAYX as having an adequate capacity to meet its financial commitments. adverse economic conditions or changing circumstances, however, are more likely to lead to a weakened capacity to meet its financial commitments.
PAYX’s credit assessment meets my relative conservative risk tolerance.
Dividends
PAYX’s dividend history is accessible here. In early May 2026, we can expect PAYX to declare another quarterly dividend. I anticipate a dividend increase from $1.08 to $1.15 – $1.17.
Do not rely on the posted dividend yields on various stock screeners. Investors holding PAYX shares in tax efficient accounts will get a different yield from non-US residents who hold shares in taxable accounts. I, for example, incur a 15% dividend withholding tax on the dividend income received from the PAYX shares held in a taxable account.
My suggestion is to pay little regard to dividend metrics. Focus on an investment’s total potential investment return.
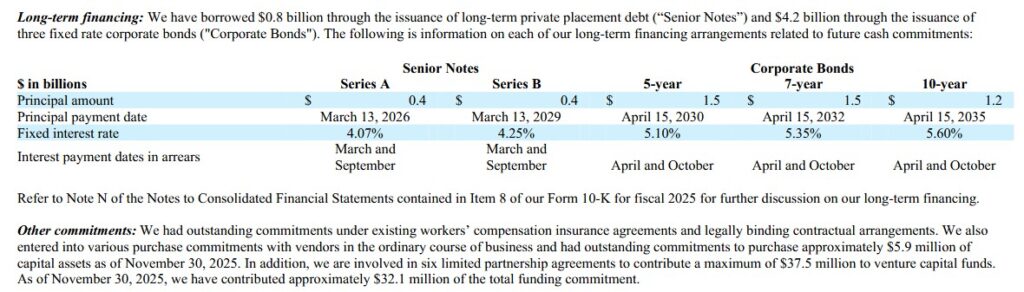
If the Series A Notes were fully repaid on March 13, 2026, PAYX’s next long-term debt obligation matures on March 13, 2029. Given that shares are currently undervalued, I would like PAYX to increase its level of share repurchases. Share repurchases, however, are not a capital allocation priority. The purpose of PAYX’s $0.4B share repurchase program that expires May 31, 2027 is to manage common stock dilution.
Valuation
Shares trade at ~$93.50 as I compose this post on March 26, 2026. PAYX’s FY2026 adjusted diluted EPS mid-point outlook is ~$5.50 given us a forward adjusted diluted PE of ~17.
Using the current forward adjusted diluted EPS broker estimates, the following are PAYX’s forward adjusted diluted PE levels:
- FY2026 – 17 brokers – mean of $5.50 and low/high of $5.47 – $5.51. Using the mean estimate, the forward adjusted diluted PE was ~17.
- FY2027 – 17 brokers – mean of $5.91 and low/high of $5.75 – $6.00. Using the mean estimate, the forward adjusted diluted PE was ~15.8.
- FY2028 – 10 brokers – mean of $6.31 and low/high of $6.15 – $6.48. Using the mean estimate, the forward adjusted diluted PE was ~14.8.
I think the YTD2026 FCF conversion ratio (see above) is likely to retrace from current levels to ~110% and ~105% by FYE2026 (conventional and modified calculations).
In the first 3 quarters of FY2026, PAYX generated $3.71 of diluted EPS. If it can generate a similar amount of diluted EPS in Q4 as in the first 3 quarters, the FY2026 diluted EPS should be ~$4.95 ($3.71 + (33.3% * $3.71)).
If we use a 110% conversion ratio, the FY2026 FCF should be ~$5.45 ($4.95 * 1.10). Using the current $93.45 share price, the forward diluted P/FCF is ~17.1.
If we use a 105% conversion ratio, the FY2026 FCF should be ~$5.20 ($4.95 * 1.05). Using the current $93.45 share price, the forward diluted P/FCF is ~18.
These valuation estimates are superior to those at the time of prior posts.
Final Thoughts
PAYX should continue to benefit from complex government regulations, diverse workforces, and expensive healthcare costs. Many companies continue to optimize their headcount and to focus on their core business. This benefits PAYX as evidenced by its ability to drive higher growth through its outsourced solutions.
Its professional employer organization (PEO) and administrative services organization solutions allow clients to outsource their human resources departments and reduce insurance costs. This has become increasingly popular and should continue to grow in the mid-single digits.
PAYX benefits from switching costs in that Human Capital Management (HCM) and payroll software are deeply integrated into a company’s operations. Transitioning from one provider to another can result in significant operational disruptions affecting employee productivity. Examples of potential disruptions are the time required to get acquainted with a new software system as well as the potential data loss that may occur when switching providers.
My PAYX exposure is now 974.91982 shares (506.91982 and 468 shares in a ‘Core’ and a ‘Side’ account, respectively) in the FFJ Portfolio.
It was my 27th largest holding when I completed my 2025 Mid-Year Portfolio Review. It was not, however, a top 30 holding when I completed my 2025 Year-End Investment Holdings Review.
I consider a fair value to be ~$100 – ~$110. With shares trading at ~$93.45, PAYX appears to be modestly undervalued.
I wish you much success on your journey to financial freedom!
Note: Please send any feedback, corrections, or questions to finfreejourney@gmail.com.
Disclosure: I am long PAYX.
Disclaimer: I do not know your circumstances and do not provide individualized advice or recommendations. I encourage you to make investment decisions by conducting your own research and due diligence. Consult your financial advisor about your specific situation.
I wrote this article myself and it expresses my own opinions. I do not receive compensation for it and have no business relationship with any company mentioned in this article.