 When I last reviewed Moody’s (MCO) in my April 27, 2025 post, I considered shares trading ~$437 to be close to my ~$450 fair value estimate. I, therefore, decided not to add to my exposure.
Business conditions have improved subsequent to that review. With the October 22 release of Q3 and YTD2025 earnings and revised FY2025 earnings estimates, I revisit this existing holding’s fair value estimate.
Business Overview
Details of MCO’s operations are found in Part 1 Item 1 in the FY2024 Form 10-K which is accessible through the SEC Filings section of the company’s website.
MCO and MSCI to Launch Independent Risk Assessments for Private Credit Investments
On April 21, 2025, MCO and MSCI announced that they will jointly create a first-of-its-kind solution to provide independent risk assessments for private credit investments at scale.
This partnership brings together MCO’s credit scoring models with MSCI’s very deep data on private credit investments. Together, they will:
- enable investors to understand the credit profile of companies and individual loans; and
- serve a critical need for transparency and standards in the private credit market.
Neither company has disclosed the revenue model or opportunity. The private credit market, however, is significant and growing rapidly. Based on MCO’s and MSCI’s engagement with investors – pension funds, long-only investors, and insurance companies that are big allocators to private credit – there is considerable desire to have a rigorous third-party credit assessment of the investments in which they invest.
Financials
Q3 and YTD2025 Results
Material pertaining to MCO’s Q3 and YTD2025 results is accessible here. In addition, I recommend reviewing MCO’s Q3 2025 Form 10-Q which is accessible here.
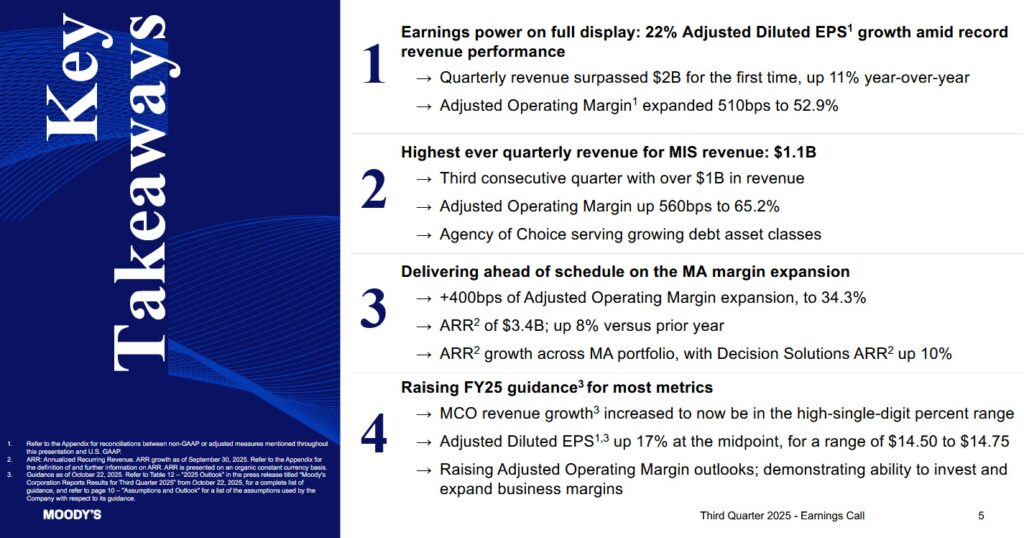
The following is a very high level overview of MCO’s Q3 2025 results.
Operating Cash Flow (OCF), CAPEX, and Free Cash Flow (FCF)
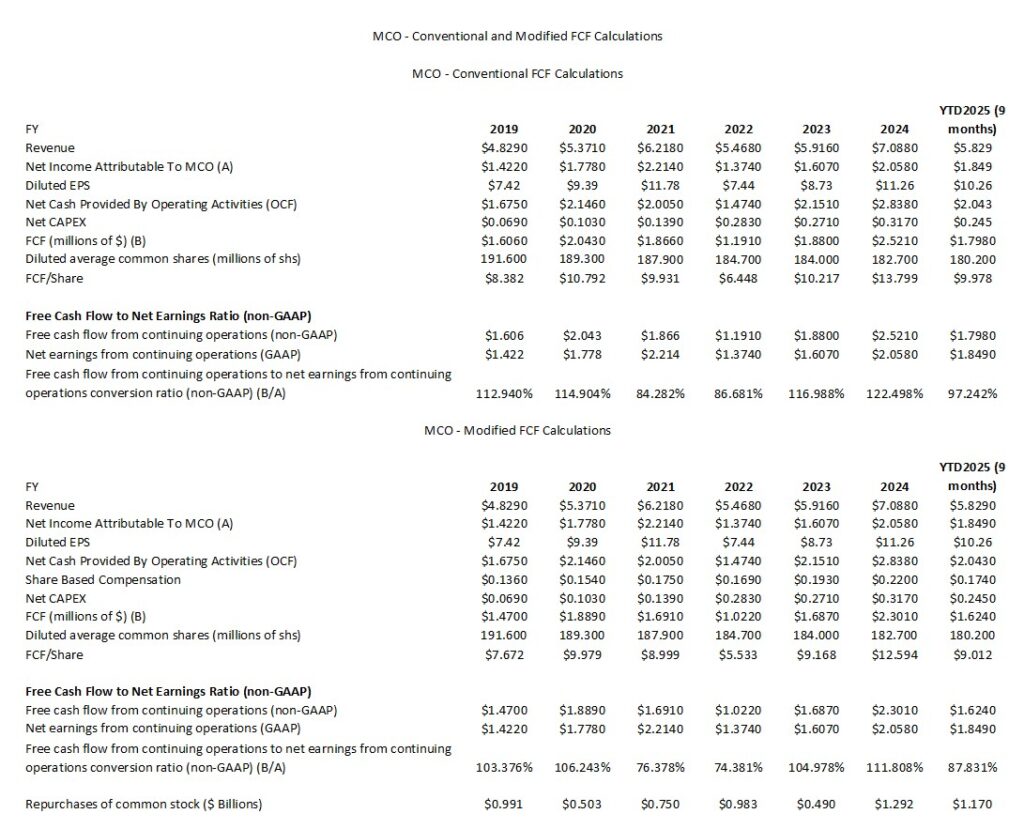
Since FCF is a non-GAAP measure, there is no consistency in its calculation. In several previous posts I explain my rationale for deducting stock-based compensation (SBC) to determine a company’s FCF. I, therefore, provide calculations using the:
- conventional method where only CAPEX is deducted from OCF; and
- more conservative modified method where I also deduct SBC.
Capital Allocation
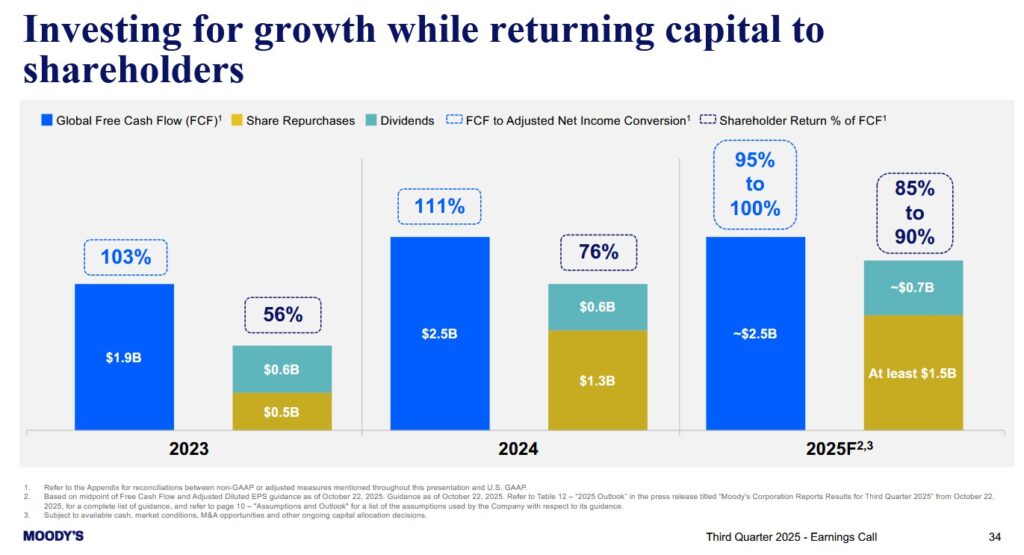
The following reflects MCO’s capital allocation in FY2023 and FY2024 and the forecast for FY2025. MCO’s Global FCF does not deduct SBC.
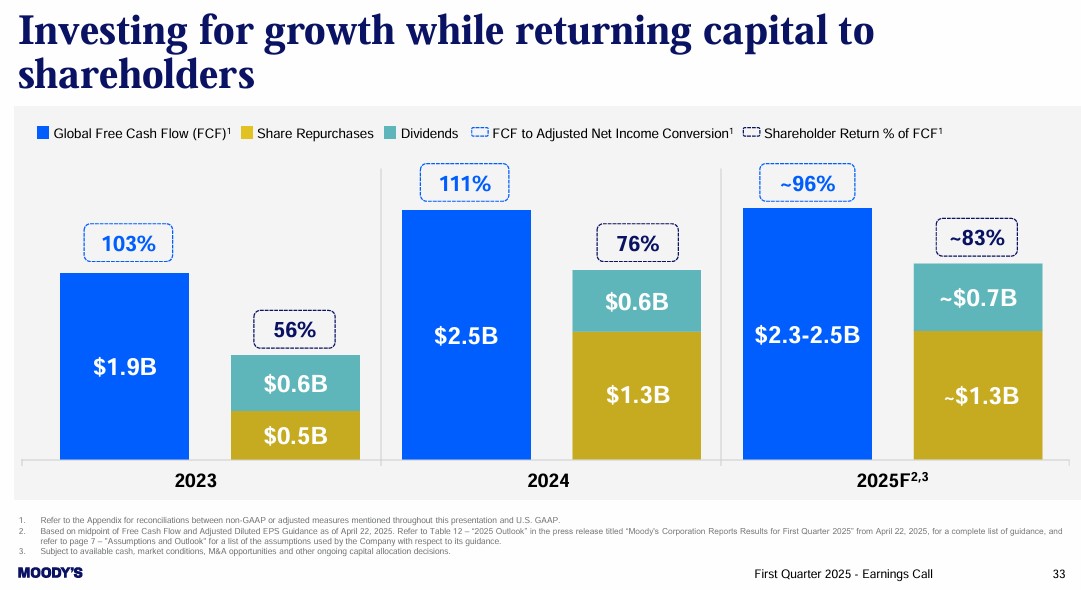
The following reflects MCO’s forecast at the time it presented its Q1 2025 results.
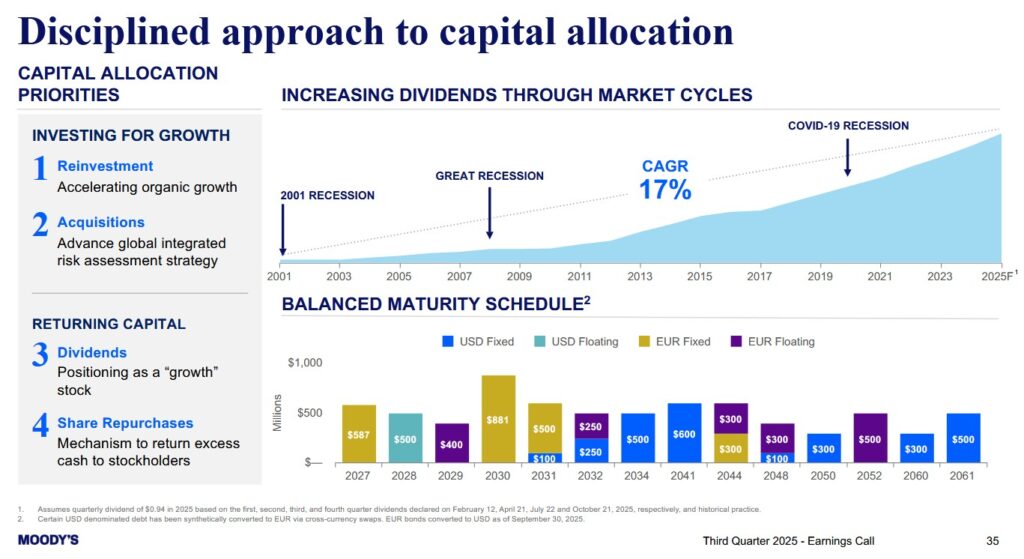
MCO’s capital allocation priorities are reflected below.
Return On Invested Capital (ROIC)
MCO’s ROIC (%) in FY2018 – FY2024 is 26.09, 24.59, 25.41, 24.48, 14.75, 17.20, and 20.31. (Source: Morningstar)
High quality companies often generate a high ROIC. If a company generates a high ROIC, it needs to invest less to achieve a certain growth rate thus reducing the need for external capital.
A company that generates $0.15/profit for every $1 invested, for example, achieves a ROIC of 15%. I consider a ~15%+ ROIC to be a reasonable minimum threshold because most of the time, a company’s cost of capital will be lower than this level.
When a company consistently generates a high ROIC over the long term and it is growing its revenue, it can reinvest a portion of its profits under favorable conditions thereby leading to a compounding effect. I would much rather invest in a growing company that can reinvest to create greater shareholder value than to invest in a company that has limited growth opportunities and thus chooses to distribute a growing dividend.
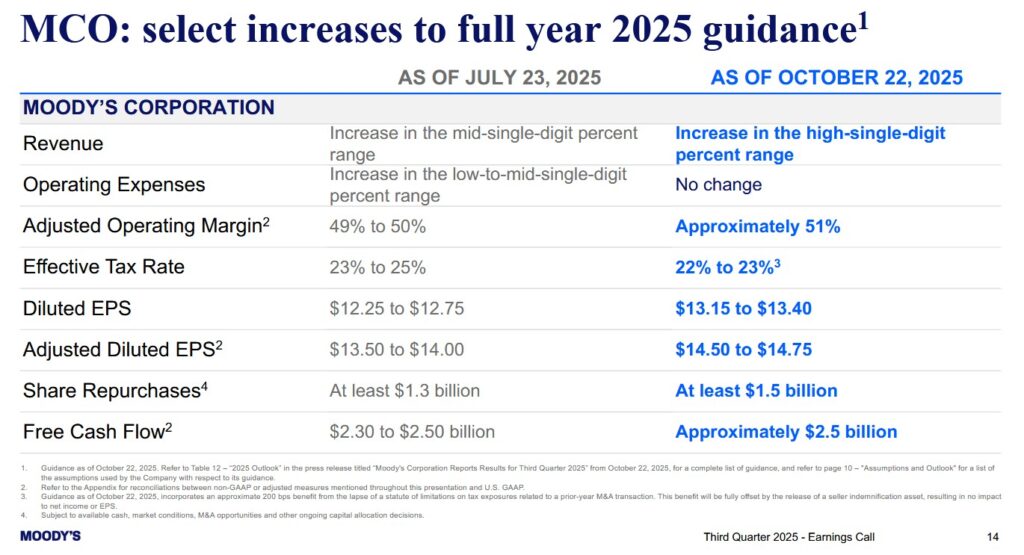
FY2025 Guidance
The following images reflect the evolution of MCO’s FY2025 guidance.

Despite the near-term dynamics, MCO remains confident about the demand for its solutions. The deep currents that underpin the demand for its solutions are the:
- evolution of capital markets including private credit;
- digital transformation and automation in financial services industries;
- need to know more about with whom you are conducting business;
- financial impact of extreme weather events; and
- transformative power of generative AI and the tremendous opportunities available from proprietary data.
Preliminary FY2026 Guidance
On the Q3 earnings call, management provided the following in response to an analyst’s question about the FY2026 outlook:
I think there are more tailwinds than there are headwinds going into 2026. So we’re thinking it’s going to be a pretty constructive issuance environment into 2026.
We’ve got spreads at very tight ranges right now so we have the potential for lowering benchmark rates.
We’ve certainly seen the M&A environment really pick up in the third quarter.
So 2026 may be the year that we really see not just M&A, but sponsor-backed M&A, come back into the market. We’ve talked about what a positive that will be. We do have the potential for further resolution in some of these geopolitical conflicts that I think could provide a little bit more market confidence.
There is mixed sentiment around economic growth but the current thinking is that we’re not looking at a recession. While there’s been a little bit of a slowdown, we think the current levels of growth across the G20 are generally sustainable into next year.
Risk Assessment
There is no change to MCO’s senior unsecured domestic long-term debt ratings and outlook.
- S&P Global – BBB+ with a stable outlook (last reviewed and affirmed on May 8, 2025); and
- Fitch – BBB+ with a stable outlook (last reviewed and affirmed on July 21, 2025) ;
Both are at the top of the lower medium-grade investment-grade tier. These ratings define MCO as having an ADEQUATE capacity to meet its financial commitments. However, adverse economic conditions or changing circumstances are more likely to lead to MCO having a weakened capacity to meet its financial commitments.
The following schedule of total indebtedness is found on page 39 of 95 in the Q3 2025 Form 10-Q.
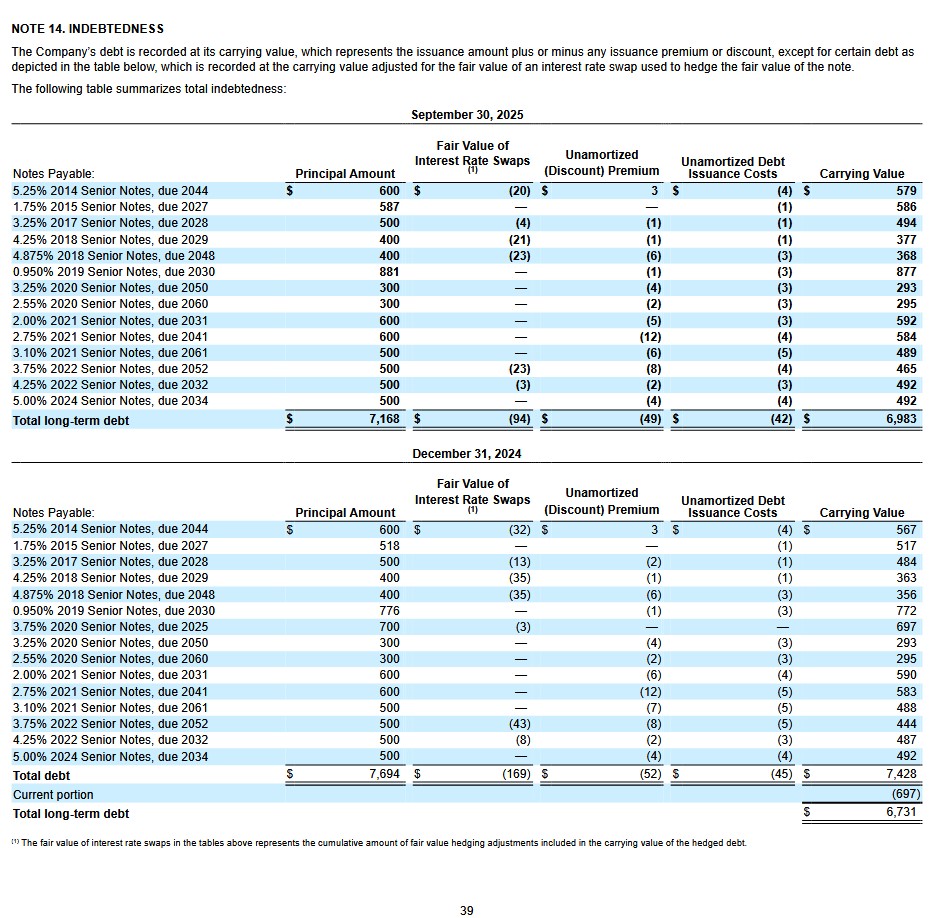
The rating assigned to each indebtedness is accessible here.
MCO’s credit risk is acceptable from my perspective.
Dividend and Dividend Yield
MCO’s dividend history reflects annual dividend increases starting in 2011 following a dividend freeze that was precipitated by challenging business conditions during The Financial Crisis.
Dividend distributions are MCO’s 3rd capital allocation priority.
MCO is positioned as a ‘growth’ stock. The unappealing dividend metrics, therefore, may dissuade some investors from investing in the company. Investors, however, should focus on an investment’s total potential return.
MCO’s diluted weighted average number of shares outstanding during FY2019 – FY2024 (in millions of shares) are reflected in the table provided in the Operating Cash Flow (OCF), CAPEX, and Free Cash Flow (FCF) section of this post. In Q3 2025 this had been reduced to 179.6 million.
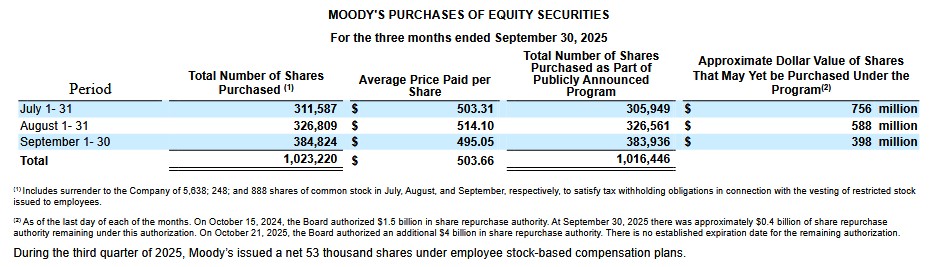
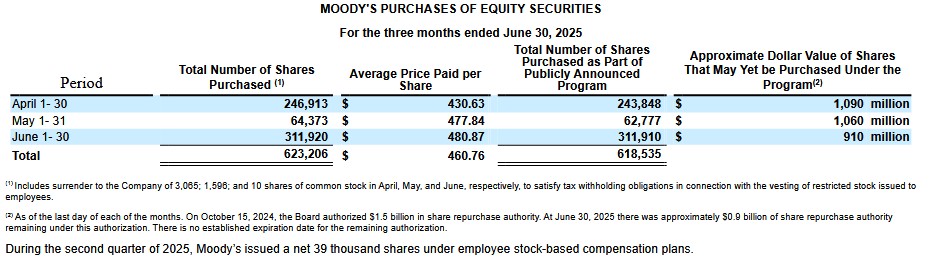
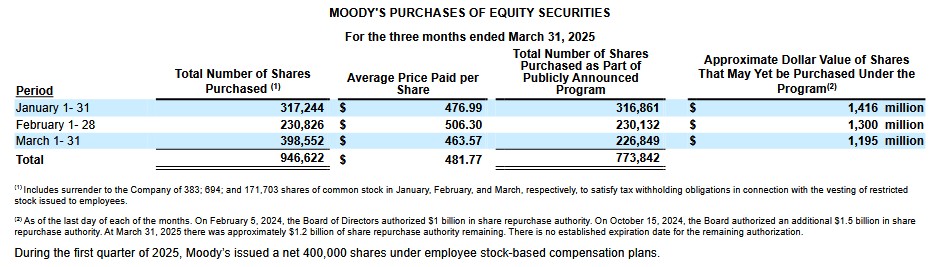
The following reflects MCO’s share repurchases in each of the first 3 quarters of FY2025.
Valuation
MCOs’ share price at the October 23 market close is ~$479.30. Using management’s FY2025 $13.15 – $13.40 diluted EPS outlook, the forward diluted PE range is ~35.8 – ~36.4. The FY2025 adjusted diluted EPS outlook is $14.50 – $14.75 giving us a ~32.5 – ~33.1 forward adjusted diluted PE range.
The forward valuations using the currently available adjusted diluted broker estimates are:
- FY2025 – 24 brokers – mean of $14.42 and low/high of $13.54 – $14.91. Using the mean estimate, the forward adjusted diluted PE is ~33.2.
- FY2026 – 24 brokers – mean of $16.10 and low/high of $14.95 – $17.05. Using the mean estimate, the forward adjusted diluted PE is ~29.8.
- FY2027 – 21 brokers – mean of $18.02 and low/high of $16.06 – $19.81. Using the mean estimate, the forward adjusted diluted PE is ~26.6.
Management’s FY2025 FCF guidance is ~$2.5B. If we estimate $0.25B of SBC in FY2025, we get a modified FCF $2.25B.
The diluted weighted average number of outstanding shares in Q3 2025 was 179.6 million and 180.2 for the year. MCO’s FY2025 forecast calls for share repurchases totaling at least ~$1.5B and it has already repurchased ~$1.17B in the first 3 quarters. We can, therefore, expect at least another $0.33B to be repurchased in Q4. If it repurchases $0.33B of shares in Q4 at an average price of $480, this amounts to ~687,500 shares. It will likely also issue shares to its employees in Q4 so I estimate MCO’s FY2025 diluted weighted average number of shares outstanding will be ~179 million shares.
Using management’s ~$2.5B FCF guidance and 179 million shares, I anticipate MCO will generate ~$14 of FCF/share. Divide the current ~$479.30 share price by ~$14 and the P/FCF estimate is ~34.2.
If we deduct ~$0.25B of SBC from $2.5B, we get ~$2.25B of modified FCF and 179 million shares giving us ~$12.6 of FCF/share. Divide the current ~$479.30 share price by ~$12.6 and the P/FCF estimate is ~38.
For ease of comparison, I provide my assessment of MCO’s valuation at the time of my April 27, 2025 post.
MCO’s April 25, 2025 closing share price was $438.62. Using management’s FY2025 diluted EPS estimate of $12.00 – $12.75, the forward diluted PE range is ~34.4 – ~36.5.
Management’s FY2025 adjusted diluted EPS estimate is $13.25 – $14.00 giving us a forward adjusted diluted PE range of ~31.3 – ~33.1.
The forward valuations using the currently available adjusted diluted broker estimates are:
- FY2025 – 22 brokers – mean of $13.71 and low/high of $13.27 – $14.26. Using the mean estimate, the forward adjusted diluted PE is ~32.
- FY2026 – 22 brokers – mean of $15.43 and low/high of $14.85 – $16.08. Using the mean estimate, the forward adjusted diluted PE is ~28.4.
- FY2027 – 11 brokers – mean of $17.43 and low/high of $16.06 – $18.85. Using the mean estimate, the forward adjusted diluted PE is ~25.2.
Management’s FY2025 FCF guidance is $2.3B – $2.5B. If we estimate $0.25B of SBC in FY2025, we get a modified FCF range of $2.05B – $2.25B.
The diluted weighted average number of outstanding shares in Q1 2025 was 180.7 million. MCO’s FY2025 forecast calls for share repurchases totaling ~$1.3B. It has already repurchased ~$0.373B in Q1 so another ~$0.927B is likely to be repurchased in Q2 – Q4. If MCO repurchases shares at an average price of $460, it will repurchase just over 2 million shares. On this basis, I estimate MCO’s FY2025 diluted weighted average number of shares outstanding will be ~179 million shares.
Using the $2.4B mid-point of management’s FCF guidance and 179 million shares, I anticipate MCO will generate ~$13.40 of FCF/share. Divide the current ~$438.62 share price by ~$13.40 and my P/FCF estimate is ~32.7.
Using the $2.15B mid-point of the modified FCF range and 179 million shares, I anticipate MCO will generate ~$12 of FCF/share. Divide the current ~$438.62 share price by ~$12 and my P/FCF estimate is ~36.6.
It is readily apparent that trying to determine a company’s valuation is difficult. Even my rudimentary calculations can generate estimates that differ considerably from actual results. If we perform discounted cash flow (DCF) calculations, our results are even more of a ‘crapshoot’ since more metrics are involved and cash flow estimates going out several years into the future are plugged into the DCF formula. In my Why I Do Not Perform Discounted Cash Flow Analyses post, I touch upon why I find this form of analysis to be a complete waste of time.
Final Thoughts
I currently hold 410 shares in a ‘Core’ account in the FFJ Portfolio; MCO was my 18th largest holding when I completed my 2025 Mid-Year Portfolio Review.
Increases in MCO’s FY2025 guidance and a cautiously optimistic FY2026 outlook is leading me to increase my fair value estimate from the ~$450 level I expressed in my April post to ~$530 – ~$540. With shares currently trading at ~$479.30, MCO’s share price would increase ~11.6% to reach the mid-point of my fair value estimate.
I am currently in no rush to increase my exposure. Should MCO’s share price experience weakness, however, I hope to be in a position to acquire additional shares.
I wish you much success on your journey to financial freedom!
Note: Thanks for reading this article. Please send any feedback, corrections, or questions to finfreejourney@gmail.com.
Disclosure: I am long MCO.
Disclaimer: I do not know your circumstances and am not providing individualized advice or recommendations. I encourage you not to make any investment decisions without conducting your research and due diligence. You should also consult your financial advisor about your specific situation.
I wrote this article myself and it expresses my own opinions. I am not receiving compensation for it and have no business relationship with any company whose stock is mentioned in this article.