I last reviewed Exxon Mobil (XOM) in this December 8 2023 post and concluded that many investors tripping over themselves to acquire shares in the ‘Magificent 7’ (Alphabet GOOGL, Apple AAPL, Amazon AMZN, Meta Platforms META, Microsoft MSFT, Nvidia NVDA and Tesla TSLA) might get a rude awakening when least expected.
On the other hand, investor expectations for Exxon Mobil (XOM) were low when I wrote that post.
In my opinion, the time to invest in great companies is when expectations are low. I, therefore, acquired an additional 100 shares @ ~$99/share in one of the ‘Core’ accounts in the FFJ Portfolio on December 6 and disclosed this in my December 8, 2023 post.
Fast forward to August 2, 2024. We now have XOM’s Q2 and YTD2024 results. Furthermore, the merger with Pioneer Natural Resources (PXD) was completed a couple of months ago.
Company Overview
You are undoubtedly familiar with XOM. A great source of information from which to gain a deeper understanding of the company, however, is the 2023 Form 10-K that can be accessed through the SEC Filings section of the company’s website.
Financial Review
Q2 and YTD2024 Results
Material related to XOM’s August 2 earnings release is accessible here.
Operating Cash Flow (OCF), CAPEX, and Free Cash Flow (FCF)
XOM is a highly capital intensive business as borne out by its annual CAPEX levels. High CAPEX has its advantages and disadvantages. A key advantage is the high barriers to entry. You may get new industry participants but they can not compete directly with XOM. Going forward, we will likely witness more industry consolidation; XOM is like to be an acquirer.
In the FY2014 – FY2023 time frame, XOM’s:
- OCF was (in B$) 45.12 30.34 22.08 30.07 36.01 29.72 14.67 48.13 76.80 55.37.
- CAPEX was (in B$) 32.95 26.49 16.16 15.40 19.57 24.36 17.28 12.08 18.41 21.92.
- FCF was (in B$) 17.45 7.66 7.89 15.31 19.48 5.37 -0.96 32.56 61.03 37.71.
In the first half of FY2024, XOM generated OCF of ~$25.2B and FCF of ~$15B. This includes working capital outflows of $2.6B driven by higher seasonal cash tax payments. Excluding working capital, OCF and FCF were $27.8B and $17.6B, respectively.
Return On Invested Capital (ROIC)
High quality companies often generate a high ROIC. If a company generates a high ROIC, it needs to invest less to achieve a certain growth rate thus reducing the need for external capital.
When a company consistently generates a high ROIC over the long term and it is growing its revenue, it can reinvest a portion of its profits under favorable conditions thereby leading to a compounding effect. I would much rather invest in a growing company that can reinvest to create greater shareholder value than to invest in a company that has limited growth opportunities and thus chooses to distribute a growing dividend.
A company that generates $0.15/profit for every $1 invested, for example, achieves a ROIC of 15%. I consider a ~15%+ ROIC to be a reasonable minimum threshold because most of the time, a company’s cost of capital will be lower than this level.
XOM’s FY2014 – FY2023 ROIC (%) was 16.34, 7.92, 3.87, 9.12, 9.28, 6.36, -9.27, 10.74, 24.87, and 15.16.
XOM’s ROIC was decimated in FY2020 with the onset of COVID-19 and it was forced to borrow to service its dividend.
In my opinion, the time to invest in great companies is when they encounter temporary headwinds. So….I acquired:
- 400 shares on February 25, 2020 @ ~$55.37 in one of the ‘Side’ accounts in the FFJ Portfolio;
- 200 shares on July 22, 2021 @ ~$57.165 in one of the ‘Core’ accounts in the FFJ Portfolio;
- 20 shares on June 29, 2022 @ ~$89.6942 in one of the ‘Core’ accounts in the FFJ Portfolio;
- 25 shares on July 12, 2022 @ ~$84.17 in one of the ‘Core’ accounts in the FFJ Portfolio; and
- shares in a retirement account for which I do not disclose details on July 8, 2022 @ $85.77.
FY2024 Outlook
XOM does not issue adjusted diluted EPS guidance for the year because demand/supply conditions are so unpredictable.
While geopolitical risks can impact commodity markets and results of industry participants, energy investors would be well advised to focus on fundamentals within the sector such as supply/demand inventories. Currently, global oil inventories are at a record deficit relative to average levels.
XOM has just recently completed the PXD acquisition but early results have been impressive. The heritage PXD organization delivered record production of more than 790,000 oil-equivalent barrels per day in June and record production through the quarter of more than 780,000 oil-equivalent barrels per day in April – June 2024. The incremental production attributable to XOM in Q2 was greater than 520,000 oil-equivalent barrels per day.
The PXD contribution to XOM’s Q2 operating earnings was $0.540B which excludes $0.230B of other expenses driven by one-time transaction-related costs. In addition, pre-tax depreciation was $0.930B for June and July. This includes $0.390B higher depreciation resulting from the step-up in value of the assets associated with purchase accounting.
Risk Assessment
Far too often, some investors fixate on an investment’s potential return and overlook the various risk aspects of the investment. This is why I strongly encourage investors to read the ‘Risks’ section of a company’s Form 10-K.
While I try to assess a company’s risk level, I also look at how the rating agencies perceive the company’s risk.
XOM’s current domestic long-term unsecured debt ratings and outlook are:
- Moody’s: Aa2 (stable) last reviewed May 31, 2024.
- S&P Global: AA- (stable) last reviewed September 25, 2023.
The rating assigned by Moody’s is the middle tier of the high-grade investment-grade category. It is one tier above the rating assigned by S&P Global.
Both ratings define XOM as having a very strong capacity to meet its financial commitments. It differs from the highest-rated obligors only to a small degree.
The most current schedule of XOM’s debt is reflected in the FY2023 Form 10-K; this schedule reflects well dispersed maturity dates.
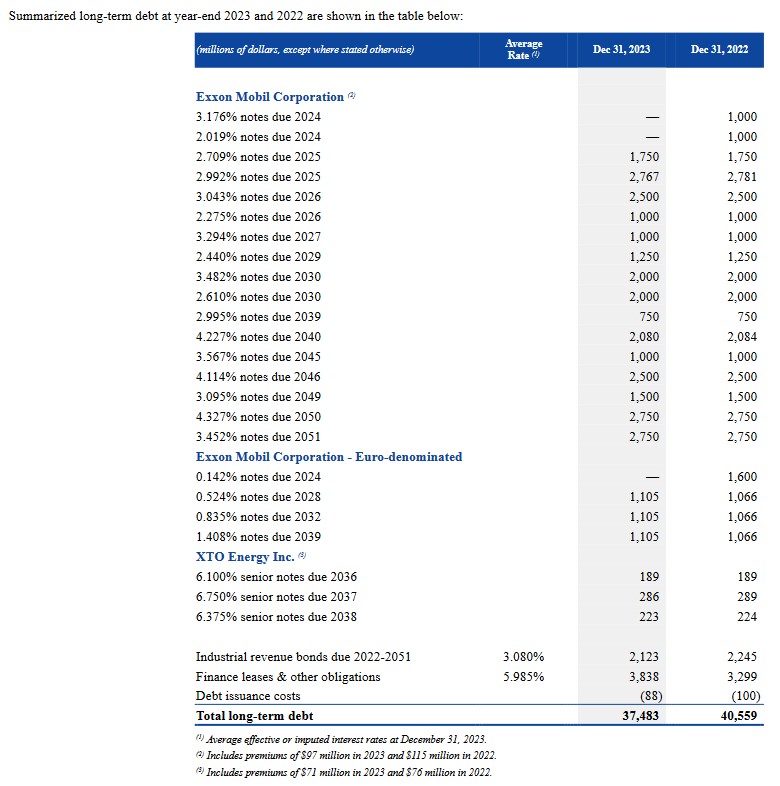
At the end of Q2 2024, XOM’s long-term debt was $36.565B and current notes and loans payable was $6.621B. During the first 6 months of FY2024, XOM repaid $2.771B of short-term debt, $1.142B of long-term debt, and added $0.217B of long-term debt. XOM still has some debt owing in FY2024 but I envision no issues with the repayment of these obligations.
XOM’s debt-to-capital ratio was 14% and the net-debt-to-capital ratio was 6% at the end of Q2 2024. This reflects the YTD debt repayment of $3.9B and a period-end cash balance of $26.5B.
Dividends and Dividend Yield
XOM’s dividend history is accessible here.
XOM distributed dividends of $9.02B, $10.092B, $10.875B, $11.568B, $12.09B, $12.453B, $13.001B, $13.798B, $14.652B, $14.865B, $14.924B, $14.939B, and $14.941B in FY2011 – FY2023. These figures exclude dividend payments to non-controlling interests that are generally under ~$0.5B annually.
In the first half of FY2024, XOM has distributed dividends totaling $8.093B.
XOM will distribute a $0.95/share dividend on September 10, 2024, to shareholders of record at the close of business on August 15, 2024. This marks the 3rd consecutive dividend at this level.
At the end of January 2025, I anticipate XOM will increase its quarterly dividend by $0.03/share to $0.98/share. If this happens, the next 4 quarterly dividend payments should total $3.86 ((2 x $0.95) + (2 x $0.98)). With shares trading at ~$116 as I compose this post on August 2, the forward dividend yield is ~3.33%.
Share Repurchases
In FY2011 – FY2023, XOM repurchased $22.055B, $21.016B, $15.998B, $13.183B, $4.039B, $0.977B, $0.747B, $0.626B, $0.594B, $0.405B, $0.155B, $15.155B, and $17.748B.
The weighted average number of diluted shares outstanding in FY2013 – FY2023 (in millions of shares) is 4,419, 4,282, 4,196, 4,177, 4,256, 4,270, 4,270, 4,271, 4,275, 4,205 and 4,052. This was reduced to 3,998 in Q1 2024 but increased to 4,317 in Q2 with the issuance of shares to acquire PXD. At the end of Q2, however, this had risen to 4,443.
Despite the issuance of shares for this acquisition, XOM remains committed to the repurchase of shares as a component of its capital allocation. In the first half of FY2024, XOM repurchased $8.337B of shares with $5.2B of this in Q2. XOM plans to repurchase $19B of shares in FY2024 and $20B through FY2025.
Valuation
In FY2013 – FY2023, XOM’s P/E levels were 13.21, 11.63, 16.45, 42.18, 27.24, 12.53, 20.28, 52.85, (negative in FY2021), 9.00, and 9.93.
At the time of my December 8, 2023 post, XOM had generated $6.98 and $7.04 in diluted EPS and adjusted diluted EPS in the first 3 quarters of FY2023. It had also generated ~$28.4B of GAAP earnings and ~$26B of Free Cash Flow (FCF). Its debt-to-capital and net debt-to-capital ratios were ~17% and ~4%, respectively, at the end of Q3 2023.
Using the ~$98.40 share price at the time I composed my post and adjusted diluted earnings broker estimates, the following were the forward adjusted diluted PE levels.
- FY2023 – 22 brokers – mean of $9.25 and low/high of $8.90 – $9.94. Using the mean estimate, the forward adjusted diluted PE was ~10.6.
- FY2024 – 23 brokers – mean of $9.45 and low/high of $7.98 – $11.53. Using the mean estimate, the forward adjusted diluted PE was ~10.4.
- FY2025 – 16 brokers – mean of $9.69 and low/high of $7.04 – $12.05. Using the mean estimate, the forward adjusted diluted PE was ~10.2.
The variance between $7.04 in YTD adjusted diluted EPS and the $9.25 mean of FY2023 broker estimates was $2.21. If XOM were to generate $2.25 of adjusted diluted earnings in Q4 2023, FY2023’s adjusted diluted earnings would be $9.29 which was very similar to analyst forecasts. Leaving the forward adjusted diluted PE at ~10.6, we get a ~$98.5 share price ($9.29 x 10.6).
If, however, XOM’s forward adjusted diluted PE were to expand to 12, for example, we would be looking at a ~$111.50 share price ($9.29 x 12).
XOM ended up generating $8.89 of diluted EPS and $9.52 of adjusted diluted EPS in FY2023. Using the ~$98.40 share price at the time of my prior post, XOM’s diluted PE and adjusted diluted PE were ~11.1 and ~10.34.
FY2023 FCF was ~$36.1B and the weighted average diluted shares outstanding for the year was 4.052 million. This gave us ~$8.91 FCF/share. Dividing ~$98.40 by ~$8.91 and XOM’s P/FCF was ~11.04.
Shares now trade at ~$116 and YTD diluted EPS and adjusted diluted EPS are both $4.20. If XOM were to generate ~$4.80 in the second half of FY2024, the FY2024 diluted EPS and adjusted diluted EPS would be ~$9.00. This gives us a forward PE of ~12.9 (~$116/~$9) based on GAAP and non-GAAP EPS estimates.
Using the current ~$116 share price and adjusted diluted earnings broker estimates, the following are the forward adjusted diluted PE levels.
- FY2024 – 25 brokers – mean of $8.78 and low/high of $7.30 – $10.68. Using the mean estimate, the forward adjusted diluted PE is ~13.2.
- FY2025 – 25 brokers – mean of $9.48 and low/high of $5.53 – $11.88. Using the mean estimate, the forward adjusted diluted PE is ~12.2.
- FY2026 – 17 brokers – mean of $10.14 and low/high of $5.43 – $11.81. Using the mean estimate, the forward adjusted diluted PE is ~11.4.
There is a significant disparity in earnings estimates. This may narrow as the brokers revise their estimates after analyzing XOM’s Q2 and YTD2024 results.
In the first half of FY2024, XOM generated FCF of ~$15B when we include working capital outflows of $2.6B driven by higher seasonal cash tax payments. For my current purposes, I am assuming XOM will generate at least another $15B in the second half of the year for a full year total of $30B.
The weighted average number of diluted shares outstanding in Q2 is 4,317 but had risen to 4,443 at the end of Q2. XOM continues to repurchase shares so if it reduces the FY2024 weighted average to 4,385 million shares and we dividend $30B by 4,385 million shares, we get ~$6.84 FCF/share. Divide ~$116 by ~$6.84 and XOM’s P/FCF is ~17.
If my estimates are reasonable accurate, XOM currently looks expensive.
Final Thoughts
Following various changes made for tax planning purposes, I now hold 449 shares in one ‘Core’ account and 745 shares in another ‘Core’ account in the FFJ Portfolio. I also hold an undisclosed number of shares in a retirement account.
XOM was my 14th largest holding when I completed my 2023 Year End FFJ Portfolio Review and my 8th largest holding when I completed my 2024 Mid Year FFJ Portfolio Review. When I completed the 2023 YE and 2024 Mid Year reviews, XOM’s share price was ~$100 and ~$115, respectively.
In my opinion, a good time to invest in great companies is when expectations are low. At the moment, XOM does not appear to have fallen out of favor with investors.
The figures I have used to approximate XOM’s valuation might be ‘out to lunch’. Looking at the current significant disparity in broker estimates, however, suggests I am not the only investor struggling to determine how XOM will perform. Given the volatile nature of the industry, I don’t know how anyone can remotely predict earnings 2 – 3 years into the future…especially if a company is in an industry known to experience volatile conditions.
Since global oil inventories are at a record deficit relative to average levels, I think investor sentiment is insufficiently negative to increase my exposure. I will wait until the industry outlook deteriorates.
I wish you much success on your journey to financial freedom!
Note: Please send any feedback, corrections, or questions to finfreejourney@gmail.com.
Disclosure: I am long XOM.
Disclaimer: I do not know your circumstances and do not provide individualized advice or recommendations. I encourage you to make investment decisions by conducting your research and due diligence. Consult your financial advisor about your specific situation.
I wrote this article myself and it expresses my own opinions. I do not receive compensation for it and have no business relationship with any company mentioned in this article.