![]()
At the time of my July 30, 2025 post, Intact Financial’s (IFC.to) most current financial information was for Q2 and YTD2025.
In my October 20, 2025 post, I disclose the purchase of an additional 100 shares @ ~$259.85 in a ‘Core’ account in the FFJ Portfolio.
On January 19, 2026, I increased my exposure and purchased 100 shares @ $263 in the same ‘Core’ account. I disclose this purchase in my January 19, 2026 post and touch upon the Preferred Metrics to analyze an insurance company. IFC’s website also provides a comprehensive Glossary of GAAP and Non-GAAP financial measures as well as other insurance-related terms used in its financial reports
With the February 10, 2026 release of the Q4 and FY2025 financial statements, I revisit this existing holding.
Note: IFC is listed on the Toronto Stock Exchange in Canada and reports results in Canadian dollars.
Business Overview
The best way to learn about IFC is to review the:
The following, extracted from IFC’s May 21, 2025 Investor Day presentation, reflects the extent to which IFC has rewarded shareholders over the past decade. Past performance is not indicative of future performance. It is, however, difficult to disregard IFC’s track record of success.
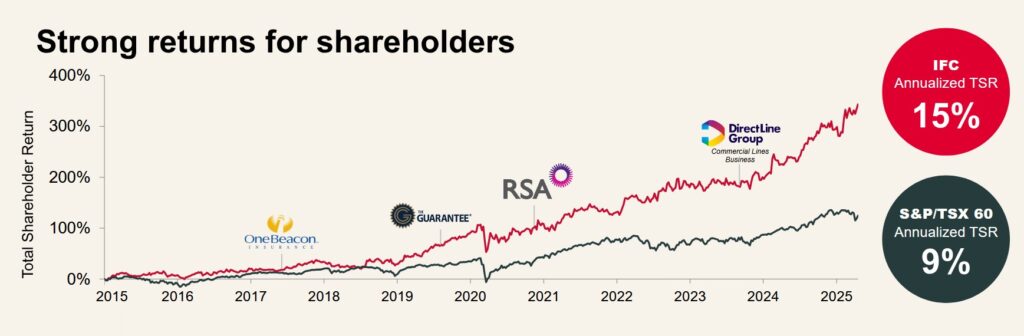
The company consists of a global team of ~32,000 employees and it serves more than 5 million personal, business, and public sector clients. It is the largest provider of Property & Casualty insurance in Canada and has successfully exported its strengths across North America, the UK and Europe. Its growing Commercial and Specialty solutions network spans over 150 countries. Its business has grown organically and through acquisitions. Total annual operating direct premiums written has tripled over the last decade to ~$25B and versus ~$7.07B in FY2012.
In Canada, IFC distributes insurance under the Intact Insurance brand through agencies and a wide network of brokers, including its wholly-owned subsidiary BrokerLink. It also:
- distributes directly to consumers through the belairdirect brand and affinity partnerships; and
- provides exclusive and tailored offerings to high-net-worth customers through Intact Prestige.
In the US, Intact Insurance Specialty Solutions provides a range of Specialty insurance products and services through independent agencies, regional and national brokers, wholesalers and managing general agencies.
Across the UK, Ireland and Europe, IFC provides Personal, Commercial and/or Specialty insurance solutions through the RSA, 123.ie, NIG and FarmWeb brands.
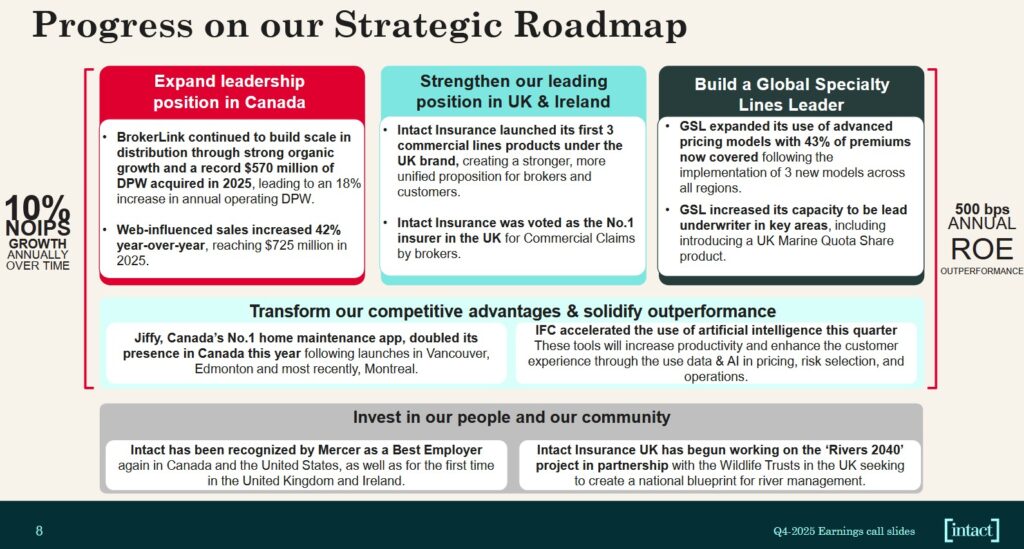
The following reflects how IFC is progressing on its Strategic Roadmap.
Financial Results
Q4 and FYE2025
Information about IFC’s Q4 and FY2025 performance is accessible through the Quarterly Results section of the company’s website.
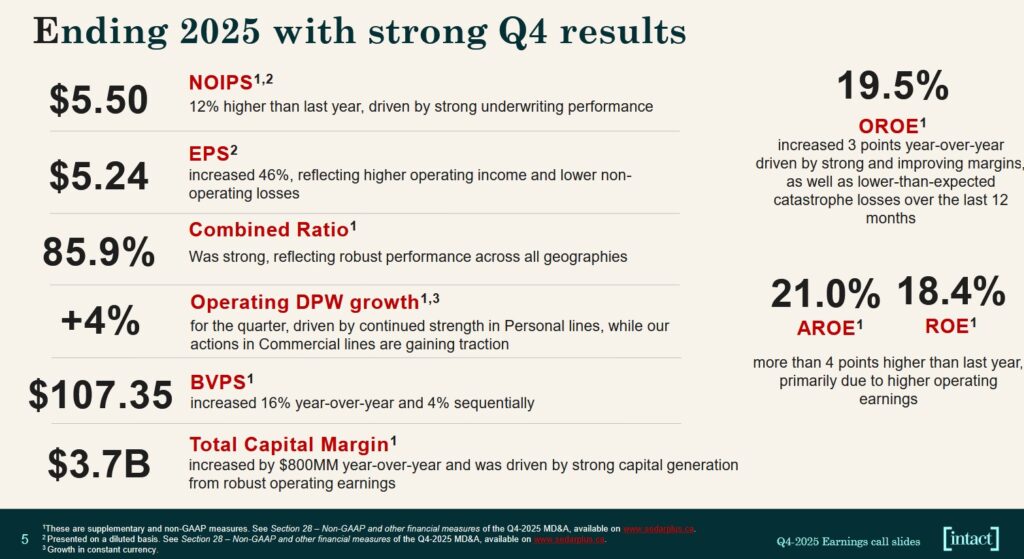
In Q4 2025, IFC delivered its highest-ever annual net operating income per share (NOIPS), driven by strong underwriting performance and favorable market conditions.
NOIPS grew 12% to $5.50, surpassing analyst expectations of ~$4.67 and diluted EPS rose 46% to $5.24.
A strong consolidated combined ratio of 85.9% (an improvement from 86.5% in Q4 2024), indicates robust underwriting profitability across all regions.
The company continues to focus on being a ‘global leader in leveraging data and AI’ with a focus on three areas:
- claims automation (faster processing);
- pricing sophistication (better risk selection); and
- broker productivity (reducing administrative friction).
These AI initiatives are expected to generate over $0.5B in cost savings by 2030. The company is already experiencing over $0.15B in annual recurring benefits.
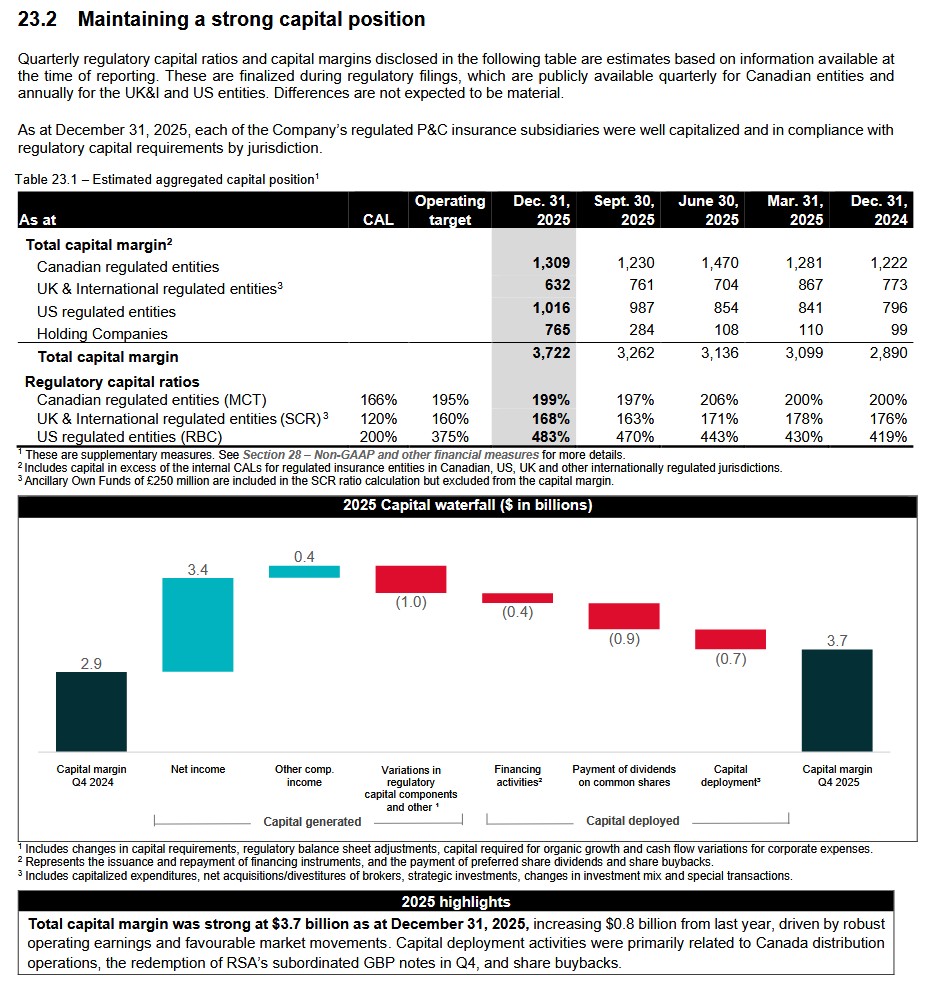
Book Value Per Share (BVPS) increased 16% YoY to $107.35 and total capital margin rose to $3.7B (up from $2.9B the prior year). This provides ‘dry powder’ for future growth and potential M&A.
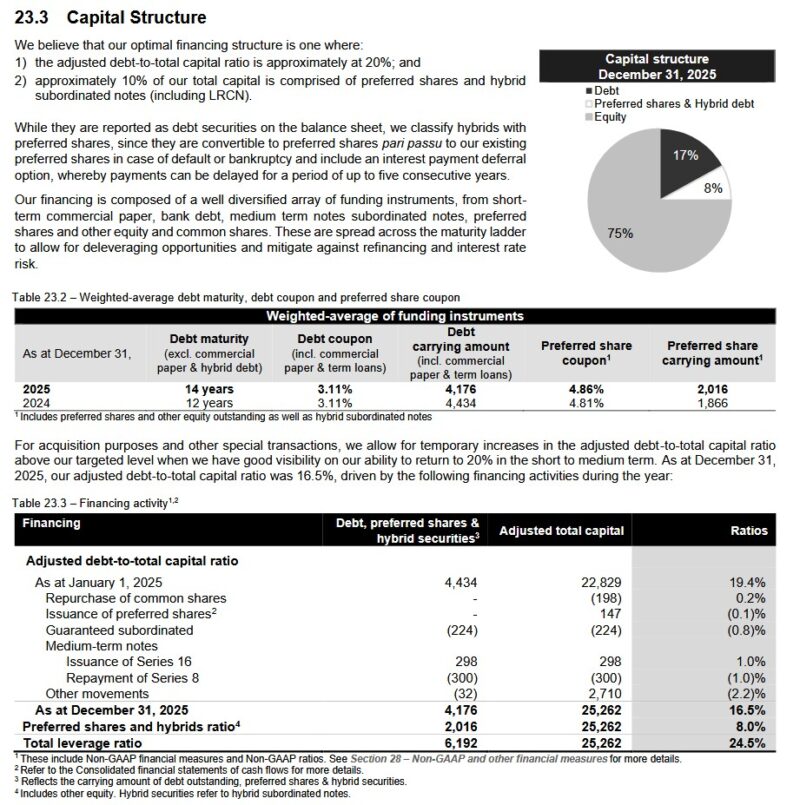
IFC’s adjusted debt-to-total capital ratio improved to 16.5% reflecting the repayment of debt and strong earnings.
When asked about the modest 1% growth in Commercial Lines on the Q4 earnings call, management admitted to ‘intense competition’ for large, high-exposure accounts. They stated they are willing to lose some market share in these specific pockets to maintain their target combined ratio which was 77.1% in Q4.
On the Q4 earnings call, analysts questioned the longevity of high premium rates in Canadian Personal Auto. Management noted that while they are seeing 2% unit growth, they expect the high single-digit to low double-digit growth to continue through 2026 to offset ongoing inflationary pressures and rising theft costs. Proactive measures, such as requiring anti-theft devices and working with law enforcement, are starting to help stabilize the auto combined ratio.
Management explained that the negative 2% Direct Premiums Written (DPW) growth in the UK & Ireland is the result of a deliberate practice of walking away from unprofitable, large-account business. Management expressed confidence that growth will turn positive by the end of 2026 as the portfolio stabilizes.
The rebranding to ‘Intact Insurance’ in UK & Ireland is expected to streamline operations and improve broker recognition, aiding the shift toward a 90% target combined ratio in the region.
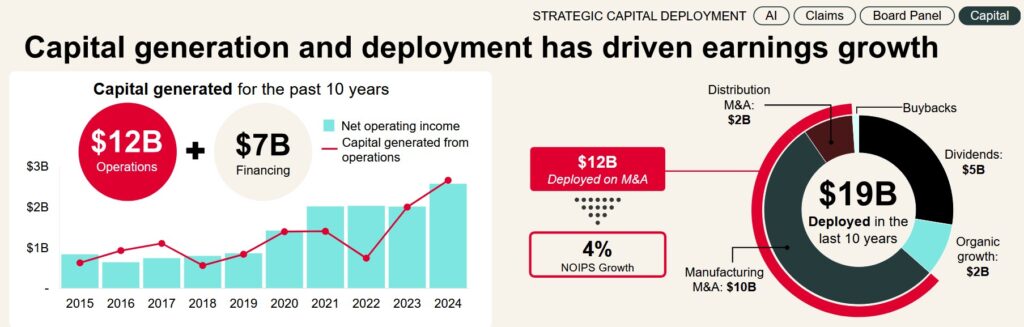
Capital Deployment
Several pages, commencing on page 122 of 147 in IFC’s May 21, 2025 Investor Day presentation, are devoted to the topic of capital deployment.
Underwriting Ratios
I pay particularly close attention an insurance company’s Operating Combined Ratio (OCR) track record.
This is a crucial metric in the insurance industry that measures an insurance company’s profitability and operational efficiency by comparing its claims and expenses to its earned premiums. It is the sum of the loss ratio (claims paid divided by earned premiums) and the expense ratio (operating expenses divided by earned premiums).
The OCR consists of 2 components:
- claims ratio
- expense ratio
The OCR is important because it is a Profitability Indicator. An OCR below 100% means the insurer is making an underwriting profit, paying out less in claims and expenses than it earns in premiums. A ratio above 100% means an underwriting loss, suggesting the insurer is paying out more than it receives from premiums. Even if above 100%, however, an insurer might still be profitable due to investment income, which is not included in this ratio.
It is also an indicator of an insurance company’s operational efficiency. It reflects how well the insurer controls claims costs and operating expenses. A lower ratio indicates better cost management and underwriting discipline, providing insight into the company’s operational effectiveness.
This metric is typically expressed as a percentage. It is a measure of profitability used by an insurance company to gauge how well it is performing in its daily operations. Many insurance companies believe this ratio is the best way to measure success because it does not include investment income. It only includes profit earned through efficient management. This ratio is calculated by taking the sum of incurred losses and expenses and then dividing them by the earned premium.
IFC’s OCR is generally well below 100%.
Capital Structure
IFC has a proven and consistent capital management strategy. Management believes that its optimal financing structure is:
- 70% equity;
- 20% adjusted debt-to-total capital ratio; and
- ~10% is comprised of preferred shares and hybrid subordinated notes including Limited Recourse Capital Notes (LRCN).
For acquisition purposes and other special transactions, IFC allows for temporary increases in the adjusted debt-to-total capital ratio above its targeted level when it has good visibility on the company’s ability to return to 20% in the short to medium term.
Section 23 – Capital Management in Management’s Discussion and Analysis for the year ended December 31, 2025 goes into considerable detail about IFC’s capital management framework.
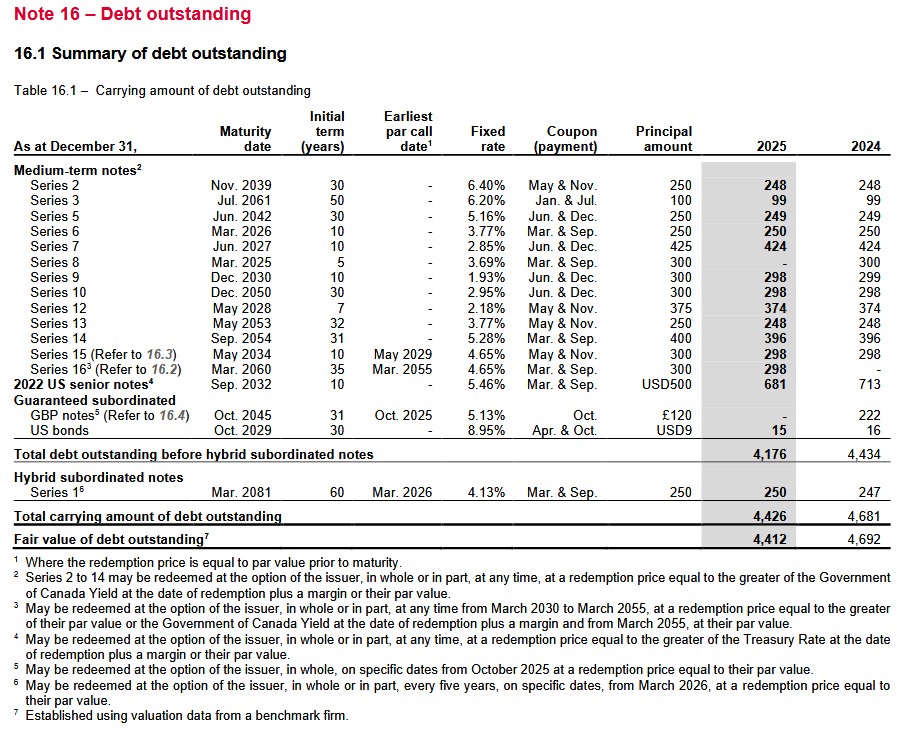
Looking at IFC’s senior and subordinated debt we see the maturity dates are well staggered.
Maintaining a strong capital position is a key priority. IFC’s capital ratios at the end of Q2 2025 are well above the Company Action Levels (CALs). The CALs are thresholds below which regulator notification is required together with a company action plan to restore capital levels. The average CAL for all regulated Canadian insurance entities is 169% Minimum Capital Test (Canada) (MCT). The CAT varies by legal Canadian entities. The CAL is 200% Risk-Based Capital (US) (RBC) for regulated insurance entities in the US and 120% Solvency Capital Requirement (Europe) (SCR) for those in the UK & Ireland.
Capital Allocation
On the Q4 earnings call, management stated that it continues to prioritize organic growth and strategic M&A. The pipeline for acquisitions remains active, particularly in Global Specialty Lines. There is also potential for further consolidation in Canada. IFC, however, remains highly disciplined on valuation.
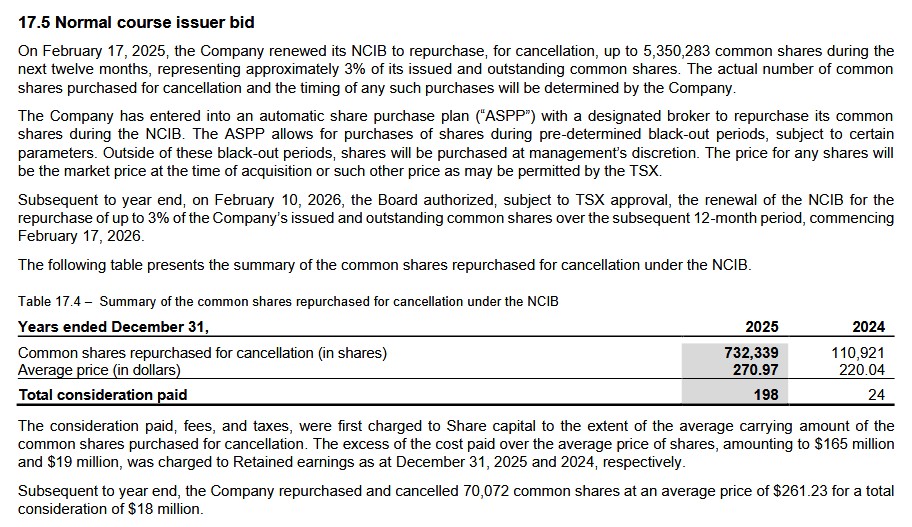
Aggressive share buybacks are not a priority although selective buybacks remain an option.
Risk Assessment
The following table is a summary of IFC’s outstanding debt at FYE2024 and FYE2025. IFC’s debt maturity schedule is well staggered.
It is imperative that we not overlook the risk aspect of an investment. This is why I pay particularly close attention to the ratings and outlooks assigned by rating agencies.
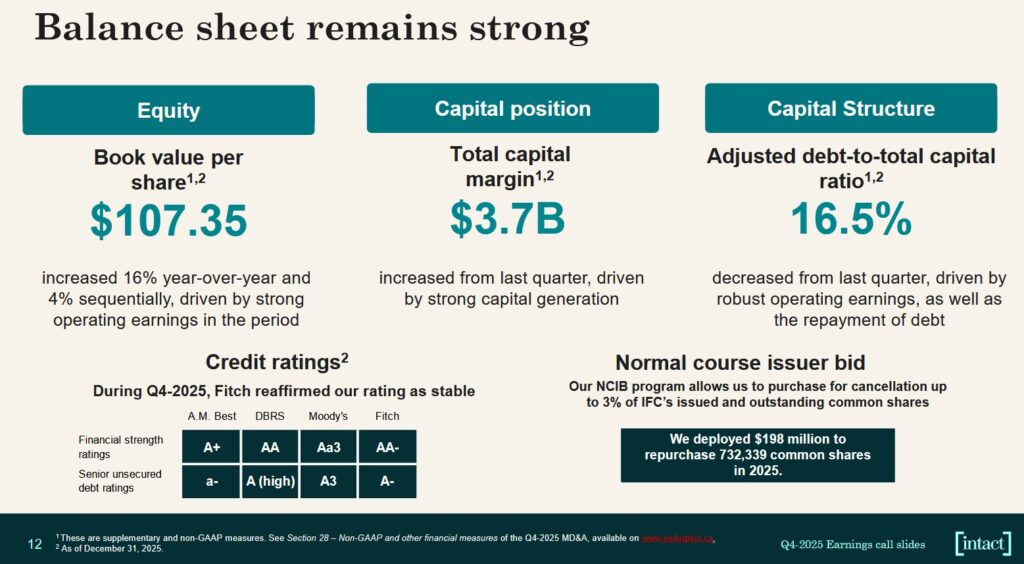
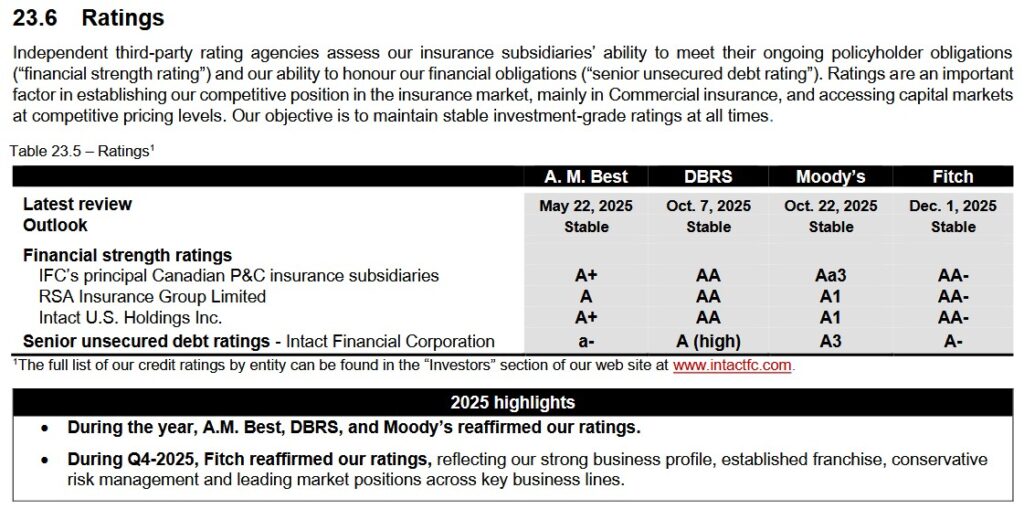
A comprehensive list of IFC’s ratings and outlooks is accessible here.
I focus on the senior unsecured debt ratings assigned to Intact Financial Corporation because this is the publicly-traded company in which I hold shares. As a shareholder, I am exposed to the most risk in the event a company becomes insolvent. I, therefore, pay particularly close attention to the credit ratings assigned to a company’s unsecured long-term debt. If credit rating agencies assign ratings at the lowest investment grade level then I deem my credit risk as a shareholder to be non-investment grade.
IFC’s assigned senior unsecured long-term debt ratings are all investment grade.
- DBRS’s rating is the top tier of the upper-medium grade investment-grade category. It is one tier higher than at the time of my prior review.
- Moody’s, A. M. Best’s, and Fitch’s rating is the bottom tier of the upper-medium grade investment-grade category. On October 8th 2024, Moody’s upgraded the financial strength rating of
IFC’s principal Canadian P&C insurance subsidiaries from A1 to Aa3 and its senior unsecured debt rating from Baa1 to A3.
All ratings define IFC as having a strong capacity to meet its financial commitments. It is, however, somewhat more susceptible to the adverse effects of changes in circumstances and economic conditions than obligors in higher-rated categories.
Dividends and Share Repurchases
Dividend and Dividend Yield
Fixating on dividend metrics is a fundamentally flawed way by which to assess an investment opportunity. The focus should be on risk and total potential investment return. Nevertheless, IFC’s dividend history is accessible here if this is of interest to you.
IFC’s next quarterly dividend of $1.47/share is payable on March 31, 2026 to shareholders of record on March 17, 2026.
Share Repurchases
IFC’s weighted-average number of common shares outstanding in FY2011 (in millions) was 115. The weighted-average diluted number of common shares outstanding (in millions) in FY2025 is 178.5. Although IFC repurchases shares, the increase from FY2011 is primarily the result of IFC issuing shares to fund acquisitions.
Valuation
On February 11, I purchased shares @ $254.34. Using the current forward-adjusted diluted EPS broker estimates, the forward-adjusted diluted PE levels are:
- FY2026 – 13 brokers – mean of $17.55 and low/high of $16.55 – $18.12. The forward adjusted diluted PE is ~14.5.
- FY2027 – 13 brokers – mean of $18.78 and low/high of $17.21 – $20.28. The forward adjusted diluted PE is ~13.5.
These estimates will likely change slightly over the next few days given the recent Q4 and FY2025 earnings release.
In my January 19, 2026 post I reflect the following:
Using my ~$263 purchase price and current forward-adjusted diluted EPS broker estimates, the forward-adjusted diluted PE levels are:
- FY2025 – 13 brokers – mean of $18.34 and low/high of $18.04 – $18.90. The forward adjusted diluted PE is ~14.34.
- FY2026 – 13 brokers – mean of $17.49 and low/high of $16.79 – $18.04. The forward adjusted diluted PE is ~15.04.
- FY2027 – 11 brokers – mean of $18.68 and low/high of $17.33 – $19.76. The forward adjusted diluted PE is ~14.08.
At the time of my October 20, 2025 post, I used my ~$259.85 purchase price and current forward-adjusted diluted EPS broker estimates giving me the following forward-adjusted diluted PE levels:
- FY2025 – 13 brokers – mean of $17.65 and low/high of $16.70 – $18.56. The forward adjusted diluted PE is ~14.7.
- FY2026 – 13 brokers – mean of $17.35 and low/high of $16.70 – $17.90. The forward adjusted diluted PE is ~15.
- FY2027 – 8 brokers – mean of $18.64 and low/high of $17.71 – $19.29. The forward adjusted diluted PE is ~13.9.
Final Thoughts
Management remains confident in the company’s ability to:
- sustain annual ROE in the upper teens;
- deliver at least 500 bps of ROE outperformance every year; and
- deliver double-digit net operating income per share growth on an annual basis in the next decade.
My long-term outlook for the company is the same as what I reflect in my January 19, 2026 post.
When I completed my 2025 Mid-Year Portfolio Review, IFC was my 28th largest holding. In my 2025 Year-End Investment Holdings Review, IFC was my 24th largest holding. At the time of that review, IFC’s share price was CDN~$285.73.
I want to generate attractive long-term rates of return, and therefore, try to acquire shares in great companies that appear to have temporarily fallen out of favor. IFC currently appears to be such a company despite generating strong results.
On February 11, 2026 I increased my exposure with a 50 shares purchase @ $254.34 in a ‘Core’ account in the FFJ Portfolio. My exposure now consists of 407 shares in a ‘Core’ account and 674.4287 shares in another ‘Core’ account.
I wish you much success on your journey to financial freedom!
Note: Please send any feedback, corrections, or questions to finfreejourney@gmail.com.
Disclosure: I am long IFC.
Disclaimer: I do not know your circumstances and do not provide individualized advice or recommendations. I encourage you to make investment decisions by conducting your research and due diligence. Consult your financial advisor about your specific situation.
I wrote this article myself and it expresses my own opinions. I do not receive compensation for it and have no business relationship with any company mentioned in this article.