I can not justify adding to my Moody’s (MCO) exposure because of its rich valuation. As a result, I must exercise patience if I want to acquire MCO shares to replace the shares our tax accountants recommended I sell in early June 2024 because of the changes in the taxation of capital gains introduced by the Canadian Federal government.
Following the sale of 250 shares in a ‘Core’ account in the FFJ Portfolio at ~$406.39 on June 5, we hold 410 shares in a ‘Core’ account in the FFJ Portfolio.
I last reviewed MCO in this January 31, 2023 post at which time it had just released Q4 and FY2022 results. Fast forward and we now have Q2 and YTD2024 results, revised FY2024 guidance, and shares now trade at ~$437 as I finalize this post on July 26.
Business Overview
Moody’s employs ~15,000 across more than 40 countries and consists of two reportable segments.
Moody’s Analytics (MA)
This segment is comprised of:
- three cloud-based SaaS businesses serving banking, insurance and KYC workflows (Decision Solutions);
- a fixed income and economic research business (Research & Insights); and
- a data business powered by the world’s largest database on companies and credit (Data & Information).
Moody’s Investors Service (MIS)
MIS publishes credit ratings and provides assessment services on a wide range of debt obligations, programs and facilities, and the entities that issue such obligations in markets worldwide, including various corporate, financial institution and governmental obligations, and structured finance securities.
The FY2023 Form 10-K which is accessible through the SEC Filings section of the company’s website provides a good overview of the company and risks.
Financials
Q2 and YTD2024 Results
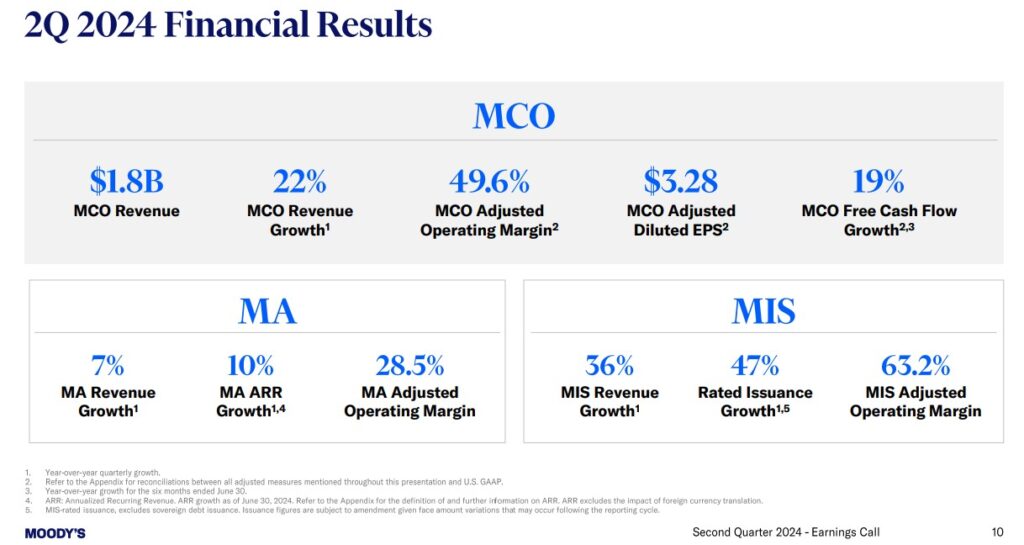
Material pertaining to MCO’s Q2 and YTD2024 results is accessible here. The following reflects a very high level overview of MCO’s Q2 results. More granular information is provided in the financials and earnings presentation.
Operating Cash Flow (OCF), CAPEX, and Free Cash Flow (FCF)
In FY2012 – FY2023, MCO generated the following:
- OCF (in billions of $) was $0.823, $0.927, $1.019, $1.198, $1.259, $0.755, $1.461, $1.675, $2.146, $2.005, $1.474, and $2.151.
- CAPEX (in millions of $) was $45, $42, $75, $89, $115, $91, $91, $69, $103, $139, $283, and $271.
- FCF (in billions of $) was $0.778, $0.885, $0.944, $1.109, $1.144, $0.664, $1.370, $1.606, $2.043, $1.866, $1.191, and $1.880.
Return On Invested Capital (ROIC)
MCO’s ROIC (%) in FY2018 – FY2023 is 26.09, 24.59, 25.41, 24.48, 14.75, and 17.20.
High quality companies often generate a high ROIC. If a company generates a high ROIC, it needs to invest less to achieve a certain growth rate thus reducing the need for external capital.
A company that generates $0.15/profit for every $1 invested, for example, achieves a ROIC of 15%. I consider a ~15%+ ROIC to be a reasonable minimum threshold because most of the time, a company’s cost of capital will be lower than this level. MCO’s ROIC in FY2022 – FY2023 has fallen relative to prior years but I envision its ROIC going forward will be above 15%.
When a company consistently generates a high ROIC over the long term and it is growing its revenue, it can reinvest a portion of its profits under favorable conditions thereby leading to a compounding effect. I would much rather invest in a growing company that can reinvest to create greater shareholder value than to invest in a company that has limited growth opportunities and thus chooses to distribute a growing dividend.
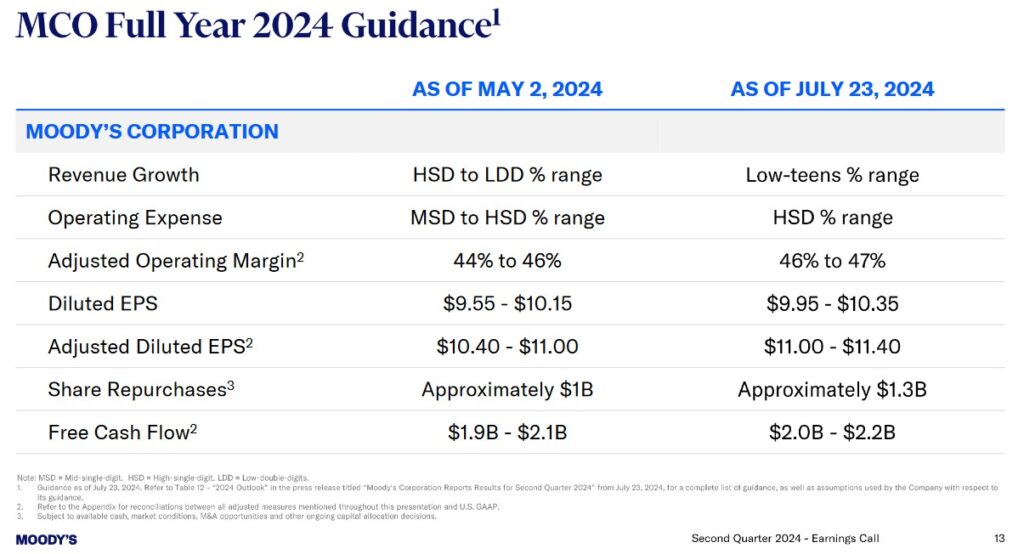
FY2024 Outlook
MCO has adjusted its FY2024 guidance as follows:
Credit Ratings
There is no change to MCO’s senior unsecured domestic long-term debt ratings and outlook.
- S&P Global – BBB+ with a stable outlook; and
- Fitch – BBB+ with a stable outlook;
Both are at the top of the lower medium-grade investment-grade tier. These ratings define MCO as having an ADEQUATE capacity to meet its financial commitments. However, adverse economic conditions or changing circumstances are more likely to lead to MCO having a weakened capacity to meet its financial commitments.
The following schedule of total indebtedness is found on page 36 of 86 in the Q2 2024 Form 10-Q.
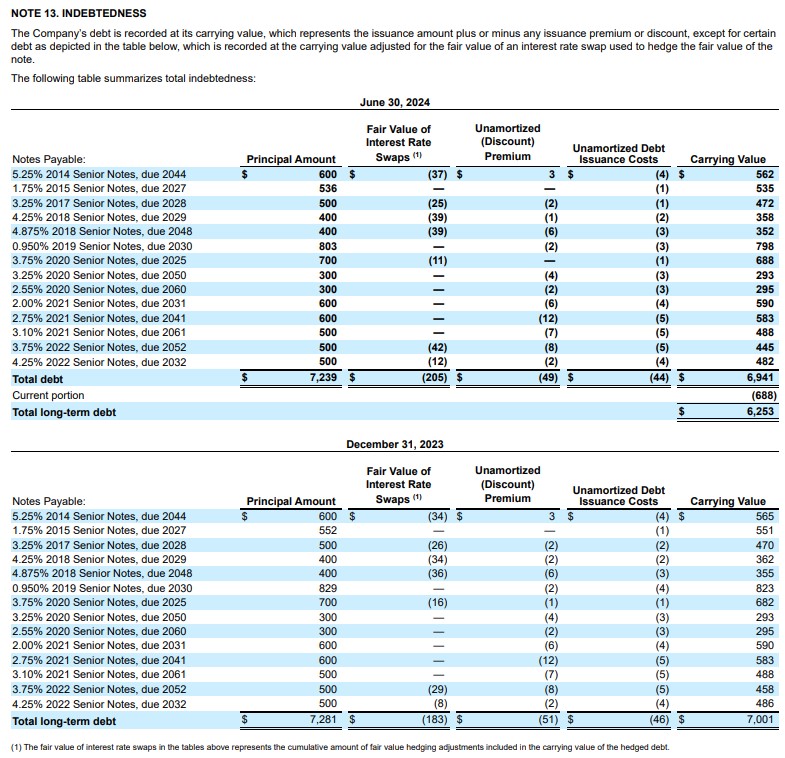
The rating assigned to each indebtedness is accessible here.
MCO’s credit risk is acceptable from my perspective.
Dividend and Dividend Yield
Dividend distributions are the 3rd priority in MCO’s capital allocation priorities.
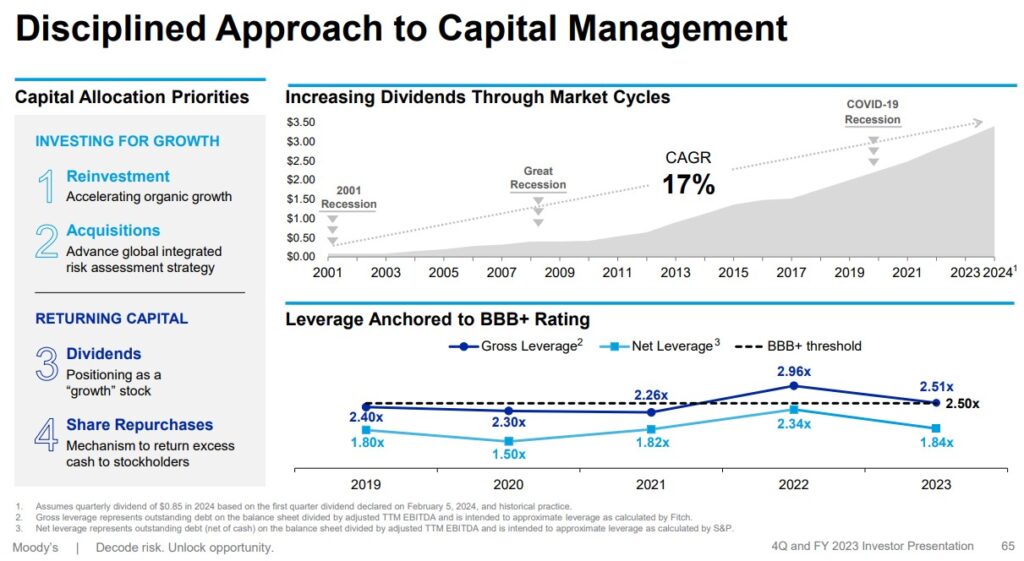
MCO is positioned as a ‘growth’ stock so the unappealing dividend metrics may dissuade some investors from investing in the company. Investors, however, should focus on an investment’s total potential return.
MCO’s dividend history reflects annual dividend increases starting in 2011 following a dividend freeze that was precipitated by challenging business conditions during The Financial Crisis.
On July 22, 2024, MCO’s Board approved the declaration of a quarterly dividend of $0.85/share payable September 6, 2024 to shareholders of record at the close of business on August 16, 2024.
MCO’s diluted weighted average number of shares outstanding during FY2011 – FY2023 (in millions of shares) are approximately 229, 227, 224, 215, 203, 195, 194, 194, 192, 189, 188, and 185. In Q2 2024 this had been reduced to 183.
The following reflects MCO’s share repurchase activity in Q2.
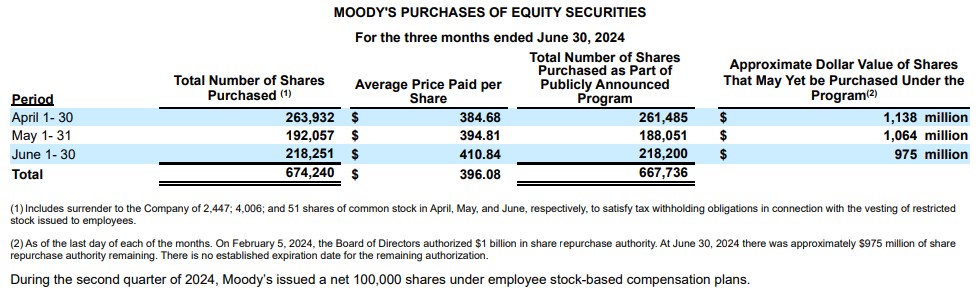
On February 5, 2024, MCO’s Board approved an additional $1B in share repurchase authority. At the end of Q2 2024, ~$0.975B of repurchase authority remained. There is no established expiration date for the remaining authorization.
Valuation
When I reviewed MCO on September 9, 2021, management’s adjusted diluted EPS guidance was $11.55 – $11.85. Using a ~$382 share price and the $11.70 mid-point of guidance the forward adjusted diluted PE was ~32.7. In addition, the following were the FY2021 – FY2023 adjusted diluted EPS analyst estimates:
- FY2021 – 16 brokers – mean of $11.87 and low/high of $11.69 – $12.52. Using the mean estimate, the forward adjusted diluted PE is ~32.2.
- FY2022 – 17 brokers – mean of $12.40 and low/high of $11.54 – $13.50. Using the mean estimate, the forward adjusted diluted PE is ~30.8.
- FY2023 – 12 brokers – mean of $14.01 and low/high of $13.05 – $15.25. Using the mean estimate, the forward adjusted diluted PE is ~27.3.
At the time of my October 30th review, MCO was trading at ~$404 and management had raised FY2021 adjusted diluted EPS guidance to $12.15 – $12.35. Using the broker guidance available at the time, I arrived at the following:
- FY2021 – 17 brokers – mean of $12.04 and low/high of $11.70 – $12.67. Using the mean estimate, the forward adjusted diluted PE is ~33.6.
- FY2022 – 17 brokers – mean of $12.46 and low/high of $11.62 – $13.61. Using the mean estimate, the forward adjusted diluted PE is ~32.4.
- FY2023 – 14 brokers – mean of $14.03 and low/high of $13.04 – $15.72. Using the mean estimate, the forward adjusted diluted PE is ~29.
Shares were trading at ~$332.50 when I wrote my February 12, 2022 review. The forward adjusted diluted PE levels using current broker guidance were:
- FY2022 – 16 brokers – mean of $12.66 and low/high of $11.87 – $13.60. Using the mean estimate, the forward adjusted diluted PE is ~26.3.
- FY2023 – 14 brokers – mean of $14.11 and low/high of $13.42 – $15.45. Using the mean estimate, the forward adjusted diluted PE is ~23.6.
- FY2024 – 4 brokers – mean of $16.23 and low/high of $14.90 – $17.55. Using the mean estimate, the forward adjusted diluted PE is ~20.5.
When I wrote my May 4 post, I had recently added to my exposure at $300.88/share. Management’s FY2022 diluted EPS and adjusted diluted EPS guidance ranges were $9.85 – $10.35 and $10.75 – $11.25, respectively. Using a $10.10 diluted EPS mid-point, the forward diluted PE was ~30 and the forward adjusted diluted PE was ~27.4 based on $11 in adjusted diluted EPS.
The forward adjusted diluted PE levels using broker guidance at the time were:
- FY2022 – 18 brokers – mean of $11.28 and low/high of $10.85 – $12.90. Using the mean estimate, the forward adjusted diluted PE is ~26.7.
- FY2023 – 18 brokers – mean of $12.99 and low/high of $12.31 – $14.20. Using the mean estimate, the forward adjusted diluted PE is ~23.2.
- FY2024 – 9 brokers – mean of $15.04 and low/high of $13.81 – $17.45. Using the mean estimate, the forward adjusted diluted PE is ~20.
Management’s FY2022 revised diluted EPS outlook at the time of my July 26, 2022 review was $8.10 – $8.60; its revised adjusted diluted EPS outlook was $9.20 – $9.70. Using my $286.14 purchase price and an $8.35 diluted EPS mid-point, the forward diluted PE was ~34.3 and the forward adjusted diluted PE was ~30.3 based on $9.45 in adjusted diluted EPS.
The forward adjusted diluted PE levels using current broker guidance were:
- FY2022 – 19 brokers – mean of $10.13 and low/high of $9.53 – $11.15. Using the mean estimate, the forward adjusted diluted PE is ~28.2.
- FY2023 – 19 brokers – mean of $11.91 and low/high of $11.17 – $13.60. Using the mean estimate, the forward adjusted diluted PE is ~24.
- FY2024 – 10 brokers – mean of $13.99 and low/high of $12.58 – $16.70. Using the mean estimate, the forward adjusted diluted PE is ~20.5.
I expected these broker estimates to be revised lower over the coming days thereby resulting in valuation levels somewhat similar to those derived using management’s FY2022 guidance.
When I wrote my January 31, 2023 post, MCO had just reported $7.44 and $8.57 in FY2022 diluted EPS and adjusted diluted EPS. With shares trading at ~$323, the diluted PE and adjusted diluted PE levels were ~43.4 and ~37.7.
Management’s FY2023 diluted EPS and adjusted diluted EPS outlook were $8.05 – $8.55 and $9.00 – $9.50. Based on the ~$323 share price, the forward diluted PE range was ~37.8 – ~40 and the forward adjusted diluted PE range was ~34 – ~36.
Broker-adjusted diluted EPS estimates were likely to be adjusted over the coming days but using currently available estimates, the forward adjusted diluted PE ratios were:
- FY2023 – 19 brokers – mean of $9.32 and low/high of $7.68 – $10.00. Using the mean estimate, the forward adjusted diluted PE is ~34.7.
- FY2024 – 17 brokers – mean of $11.27 and low/high of $8.82 – $12.20. Using the mean estimate, the forward adjusted diluted PE is ~28.7.
- FY2025 – 5 brokers – mean of $13.49 and low/high of $12.90 – $14.80. Using the mean estimate, the forward adjusted diluted PE is ~24.
Analysts had been gradually lowering their FY2023 earnings estimates. Following the release of MCO’s FY2023 outlook, I anticipated some brokers would lower their FY2023 and FY2024 estimates; I placed little credence in FY2025 estimates because much can change in 2 years and only 5 brokers had provided estimates. I thus concluded that the forward adjusted diluted PE levels reflected above would increase slightly thereby making MCO’s valuation more unattractive.
As I finalize this post on July 26, 2024, shares trade at ~$437. The forward valuations using the currently available adjusted diluted broker estimates are:
- FY2024 – 19 brokers – mean of $11.29 and low/high of $10.92 – $11.62. Using the mean estimate, the forward adjusted diluted PE is ~38.7.
- FY2025 – 20 brokers – mean of $12.80 and low/high of $11.90 – $13.90. Using the mean estimate, the forward adjusted diluted PE is ~34.
- FY2026 – 13 brokers – mean of $14.62 and low/high of $13.30 – $15.75. Using the mean estimate, the forward adjusted diluted PE is ~30.
Management’s FY2024 adjusted diluted EPS guidance is $11.00 – $11.40 thus giving us a ~38.3 – ~40 adjusted diluted PE range.
The FY2024 FCF guidance is $2B – $2.2B. If we use 183 million diluted weighted average number of shares outstanding as the average for FY2024, we get a FCF/share range of ~$11 – ~$12. Using the current ~$437 share price, we get a forward P/FCF range of ~36.4 – ~39.7.
Final Thoughts
When I completed my 2023 Year End FFJ Portfolio Review, MCO was my 6th largest holding. Following the sale of 250 shares on June 5 for tax planning reasons, however, MCO had become my 13th largest holding when I completed my my 2024 Mid Year FFJ Portfolio Review.
As noted earlier, I would like to restore my exposure to the level prior to the June 5 sale. Based on the FY2024 adjusted diluted EPS outlook of $11.00 – $11.40 and what I deem to be a more reasonable adjusted diluted PE level of ~33, I would want the share price to retrace to ~$363 or less. Using my forecast FCF/share range of ~$11 – ~$12, a ~$363 share price would give us a P/FCF range of ~30.3 – ~33. This might be wishful thinking but I initiated a MCO position on October 26, 2018 @ $143.61. I also acquired 410 shares at various times in 2022 when they were undervalued so anything is possible.
I remain cautious in this environment and have raised liquidity in the hope that I will be able to acquire shares in companies that appeal to me at more favorable valuations. MCO is one such company.
I wish you much success on your journey to financial freedom!
Note: Thanks for reading this article. Please send any feedback, corrections, or questions to finfreejourney@gmail.com.
Disclosure: I am long MCO.
Disclaimer: I do not know your circumstances and am not providing individualized advice or recommendations. I encourage you not to make any investment decisions without conducting your research and due diligence. You should also consult your financial advisor about your specific situation.
I wrote this article myself and it expresses my own opinions. I am not receiving compensation for it and have no business relationship with any company whose stock is mentioned in this article.