![]()
In my September 3, 2025 Intuitive Surgical (ISRG) post, I disclose the purchase of an additional 194 shares @ $447.26 in 2 different ‘Core’ accounts within the FFJ Portfolio.
Following the release of Q3 and YTD2025 results, I published my October 23, 2025 post at which time I conclude shares are richly valued @ ~$543.
With the release of Q4 and FY2025 results following the January 22, 2026 market close, this is an opportune time to revisit what was my 3rd largest holding when I completed my 2025 Year-End Investment Holdings Review; I held 844 shares in two different accounts. In addition to these shares, 2 young investors I am helping on their journey to financial freedom also hold ISRG shares. I exclude their holdings, however, in determining my exposure to companies in which we we mutually have a position.
Business Overview
Please reference prior ISRG posts that are accessible through The FFJ Archives section of this site.
I encourage you to review the Overview section commencing on page 26 of 58 in the Q3 2025 Form 10-Q. This section provides a good overview of the company, a trade and tariffs update, an overview of the macroeconomic environment, and an explanation of the company’s business model. The company’s website and the FY2024 Form 10-K are also very good sources of information.
ISRG used to be ‘the only game in town’ but competition is increasing. With an increase in competition, the expectation is for price reductions and an increase in innovation. Nevertheless, ISRG is investing heavily in research and development to remain the industry leader. While this bulletin from the American College of Surgeons is from May 2023, it provides an indication of how the overall use of robotic surgery is likely to continue to grow significantly over the coming years.
Financials
Q4 and FY2025 Results
Release of the FY2025 Form 10-K should occur within the next couple of weeks. In the interim. I use the most current financial information contained within the January 22, 2026 Earnings Release (Form 8-K) that is accessible through the SEC Filings section of the company’s website.
FY2025 revenue was ~$10.1B, up 21% YoY.
Management reports Free Cash Flow of $2.5B for the year. This, however, does not exclude share-based compensation (SBC); I deduct SBC in my modified method of calculating a company’s FCF.
In Q4 2025, ~81% of ISRG’s ~$2.87B revenue was recurring.
ISRG repurchased $2.3B in shares in FY2025 and ended with ~$9.034B in cash, cash equivalents, and short-term investments.
In 2025, da Vinci procedures increased ~18% with multiport procedures growing ~17%, and single port procedures growing ~87%. Combined with ~51% ION procedure growth, total procedures grew ~19% for the year.
In the US, da Vinci procedures increased ~15% to more than 2,000,000. General surgery procedures continue to experience robust growth. These procedures encompass a broad range of operations on organs and structures in the abdomen, skin, soft tissues, endocrine system, head/neck, and digestive tract. These include appendectomy (appendix removal), cholecystectomy (gallbladder removal), hernia repairs (inguinal, ventral), colectomy or colorectal resection (for cancer, diverticulitis, IBD), hemorrhoidectomy, and skin lesion excisions.
Internationally, da Vinci procedures increased 23% to over 1.1 million with growth rates of 21% in Europe, 24% in Asia, and 27% in the rest of world markets. Procedures outside the US accounted for ~35% of global procedures which reflects clinical demand, improved market access, broad training initiatives, and supportive economics.
In 2025, ISRG placed 1,721 da Vinci systems and global system utilization increased 3% across ISRG’s da Vinci platforms (3% growth in multiport, 29% in single port, and 9% in ION).
During the Q&A portion of the Q4 2025 earnings call with analysts, the focus was on tariff impacts, procedure growth drivers, procedure mix shifts (margin pressure from lower bariatric/cholecyst utilization offset by SP growth), international momentum, product adoption, competitive dynamics, and the FY2026 outlook.
Tariffs resulted in a 95 bps impact on Q4 gross margins (67.8% vs. 69.5% prior year). Management, however, noted offsets from cost savings but the expectation is for margin pressure to continue in FY2026.
Competition in China continues to intensify, particularly in Q4 2025, leading to more intense pricing with provincial tenders favoring local suppliers and lower pricing. This has impacted ISRG’s system win ratio. ISRG, however, continues to compete using locally manufactured Xi systems. With a strong local team and ecosystem, management believes ISRG can compete effectively at price points healthy for both customers and the company.
In Q4 2025, ISRG received FDA clearance for several cardiac procedures on da Vinci 5 with non-force feedback instruments. ISRG views cardiac surgery as a long-term, high-potential opportunity in robotic-assisted minimally invasive procedures. The plan is for a ‘measured rollout’ to support training, education, and adoption given procedure complexity.
Operating expenses in Q4 2025 increased 16% YoY, driven by a $70 million donation to the Intuitive Foundation, increased headcount, higher variable compensation costs, and increased facility costs. This was partially offset by lower legal expenses.
The increased donation to the Intuitive Foundation (versus $0.045B in Q4 2024) reflects a decision to make a multi-year donation given the impact of new U.S. tax rules effective in 2026.
ISRG added ~200 employees in Q4, primarily in core commercial and engineering functions.
By the end of Q1 2026, ISRG expects to close the transaction to go direct in Italy, Spain, and Portugal thus resulting in a ~250 increase in headcount.
Other income of $86 million in Q4 2025 versus $93 million in Q3 2025 is the result of a lower interest rate environment.
Without the FY2025 Form 10-K, we do not know how ISRG invested its liquidity at FYE2025. The following table extracted from the Q3 2025 Form 10-Q, however, provides an indication of the conservative and liquid nature of ISRG’s cash, cash equivalents, and investments.
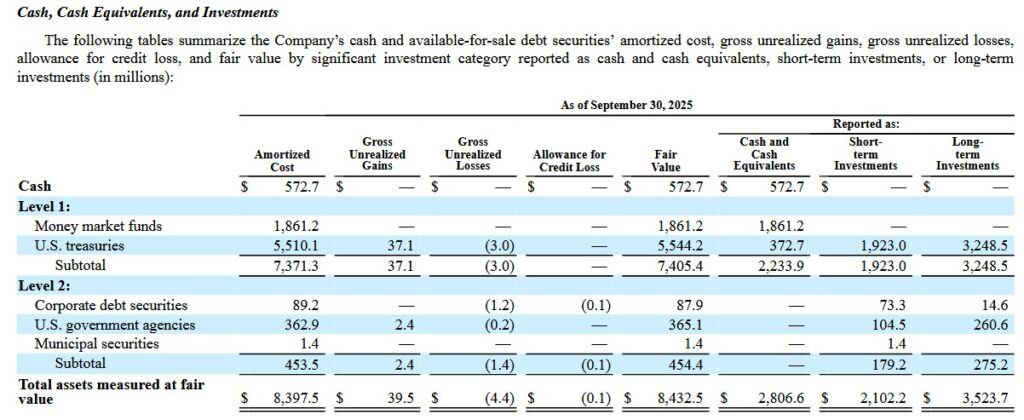
Level 1 and Level 2 investments refer to categories in the fair value hierarchy under U.S. GAAP (ASC 820). They are used to classify financial assets based on valuation input observability.
Level 1 investments are assets valued using quoted prices in active markets for identical instruments. Examples include publicly traded stocks or mutual funds with real-time exchange prices. They carry the lowest valuation risk due to high liquidity and transparency.
Level 2 investments use observable inputs other than Level 1 quotes. Examples include quoted prices for similar assets, interest rate curves, or model-derived values with market-corroborated data. Corporate bonds or certain derivatives are often level 2 investments with moderate valuation risk from indirect pricing.
Conventional And Modified Free Cash Flow (FCF) Calculations (FY2019 – FY2025)
In my September 28, 2024 How Stock Based Compensation Distorts Free Cash Flow post, I touch upon how a company’s FCF can be distorted. In several subsequent posts, I take a conservative approach when looking at a company’s FCF.
FCF is a non-GAAP measure, and therefore, its computation is open to debate. Most companies subtract capital expenditures (CAPEX) from Net Cash Provided by Operating Activities found in the Consolidated Statement of Cash Flows. They do not, however, deduct share-based compensation (SBC). Given the magnitude of ISRG’s SBC, I think it is prudent to deduct it.
In the first 3 quarters of FY2025, ISRG incurred ~$0.377B of CAPEX. On the Q4 earnings call, management states CAPEX in Q4 was ~$0.155B. Adding the two, we get FY2025 CAPEX of ~$0.532B.
The $2.5B FCF is what management discloses on the Q4 earnings call. The OCF reflected below is determined by adding FY2025 CAPEX and the $2.5B FCF management discloses.
The SBC is extracted from the Unaudited Reconciliation of GAAP to Non-GAAP Financial measures reflected in the Form 8-K.
This table will be updated once the FY2025 Form 10-K is available.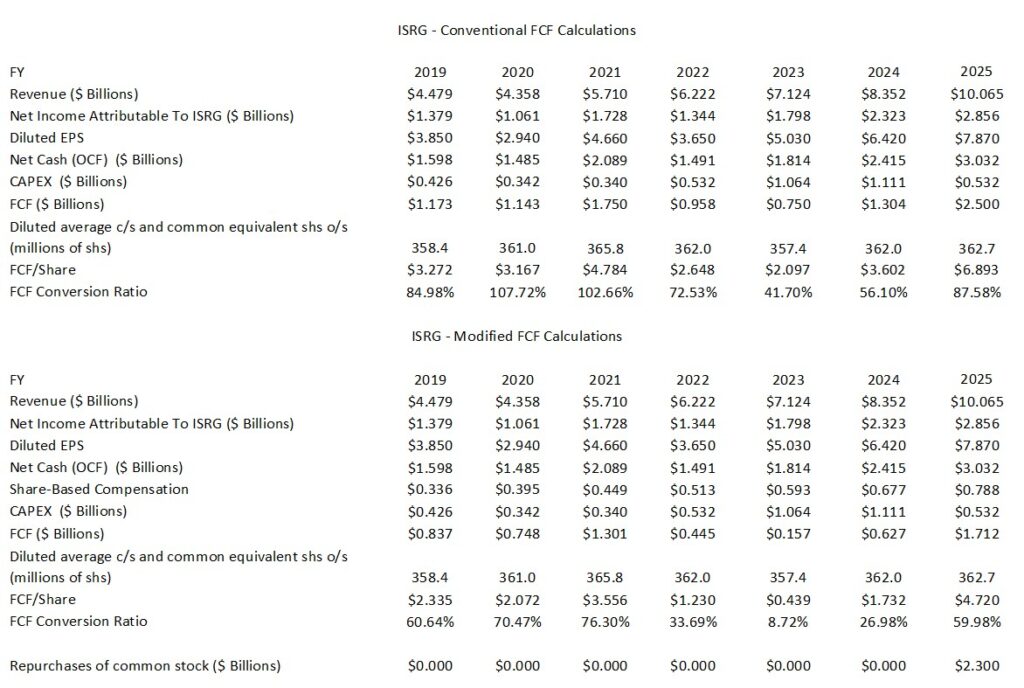
Return On Invested Capital (ROIC)
In my recent Veeva Exposure Further Increased post I touch upon the importance of looking at a company’s ROIC track record. This is because this metric provides an indication of a company’s efficiency. In essence, how much profit does a company generate for every dollar invested in the company. Is a company actually creating value or ‘burning’ cash for the sake of growth?
There are, however, some ‘shortcomings’ with ROIC which I point out in that post.
ISRG’s annual ROIC in recent years might only be in the low teens according to various sources. It, however, has a similar ‘problem’ as VEEV in that it has a considerable sum in cash and cash equivalents and short-term investments which negatively impacts the ROIC calculations.
Just in excess of $9B was held in cash and cash equivalents and short-term investments versus total assets of ~$20.5B at FYE2025. In addition, ISRG has no debt. If we include all $9B in ‘Invested Capital’ in a ROIC calculation, ROIC looks artificially low because cash earns a very low return compared to ISRG’s normal business operations. Deciding exactly how much of this cash is ‘excess’ versus ‘operating’ is subjective.
If a large percentage of ISRG’s $9B in cash and cash equivalents and short-term investments are classified as ‘excess’, the ROIC skyrockets. This is because ROIC measures the return on the capital actually working in the business. In financial modeling, ‘excess cash’ is often removed from the denominator because it is not an ‘operating asset’. It is merely sitting in highly liquid and low risk accounts/financial instruments.
Although subject to debate, perhaps at least 40% of the $9B (ie. ~$3.6B) is ‘excess’. This is because:
- ISRG generally generates ~$1B+ in annual Free Cash Flow for growth, share repurchases, etc.
- CAPEX in FY2022 – FY2025 was ~$0.532B, ~$1.064B, ~$1.111B, and ~$0.532B. $1B for annual CAPEX in FY2026 should be more than ample.
- Excess cash is being deployed toward share repurchases. In the first 3 months of FY2025 it repurchased ~$2.094B of its shares and it repurchased more shares in Q4.
- In FY2022 – FY2025, ISRG’s R&D expenses were ~$0.879B, ~$0.999B, ~$1.145B, and ~$1.312B. Allocating $1.75B annually for R&D is likely sufficient in each of the next few years.
If we consider ~$3.6B to be ‘excess’ and $5.4B is capital actually working in the business, ISRG’s ROIC is well in excess of the ‘teens’.
FY2026 Outlook
ISRG’s FY2026 outlook includes:
- Worldwide da Vinci procedure growth of ~ 13% – 15% compared to 18% in 2025.
- Non-GAAP gross profit margin of 67% – 68% of revenue in 2026 compared to 67.6% in 2025. This range includes an estimated impact from tariffs of 1.2% of revenue, plus or minus 10 bps.
- Non-GAAP operating expense growth of 11% – 15% in 2026 compared to 12% in 2025.
- Pro forma operating expense growth of 11% – 15% due to higher spending in support of advancing early-stage R&D programs, as well as incremental expenses associated with the acquisition of ISRG’s distributor for Italy, Spain, and Portugal.
- Non-cash stock compensation expense of ~$0.89B – ~$0.92B.
- Other income, comprised mostly of interest income, of ~$0.355B – $0.375B.
- The 2025 pro forma income tax rate was ~21%. The FY2026 estimate is 22% – 23% of pre-tax income.
Risk Assessment
No rating agency rates ISRG because it has no debt.
The following commentary is provided on page 49 of 58 in the Q3 2025 Form 10-Q.
Our principal source of liquidity is cash provided by our operations. Cash and cash equivalents plus short- and long-term investments decreased by $0.40 billion to $8.43 billion as of September 30, 2025, from $8.83 billion as of December 31, 2024, primarily as a result of cash used for repurchases of common stock, capital expenditures, and taxes paid related to net share settlements of equity awards, partially offset by cash provided by operating activities and proceeds from stock option exercises and employee stock purchases.
Our cash requirements depend on numerous factors, including market acceptance of our products, the resources we devote to developing and supporting our products, and other factors. We expect to continue to devote substantial resources to expand procedure adoption and acceptance of our products. We have made substantial investments in our commercial operations, product development activities, facilities, and intellectual property. Based on our business model, we anticipate that we will continue to be able to fund future growth through cash provided by our operations. We believe that our current cash, cash equivalents, and investment balances, together with income to be derived from our business, will be sufficient to meet our liquidity requirements for the foreseeable future. However, we may experience reduced cash flow from operations as a result of macroeconomic and geopolitical headwinds.
Dividends
ISRG does not distribute a dividend.
Share Repurchases
During the year, ISRG repurchased $2.3B of its shares at an average price of $478/share.
In FY2019, there were 358.4 million outstanding diluted shares. In FY2025, this had increased to 362.7 million.
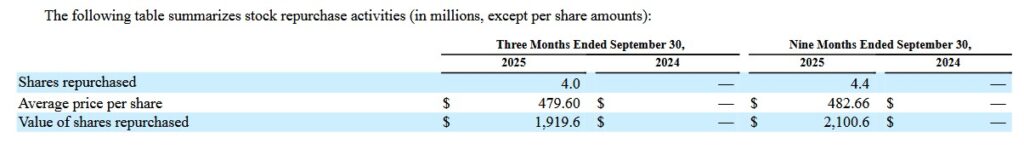
ISRG’s Board has authorized an aggregate of $13.0B of funding for the common stock repurchase program since its establishment in March 2009. The most recent authorization occurred in May 2025, when the Board increased the authorized amount available under the Repurchase Program to $4.0B, including amounts remaining under previous authorization. As of September 30, 2025, the remaining amount of share repurchases authorized by the Board under the Repurchase Program was ~$1.9B.
Valuation
ISRG is almost always overvalued when analyzed using conventional valuation metrics. When analyzing ISRG’s valuation, however, it is essential to consider that displacing the da Vinci and ION systems after installation is difficult due to high switching costs, surgeon training lock-in, and a recurring revenue ecosystem that creates powerful network effects.
Surgeons undergo extensive training on da Vinci and ION platforms, developing proficiency that makes switching to competitors time-consuming, risky, and costly. Hospitals generally prefer retaining familiar systems to attract/retain talent.
Hospitals optimize operating rooms, service contracts, supply chains, and capital budgets around da Vinci and ION, making replacement expensive and disruptive.
Instruments and accessories constitute a meaningful proportion of ISRG’s annual recurring revenue. The instruments and accessories are proprietary, with patented interfaces generating high-margin consumables per procedure. This razor-and-blade model, plus clinical data from thousands of procedures, reinforces stickiness and data advantages competitors are currently unable to quickly match.
ISRG also continue to expand its addressable market, it generates attractive margins, and it has NO debt.
Given the above, I am prepared to ‘pay up’ to increase my ISRG exposure. Having said this, ISRG’s share price is volatile (the current 52 Week Range is $425.00 – $609.08) so I try to be patient and to acquire shares when there is share price weakness.
As I compose this post, ISRG’s share price is ~$527. Using this purchase price and the current broker estimates, ISRG’s forward-adjusted diluted PE levels are:
- FY2026 – 28 brokers – ~53.2 based on a mean of $9.90 and low/high of $9.28 – $10.65.
- FY2027 – 28 brokers – ~46.6 based on a mean of $11.31 and low/high of $10.56 – $12.26.
- FY2028 – 12 brokers – ~40.5 based on a mean of $13.01 and low/high of $12.03 – $14.40.
The valuations using FCF are likely higher as ISRG’s FCF/share is generally lower than diluted EPS and adjusted diluted EPS.
For comparison, the following was my approximate estimate of ISRG’s valuation at the time of my September 3, 2025 post.
When I wrote my July 24 post, ISRG’s shares were trading at ~$499.935. Shares were definitely not a bargain but I added a few shares to my exposure. With shares currently at ~$441 and no material change to the company’s long-term outlook, I think ISRG presents an attractive long-term investment opportunity.
As noted in my prior post, ISRG generated YTD2025 diluted EPS of $3.72 and $4.00 of adjusted diluted EPS. Despite the headwinds management presented on the Q2 2025 earnings call, there is a good probability that FY2025 diluted EPS and adjusted diluted EPS could be ~$7.45 and ~$8.00. The diluted PE and adjusted diluted PE using my September 3 purchase price are ~60 and ~56.
Using this purchase price and the current broker estimates, ISRG’s forward-adjusted diluted PE levels are:
- FY2025 – 28 brokers – ~54.8 based on a mean of $8.16 and low/high of $7.95 – $8.31.
- FY2026 – 27 brokers – ~48.2 based on a mean of $9.27 and low/high of $8.73 – $9.77.
- FY2027 – 20 brokers – ~41.5 based on a mean of $10.79 and low/high of $10.10 – $11.81.
- FY2028 – 7 brokers – ~36.6 based on a mean of $12.21 and low/high of $11.31 – $13.92.
Although I look at brokers’ earnings estimates, I am extremely reluctant to place any reliance on them. My reasoning for excluding estimates beyond the current fiscal year is that I have no idea how anybody, especially in the current environment, can determine how a company will perform over the next few years. The variance in the brokers’ earnings estimates clearly indicates there is no consensus on how ISRG is likely to perform going forward.
Looking at ISRG’s valuation from a P/FCF perspective, there is a considerable variance in FCF when we use the conventional and modified methods (see table provided in my July 24 post). This is because ISRG issues significant shareholder based compensation.
If we assume that ISRG can generate a similar amount of FCF/share in the second half of FY2025 as in the first half, we arrive at ~$5.626 and ~$3.53 of FCF/share. Both are well below my estimates of ~$7.45 in diluted EPS and ~$8.00 adjusted diluted EPS. ISRG’s valuation from a FCF perspective when using my $447.26 purchase price is ~79.5 and ~126.7.
The following was my approximate estimate of ISRG’s valuation at the time of my October 23, 2025 post.
With ISRG’s current ~$543 share price and current broker estimates, we now see that the forward-adjusted diluted PE levels are:
- FY2025 – 29 brokers – ~63.6 based on a mean of $8.54 and low/high of $8.05 – $8.75.
- FY2026 – 29 brokers – ~56.6 based on a mean of $9.60 and low/high of $8.93 – $11.23.
- FY2027 – 23 brokers – ~49 based on a mean of $11.09 and low/high of $10.26 – $12.23.
- FY2028 – 9 brokers – ~42.9 based on a mean of $12.67 and low/high of $11.74 – $14.25.
On the Q3 earnings call, management states that capital expenditures for FY2025 will be ~$0.625B – ~$0.675B. This reflects planned facility construction activities.
If it can generate similar OCF in Q4 as in the prior 3 quarters, FY2025 OCF should be ~$2.85B. Deduct ~$0.65B in CAPEX and the conventional FCF for FY2025 should be ~$2.2B.
With the resurgence in ISRG’s share price, I suspect ISRG will not repurchase any more shares in the remainder of FY2025. If I use a weighted average number of outstanding shares of 363 million for FY2025, FY2025’s conventional FCF/share should be ~$6.06/share (~$2.2B/363 million shares).
On a modified basis, I anticipate SBC in Q4 will be ~$0.79B which is the mid-point of management’s revised guidance. By deducting ~$0.79B of SBC from my ~$2.2B FCF calculated using the conventional method, the modified FY2025 FCF should be ~$1.41B. Use a weighted average number of outstanding shares of 363 million for FY2025, FY2025’s modified FCF/share should be ~$3.88/share (~$1.41B/363 million shares).
Using the current ~$543 share price, the forward P/FCF is ~90 and ~140 (conventional and modified).
Final Thoughts
The following are my most recent ISRG purchases. This excludes any ISRG purchases made for a couple of young investors I am helping on their journey to financial freedom:
- June 9, 2025: 50 shares @ $519.22
- July 11, 2025: 50 shares @ $511.18
- July 16, 2025: 50 shares @ $508.975
- July 23, 2025: 50 shares @ $499.935
- September 3, 2025: 50 shares @ $441.37
ISRG’s valuation is generally ‘rich’. I, therefore, plan to opportunistically increase my ISRG exposure (when there is negative market sentiment).
It also appears to be a good investment for investors with a VERY long investment time horizon. I intend to opportunistically increase the young investors’ exposure to ISRG.
I wish you much success on your journey to financial freedom!
Note: Please send any feedback, corrections, or questions to finfreejourney@gmail.com.
Disclosure: I am long ISRG.
Disclaimer: I do not know your circumstances and do not provide individualized advice or recommendations. I encourage you to make investment decisions by conducting your own research and due diligence. Consult your financial advisor about your specific situation. I wrote this article myself and it expresses my own opinions. I do not receive compensation for it and have no business relationship with any company mentioned in this article.