
I last reviewed Exxon Mobil (XOM) in this August 2, 2024 post at which time the most current financial information was for Q2 and YTD 2024. In addition, it had relatively recently completed the Pioneer Natural Resources (Pioneer) acquisition.
On August 1, 2025, XOM released its Q2 and YTD2025 results thus prompting me to revisit this existing holding.
I also draw to your attention my August 5, 2025 Chevron’s Outlook Points To Stronger Future Returns post in which I reference XOM.
Business Overview
Great sources of information from which to gain a deeper understanding of the company are the:
- May 2025 Investor presentation; and
- 2024 Form 10-K accessible through the SEC Filings section of the company’s website.
Financial Review
Q2 and YTD2025 Results
Material related to XOM’s August 1 earnings release is accessible here.
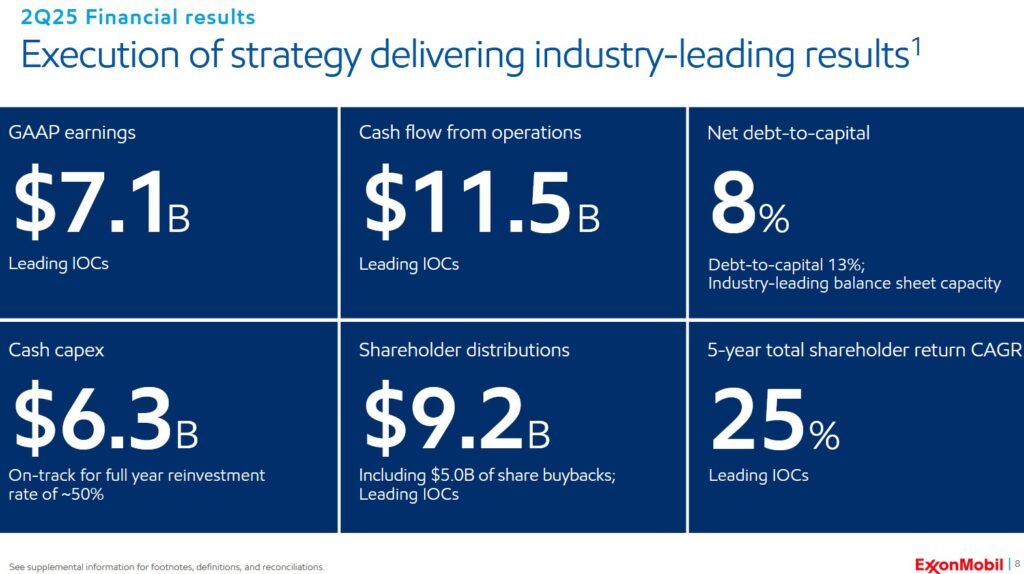
XOM has delivered ~$1.4B of structural cost savings YTD2025, increasing its total to ~$13.5B since 2019. This is more than all other international oil companies combined.
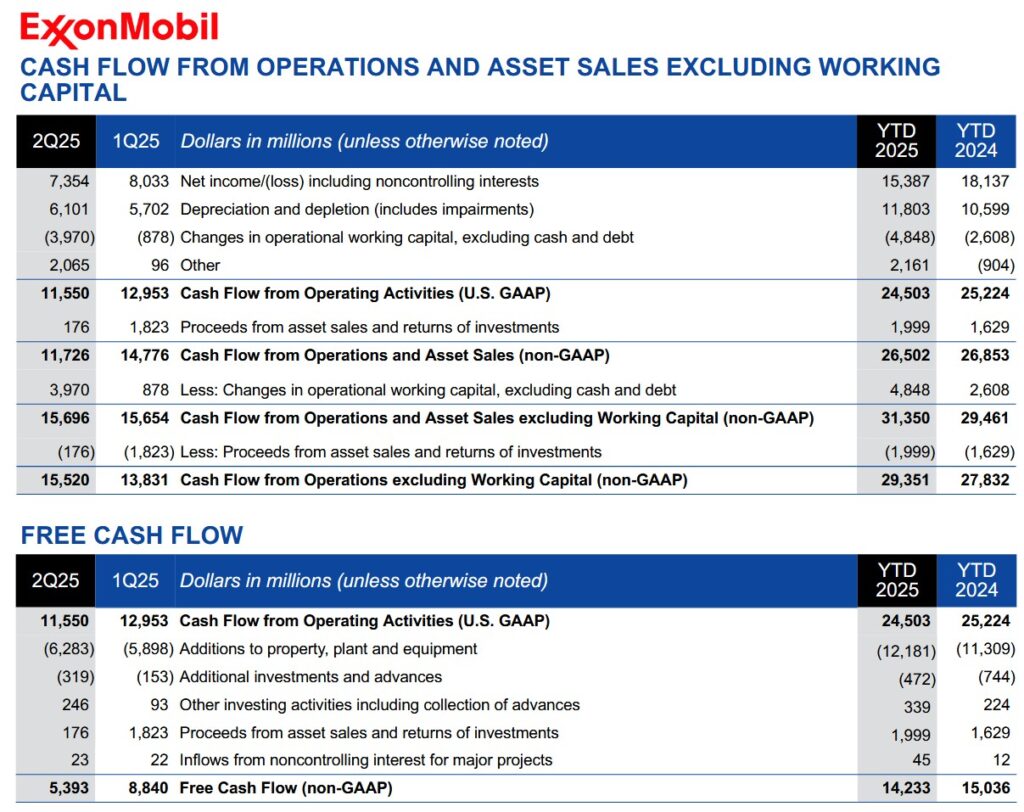
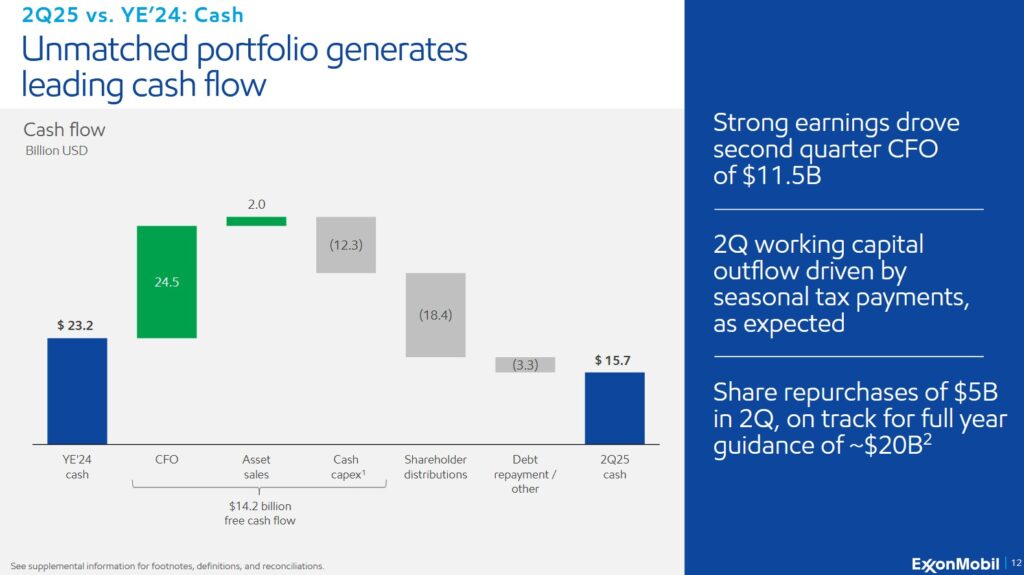
The company’s strong cash flow from operations enabled it to return an industry-leading $9.2B (dividend distributions and share repurchases) to its shareholders in Q2.
XOM and the Stabroek Block in Guyana
My recent CVX post touches upon the prolific Stabroek Block off the coast of Guyana. This Block holds more than 11 billion barrels of oil and is one of the fastest growing oil regions in the world.
Guyana’s daily oil production is set to increase by 37% with the August 2025 startup of a fourth offshore development, the Yellowtail project. The project will add 250,000 barrels per day (bpd) to Guyana’s national output, raising production from ~664,000 bpd in June to over 900,000 bpd.
Acquisitions
While XOM is looking at acquisition opportunities, its CEO and Chairman insists that any acquisition must create value for investors. XOM is not looking for ‘consolidation plays’ where an acquisition would merely increase volume.
Bearish Crude-Supply Flood?
The energy sector has been struggling with price volatility as the OPEC+ group has increased its production thereby pressuring Brent crude prices lower in Q2 2025; there has been a ~17% decline in US crude prices since mid-January.
This is a high level explanation of the difference between OPEC and OPEC+.
In anticipation of a crude-supply flood, Diamondback Energy Inc., the largest Permian Basin oil driller, has recently announced that it is reducing FY2025 CAPEX by ~$0.1B. The purpose of this defensive move is to avoid the risk of boosting production in a well-supplied market (ie. risk of lower prices).
Political Climate
The Trump administration has been rolling back prior US efforts to curb climate change. For example, the Environmental Protection Agency (EPA) is proposing to rescind the 2009 Endangerment Finding, a landmark decision that declared greenhouse gas emissions endanger human health and welfare. This finding serves as the legal basis for many EPA regulations aimed at reducing greenhouse gas emissions. The agency argues the finding lacks scientific and legal justification. Critics contend it is a rollback of crucial climate protections.
Despite the possibility of a roll back, XOM states it intends to continue to work to reduce its emissions in the Permian Basin of West Texas and New Mexico and other regions.
Trinidad & Tobago
XOM first approached the Trinidad and Tobago (T&T) government in November 2024 with interest in 7 Blocks located northwest of XOM’s Stabroek Block in Guyana, where a consortium XOM leads has confirmed more than 11 billion barrels of recoverable resources. Negotiations began earlier in 2025 for the areas off T&T’s east coast; XOM left this area more than 20 years ago.
This amalgamation of seven Blocks has been renamed Ultra Deep 1 or UD(1) and the area covers water depths of 2,000 – 3,000 meters.
According to a 2024 study by Houston-based energy data analytics firm TGS, UD(1) could unlock potential similar to the Stabroek Block.
A Block refers to a defined area of land or offshore territory that governments or regulatory bodies create and allocate to companies for exploration and potential extraction of petroleum resources. These Blocks serve as the basic unit for licensing and activity in the search for oil and gas.
The agreement is expected to include a signing bonus and a three-phase exploration program in T&T that includes the acquisition of seismic data and drilling of exploration wells. If oil or gas is found, the agreement also includes royalty payments and a share of the profits to the government along with a provision for cost recovery.
T&T is in the middle of a deepwater auction scheduled to close on September 17. This auction excludes the areas in which XOM is interested.
According to T&T’s laws, the government can individually negotiate areas for exploration and production if they are not included in a competitive bidding round.
T&T has been trying to rejuvenate investment, especially offshore, where more gas output is needed to support the nation’s liquefied natural gas and petrochemical industries.
Operating Cash Flow (OCF), Free Cash Flow (FCF), and CAPEX
Just like CVX, XOM is a highly capital intensive business as borne out by its annual CAPEX levels. High CAPEX has its advantages and disadvantages. A key advantage is the high barriers to entry. You may get new industry participants but they can not compete directly with XOM. Going forward, we will witness more industry consolidation with XOM likely to be an acquirer.
XOM has navigated its way through challenging business conditions over the last few years. During this period, XOM investors have had to be patient as the company’s results have been inconsistent. This is not surprising given the behavior of Brent, WTI (West Texas Intermediate) crude oil prices, and natural gas prices.
FCF is a non-GAAP measure so there is no standard method of calculation.
XOM includes additional line items from the Consolidated Statement of Cash Flows to compute FCF. I, therefore, include the same line items as XOM so that my FCF figures are consistent with the company’s numbers.
Generally, I expect a ‘share based compensation’ (SBC) line item in the Consolidated Statements of Cash Flows. No such line item is reported by XOM although there is undoubtedly an element of SBC. I am, therefore, unable to determine XOM’s FCF calculated using the modified method. Having said this, the magnitude of XOM’s SBC is unlikely to materially alter the company’s FCF.
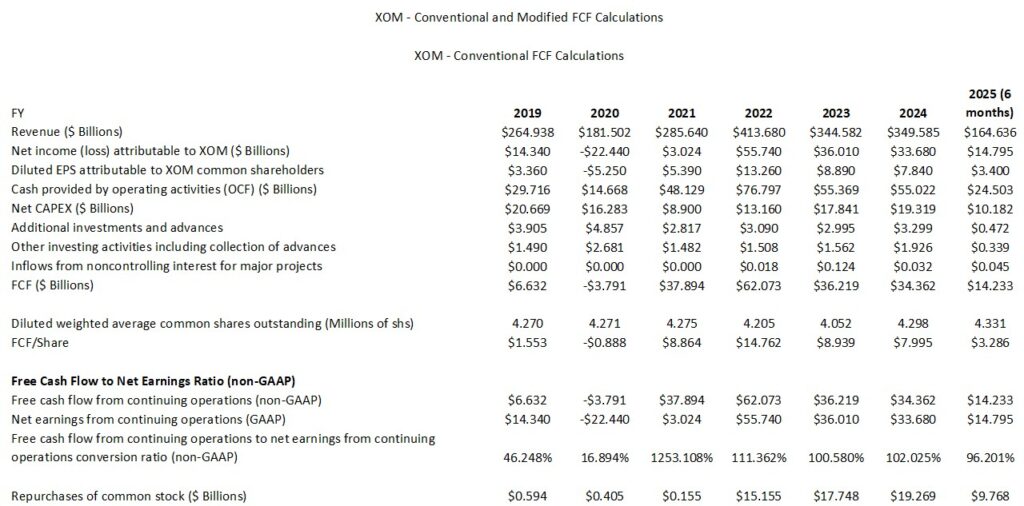
XOM segregates additions to property, plant and equipment and proceeds from asset sales and returns on investment. I combine both line items to arrive at Net CAPEX.
In December, XOM set a plan through 2030 to grow earnings $20B and cash flow of $30B.
FY2025 Outlook
In late August, XOM will publish its annual global outlook. This outlook contains XOM’s latest views on global energy demand and supply through 2050 which forms the basis of XOM’s business planning.
XOM does not issue adjusted diluted EPS guidance for the year because demand/supply conditions are so unpredictable.
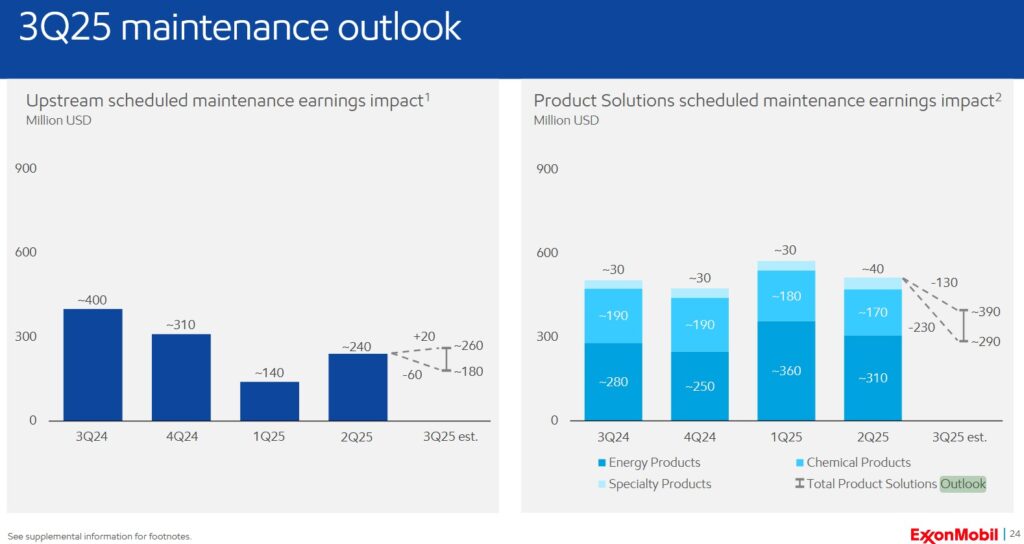
XOM expects lower scheduled maintenance in its refining business in Q3 2025.
Barring a brief Q2 2025 flare-up sparked by Israel-Iran tensions, crude prices have stayed depressed this past year. Futures have been under pressure from an uncertain outlook for demand. This has been exacerbated since April by the rollout of Washington’s wide-spanning tariffs. These protectionist trade measures muddy the picture for growth in the world’s largest economy and the future of the US dollar.
Even the experts in the energy sector have difficulty in determining the outlook for commodity prices beyond the next few quarters.
Geopolitical risks impact commodity markets. As a relatively conservative investor, I choose to restrict my exposure to XOM and CVX as both companies have a stronger likelihood of weathering turmoil than many other industry participants.
Risk Assessment
Some investors fixate on an investment’s potential return and overlook the various risk aspects of the investment. This is why I strongly encourage investors to read the ‘Risks’ section of a company’s Form 10-K.
As part of my risk assessment, I look at how the rating agencies perceive the company’s risk.
XOM’s current domestic long-term unsecured debt ratings and outlook are:
- Moody’s: Aa2 (stable) last reviewed May 31, 2024.
- S&P Global: AA- (stable) last reviewed September 26, 2024.
The rating assigned by Moody’s is the middle tier of the high-grade investment-grade category. It is one tier above the rating assigned by S&P Global.
Both ratings define XOM as having a very strong capacity to meet its financial commitments. It differs from the highest-rated obligors only to a small degree.
This schedule of XOM’s debt extracted from the FY2024 Form 10-K reflects well dispersed maturity dates.
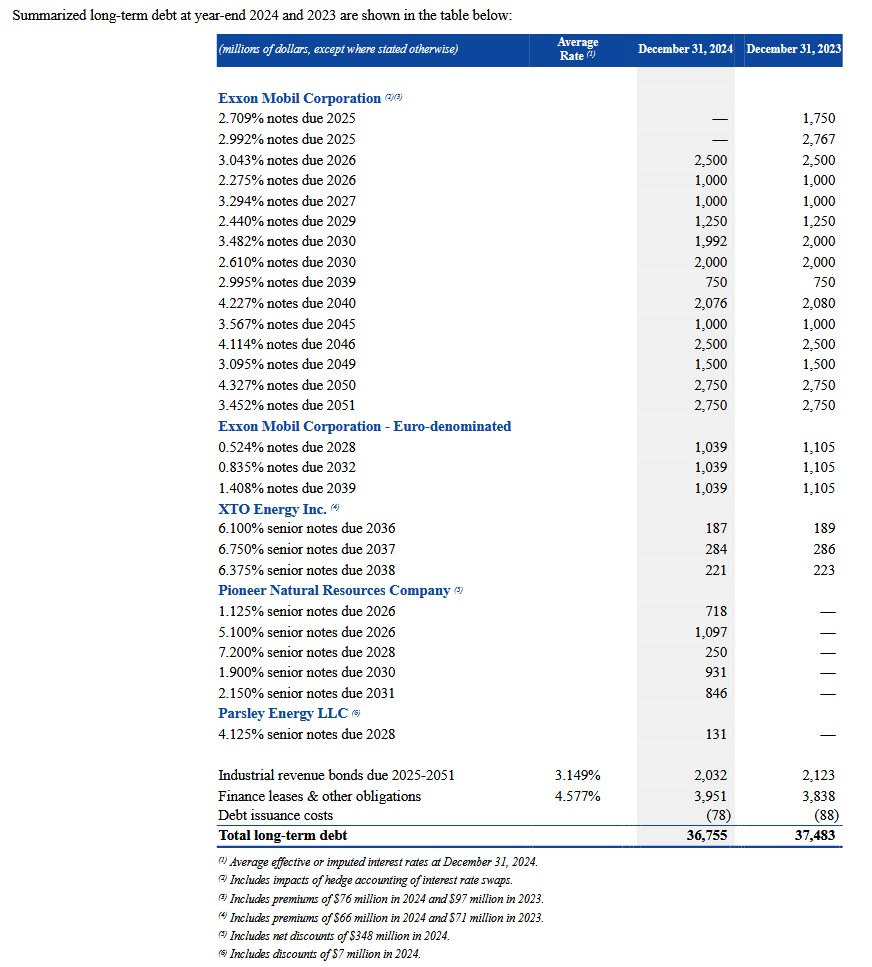
At the end of Q2 2025, XOM’s long-term debt was $33.570B and current notes and loans payable was $5.419B. XOM’s debt-to-capital ratio was 13% and the net-debt-to-capital ratio was 8%.
Dividends and Dividend Yield
XOM’s dividend history is accessible here.
XOM distributed dividends of $9.02B, $10.092B, $10.875B, $11.568B, $12.09B, $12.453B, $13.001B, $13.798B, $14.652B, $14.865B, $14.924B, $14.939B, $14.941B, and $16.704B in FY2011 – FY2024. These figures exclude dividend payments to non-controlling interests that are generally under ~$0.6B annually.
In the first half of FY2025, XOM distributed dividends totaling $8.623B.
XOM will distribute a $0.99/share dividend on September 10, 2025, to shareholders of record at the close of business on August 15, 2025. This marks the 4th consecutive dividend at this level.
Share Repurchases
In FY2011 – FY2024, XOM repurchased $22.055B, $21.016B, $15.998B, $13.183B, $4.039B, $0.977B, $0.747B, $0.626B, $0.594B, $0.405B, $0.155B, $15.155B, $17.748B, and $19.629B. Net cash used in financing activities was $22.3 billion in the first half of FY2025. This included ~$9.768B for the purchase of 89.9 million shares as part of the company’s previously announced buyback program. The company is on pace to purchase $20B in FY2025.
The weighted average number of diluted shares outstanding in FY2011 – FY2024 (in millions of shares) was 4,419, 4,282, 4,196, 4,177, 4,256, 4,270, 4,270, 4,271, 4,275, 4,205, 4,052, and 4,298. In Q2 2025, this has risen to 4,331. The increase in shares outstanding in 2024 and YTD2025 is because of the issuance of shares to acquire Pioneer. Since May 2024, however, XOM has already purchased about 40% of the shares it issued to acquire Pioneer.
XOM remains committed to the repurchase of shares as a component of its capital allocation.
Valuation
In the first half of FY2025, XOM generated diluted and adjusted diluted EPS of $3.40. If it generates stronger results in the second half of FY2025, it is possible that it could generate FY2025 adjusted diluted EPS of ~$6.90 – ~$7.00. With shares trading at ~$107.20, XOM’s forward adjusted diluted PE range is ~15.3 – ~15.5.
XOM’s forward adjusted diluted PE estimates using the current broker earnings estimates and a ~$107.20 share price are:
- FY2025: ~16.1 using a mean of $6.67 and a low/high range of $6.00 – $8.84 from 23 brokers.
- FY2026: ~14.4 using a mean of $7.46 and a low/high range of $3.10 – $9.82 from 23 brokers.
- FY2027: ~11.5 using a mean of $9.34 and a low/high range of $5.40 – $13.03 from 16 brokers.
I prefer to assess XOM’s valuation based on FCF. XOM has generated ~$3.286/share of FCF in the first half of FY2025. It will be repurchasing more shares in the second half of FY2025 and will be scaling back CAPEX. Using a FCF/share range of $6.70 – $6.90 and a ~$107.20 share price, the forward P/FCF range is ~15.5 – ~16.
Final Thoughts
XOM operates in a volatile and highly capital intensive industry. As a relatively conservative investor wanting exposure to integrated oil and gas producers, I limit my exposure to CVX and XOM, the 2 largest industry participants.
XOM has commenced operations on six key projects this year and management expects to start four more by year-end. These projects are expected to improve the company’s earnings power by more than $3B in 2026 at constant prices and margins.
In addition, XOM plans to:
- invest ~$140B in major capital projects and its Permian Basin development program in 2026 – 2030; and
- deliver ~$18B in structural cost savings by the end of 2030.
From FY2016 – FY2021, XOM allocated very little capital toward share repurchases. This, however, has changed in recent years. I anticipate stronger FCF from XOM going forward and want it to aggressively repurchase shares….which is all the more reason why I want shares to remain undervalued.
If XOM’s share price does increase to ~$130, which is what I deem to be a fair value, this would result in just over a 20% capital appreciation from the current ~$107.20.
I currently hold 1,226 XOM shares in 2 different ‘Core’ accounts in the FFJ Portfolio plus shares in a retirement account for which I do not disclose details. When I completed my 2025 Mid-Year Portfolio Review, it was my 17th largest holding; shares were trading at ~$107.80. Through the automatic reinvestment of the quarterly dividends, I should be able to increase my XOM exposure in the FFJ Portfolio by 8 – 10 shares/quarterly without having to outright purchase more shares; I also reinvest the dividends from the XOM shares held in a retirement account.
At this point, I am satisfied with my XOM exposure and currently have no plans to acquire additional shares.
I wish you much success on your journey to financial freedom!
Note: Please send any feedback, corrections, or questions to finfreejourney@gmail.com.
Disclosure: I am long XOM and CVX.
Disclaimer: I do not know your circumstances and am not providing individualized advice or recommendations. I encourage you not to make any investment decisions without conducting your research and due diligence. You should also consult your financial advisor about your specific situation.
I wrote this article myself and it expresses my own opinions. I am not receiving compensation for it and have no business relationship with any company whose stock is mentioned in this article.