
I last reviewed Zoom Communications (ZM) in this February 25, 2025 post at which time the company had just released its Q4 and FY2024 results and Q1 and FY2026 outlook. Following the May 21 market close, however, it released its Q1 2026 results and Q2 and FY2026 outlook thus prompting me to revisit this existing holding.
In the first half of April 2025, market turmoil presented attractive buying opportunities. Recently, however, investors appear to have a willingness to bet on equities regardless of underlying fundamentals. Many companies have withdrawn their FY2026 guidance or have provided guidance with some caveats yet the S&P500 and NASDAQ Composite Indices are higher or comparable to the beginning of the year levels.
In addition, the CBOE Volatility Index (VIX), a real-time index that represents the market’s expectations for the relative strength of near-term price changes of the S&P 500 Index (SPX), is not much higher than at the beginning of the year.
While I have absolutely no idea how share prices will perform in the short-term, I have this nagging feeling that another market swoon, similar to what we experienced in April 2025, is a very real possibility.
Recently, Moody’s did what was long overdue…it finally downgraded the United States’ sovereign credit rating one notch to Aa1 from Aaa citing the growing burden of financing the federal government’s budget deficit and the rising cost of rolling over existing debt amid high interest rates. I say ‘finally’ because S&P Global and Fitch downgraded the sovereign credit rating in 2011 and 2023. Moody’s has just been lax in its assessment of the US’s sovereign credit rating.
We see from S&P Global’s January 2025 global refinancing study that a considerable amount of debt is scheduled to mature over the next several years. With the probability of US interest rates remaining elevated relative to levels of a few years ago, many companies are likely to find themselves in a predicament when it comes time to renegotiate the terms of their maturing debt.
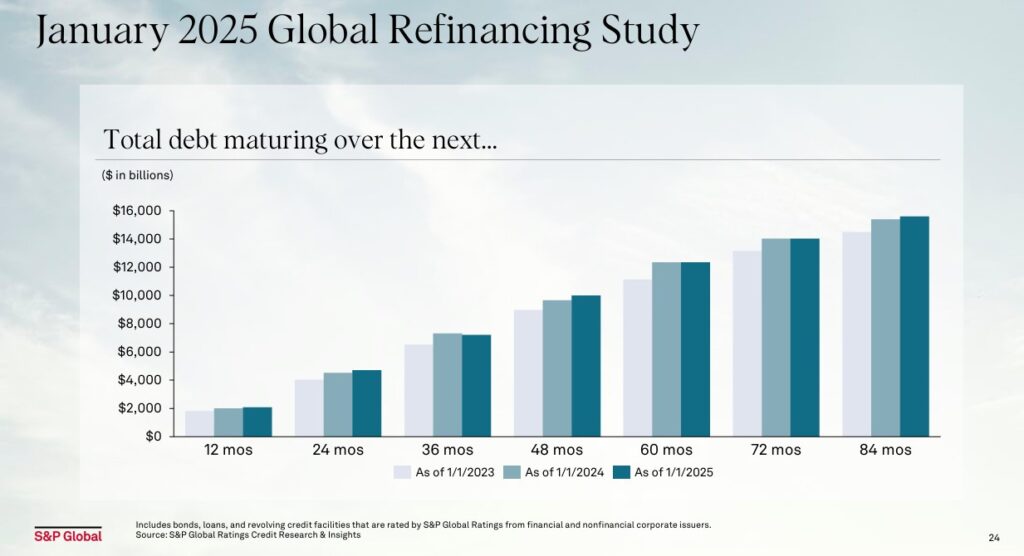
Many companies are unlikely to be in a position to dramatically reduce their debt levels between now and maturity. In all probability, rating downgrades will become increasingly common over the next few years.
The Financial Industry Regulatory Authority (FINRA) tracks monthly margin statistics. Although margin levels plunged in April 2025 from the January 2025 high, the margin levels are still considerably higher than historical monthly levels. I also suspect that the recent market recovery has led to Debit Balances in Customers’ Securities Margin Accounts increasing above February – April 2025 levels.
Given my risk adverse investor profile and concern about current geopolitical, bond, and equity market conditions and margin debt levels, I consider it prudent to invest in companies with strong financials. ZM is such a company.
Business Overview
Part 1, Item 1 in ZM’s FY2024 Form 10-K (see SEC Filings) provides a comprehensive overview of the business, competition, and risks.
On October 9, 2024, ZM held its Zoomtopia Investor Session. This information provides a good overview of this company’s future potential.
ZM has Class A (publicly traded shares) and Class B shares. The Class A and B shares have 1 and 10 votes per share, respectively.
The Class B shareholders have significant influence over the management and over all matters requiring stockholder approval, including the election of directors and significant corporate transactions, such as a merger or other sale of ZM or its assets, for the foreseeable future. Within the Risk Factors section of ZM’s Form 10-Q and Form 10-K, there is commentary regarding this dual-class structure.
ZM and ServiceNow (NOW) Announce Strategic Integration
On May 7, both companies announced plans to integrate Zoom CX with ServiceNow CRM and IT Service Management (ITSM). The integration, announced as part of Knowledge 2025, ServiceNow’s annual customer and partner event, will deliver a turnkey, AI-first solution for customer service and IT support in the contact center.
Financials
Q1 2026 Results
ZM’s Q1 2026 earnings material (including the transcript of management’s commentary of the earnings call) is accessible here.
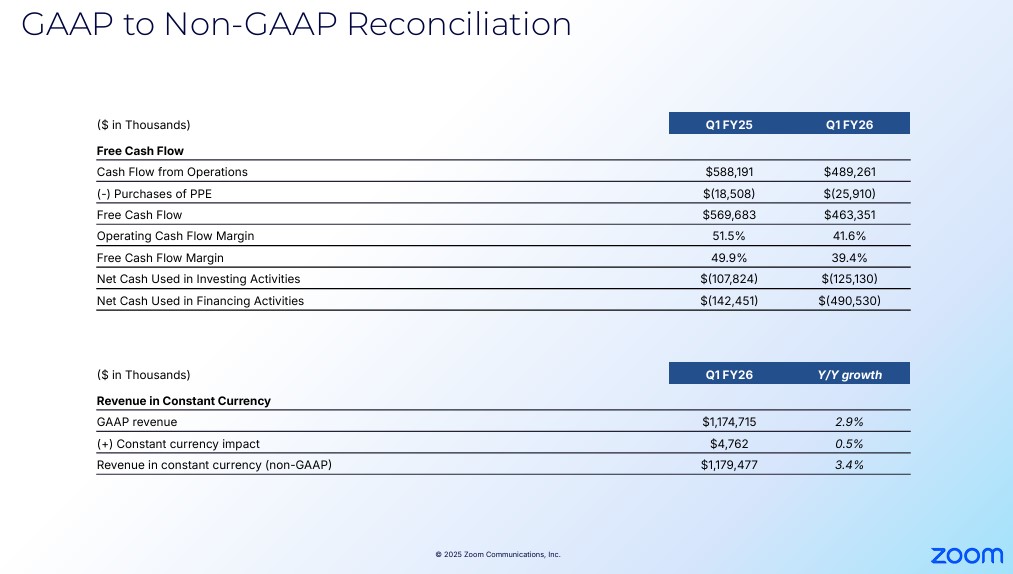
The Q1 2025 and Q1 2026 GAAP to Non-GAAP reconciliation is accessible through the Q1 2026 earnings presentation.
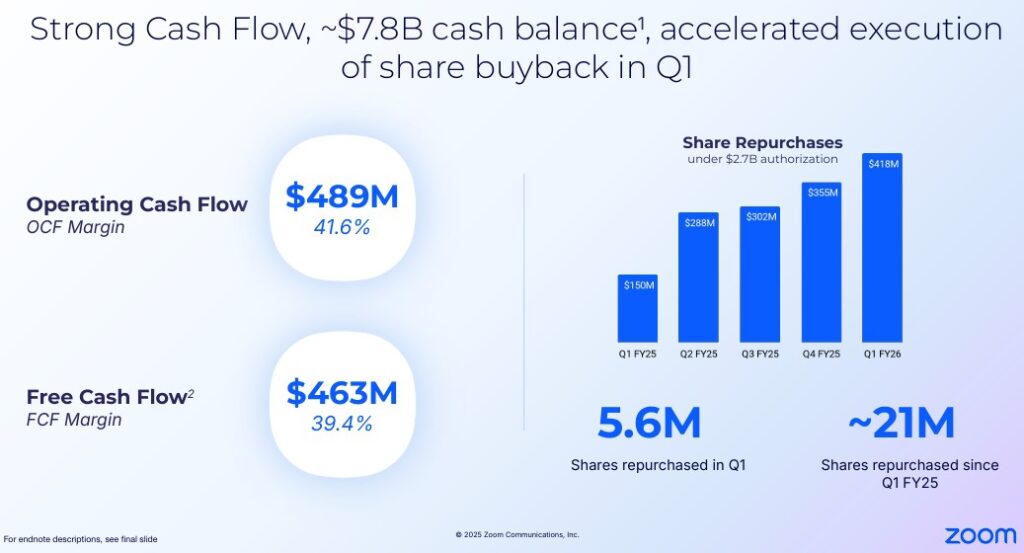
ZM’s cash and cash equivalents and marketable securities at FYE2025 was ~$7.79B, an increase from ~$7B, ~$7.5B, and ~$7.7B at FYE2024, Q2 2025, and Q3 2025. At the end of Q1 2026, this had risen to ~$7.8B. This increase is impressive considering the extent to which ZM has been repurchasing shares in recent quarters.
Some investors may argue that ZM has far too much liquidity. They may wonder if management has run out of investment opportunities or is too short-sighted and has not determined what to do with the money.
As a relatively risk averse investor, however, I have a positive view on ZM’s liquidity.
Although ZM’s annual CAPEX is relatively insignificant (~$0.104B, ~$0.127B, ~$0.137B and ~$26 million in FY2023 – FY2025 and Q1 2026) it operates in a highly competitive environment and must spend a considerable amount on research and development (R&D). In FY2023 – FY2025 it incurred ~$0.774B, ~$0.803B, and ~$0.852B in R&D; in Q1 it incurred ~$0.205B of R&D expenses. ZM has accomplished the funding of all CAPEX and R&D without debt.
All the liquidity also enables ZM to repurchase shares without having to resort to the use of an accelerated share repurchase agreement (ASR); a company may enter into an ASR if it thinks its shares are undervalued.
This is an investment strategy where a publicly-traded company expeditiously buys back large blocks of its outstanding shares from the market by relying on an investment bank to facilitate the transaction. It requires a company to furnish upfront cash to the investment bank. It must then enter into a forward contract with the institution whereby it agrees to buy securities at a future date.
Some companies have insufficient liquidity to enter into such an agreement, and therefore, may borrow to raise cash to effect such a transaction. Not ZM!
This ASR strategy may have worked well for many companies in the low interest rate environment of a few years ago. In a rising interest rate environment, however, what may have been a good idea a few years ago may no longer be attractive.
ZM’s excess liquidity places it in a position where it can repurchase shares when it thinks shares are undervalued without having to resort to the use of debt. Although its SBC is still significant, it has sufficient liquidity to repurchase shares in excess of its SBC without having to resort to the use of debt.
Operating Cash Flow (OCF), Free Cash Flow (FCF), and CAPEX
I think investors should exclude the stock-based compensation (SBC) line item on the Consolidated Statements of Cash Flows to arrive at a company’s net cash provided by operating activities; common forms of SBC are shares, stock options, restricted share units (RSUs), phantom shares, and employee stock ownership plans (ESOP).
Let’s use an extreme example where Company A remunerates its employees solely by way of SBC thereby requiring no use of cash. The income statement will treat the SBC as an expense but the SBC will be added back to determine the net cash provided by operating activities on the Consolidated Statements of Cash Flows.
On the other hand, Company B compensates its employees 100% by way of wages/salaries; the income statement will reflect this expense. On the Consolidated Statements of Cash Flows, however, nothing will be added back to determine the net cash provided by operating activities.
Both companies could perhaps compensate their respective employees the same amount. Because Company A disburses no cash, however, its FCF would be greater than that of Company B by the exact amount of the SBC (assuming all other line items are the same).
Why should how a company compensates its employees lead to different Price/FCF valuations?
Given my rationale for deducting SBC, I provide a comparison of ZM’s FCF using the ‘conventional’ and ‘modified’ methods.
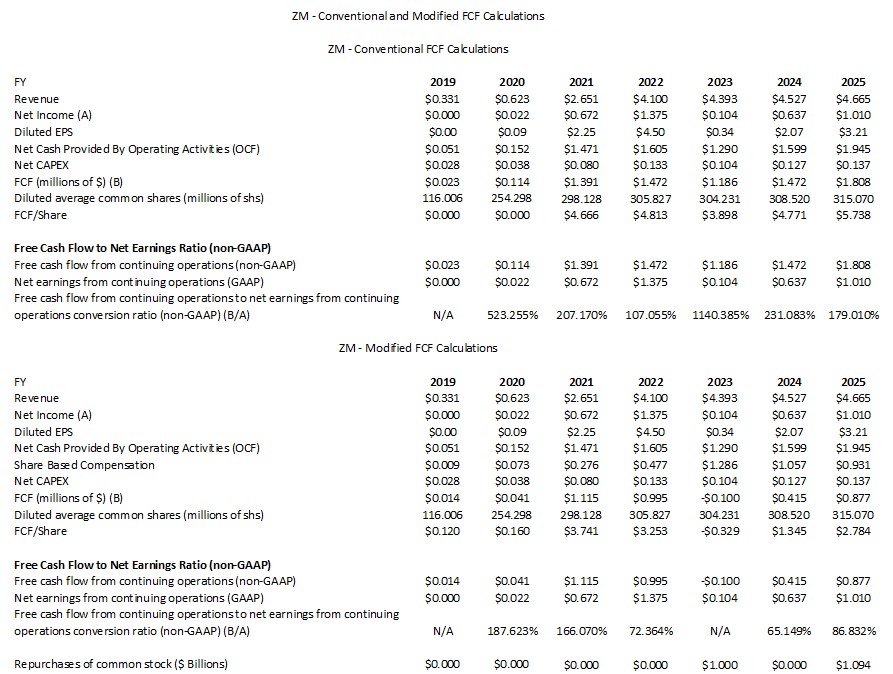
The following reflects the manner in which ZM calculates FCF for Q1 2025 and Q1 2026.
In Q1 2025 and Q1 2026, ZM’s SBC was ~$0.2295B and ~$0.202B. If we subtract these amounts to determine ZM’s FCF, we arrive at ~$0.3403B and ~0.2618B versus ~$0.570B and ~$0.463B calculated by the company.
Capital Allocation
The capital allocation priority is to reinvest in the company; this can include acquisitions. The opportunistic repurchase of Class A shares comes next with dividend distributions being non-existent.
Q2 and FY2026 Outlook
The following reflects ZM’s Q2 and FY2026 outlook.
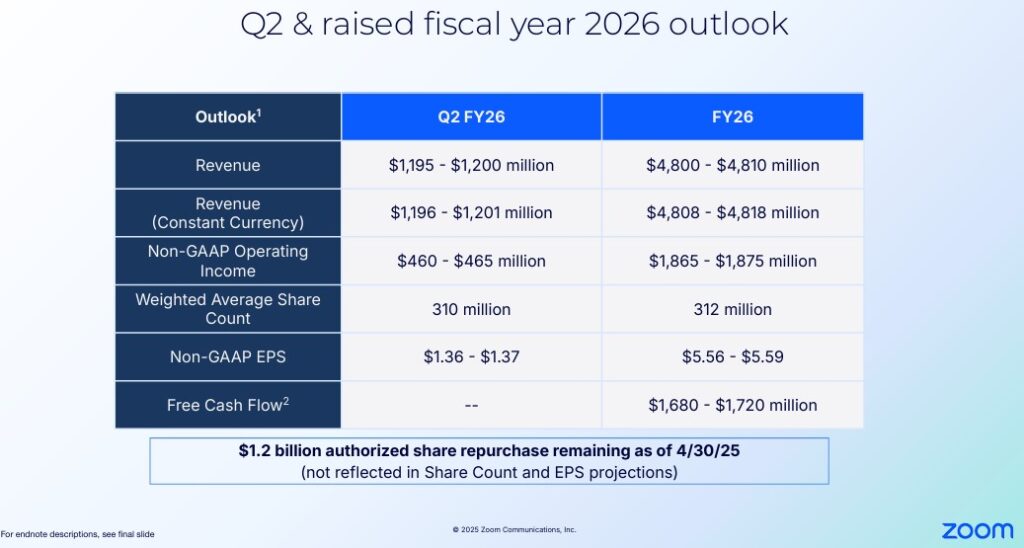
I provide ZM’s prior outlook below for comparison.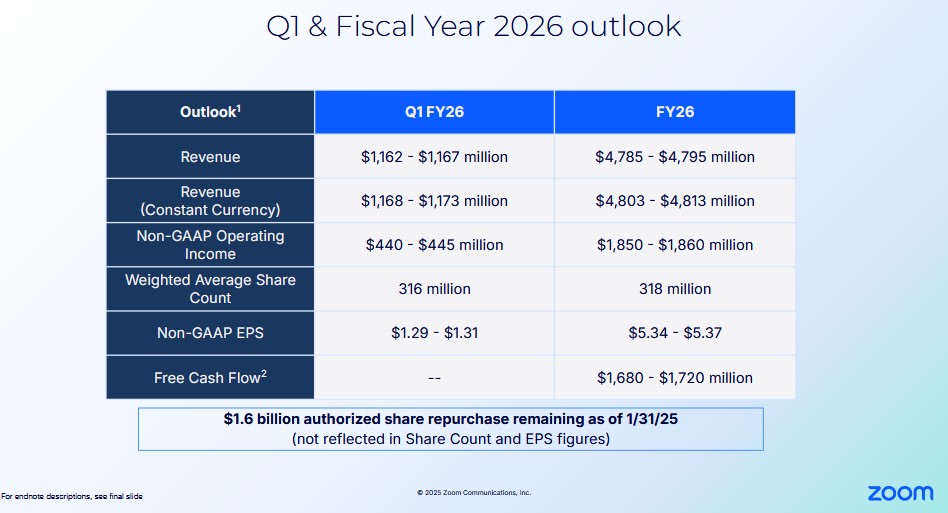
Risk Assessment
ZM has no debt to rate.
Dividends and Share Repurchases
Dividend and Dividend Yield
ZM does not distribute a dividend.
Share Repurchases
One thing I did not like about ZM when I initiated a position on August 22, 2023 was the extent to which the weighted average outstanding diluted shares was increasing by reason of SBC (see table above). Fortunately, however, management recognized the rate at which the number of outstanding shares was increasing was unsustainable. As noted in prior posts, SBC is being scaled back (~$1.286B, ~$1.057B, and ~$0.931B in FY2023 – FY2025 and ~$0.202B in Q1 2026) and share repurchases now appear to be a means by which the company is allocating capital (see table above).
In February 2024, ZM’s Board authorized a stock repurchase program of up to $1.5B of its Class A common stock. In November 2024, the Board authorized the repurchase of additional $1.2B of its outstanding Class A common stock. ZM repurchased and subsequently retired 5,561,920 shares of its Class A common stock for an aggregate amount of ~$0.418B in Q1 2026.
When ZM released its Q4 and FY2025 results and FY2026 outlook in February, the outlook was for an increase in the weighted average number of outstanding shares (~318 million from ~315 million in FY2025). The revised FY2026 outlook, however, now calls for this to be reduced to 312 million AND this does not account for $1.2B of the repurchase authorization available as of April 30, 2025.
Valuation
On May 27, a young investor I am helping on their journey to financial freedom acquired shares @ ~$79.64; I do not disclose details for confidentiality reasons.
Management’s current FY2026 adjusted diluted EPS outlook is $5.56 – $5.59. Using the ~$79.64 purchase price and the ~$5.575 mid point of management’s outlook, the forward adjusted diluted PE is ~$14.29.
Using this recent purchase price and the currently available adjusted diluted EPS broker estimates, ZM’s forward adjusted diluted PE levels are:
- FY2026 – 24 brokers – ~14.32 using a mean of $5.56 and low/high of $5.35 – $5.77.
- FY2027 – 30 brokers – ~ 14 using a mean of $5.67 and low/high of $5.17 – $6.77.
- FY2028 – 15 brokers – ~ 13.4 using a mean of $5.94 and low/high of $4.96 – $7.46.
When I wrote my February 25, 2025 post, I had just acquired an additional 100 shares @ ~$73.60 in one of the ‘Core’ accounts in the FFJ Portfolio. ZM’s FY2026 outlook at the time was for adjusted diluted EPS of $5.34 – $5.37. Using my purchase price, the forward adjusted diluted PE was ~14.3.
Using my purchase price and the available adjusted diluted EPS broker estimates, ZM’s forward adjusted diluted PE levels were:
- FY2026 – 31 brokers – ~13.7 using a mean of $5.39 and low/high of $4.84 – $5.99.
- FY2027 – 29 brokers – ~ 13.4 using a mean of $5.51 and low/high of $5.00 – $6.62.
- FY2028 – 13 brokers – ~ 13 using a mean of $5.70 and low/high of $4.70 – $6.75.
I place little reliance on broker estimates and almost no reliance on any estimates beyond those for the current fiscal year. This is because much can happen beyond the current fiscal year that can make these estimates irrelevant. Furthermore, the disparity in estimates suggests many brokers have very different outlooks.
Conventional FCF Calculation
At the time of my February 25 post, ZM’s FY2026 FCF guidance was $1.68B – $1.72B. Management’s weighted average diluted shares outstanding estimate for FY2026 was 318 million shares.
Using management’s outlook, I arrived at a FY2026 FCF/share estimate of ~$5.28 – ~$5.41. Based on my ~$73.60 purchase price, the forward P/FCF was ~13.6 – ~14.
Now, the FCF guidance remains the same but the weighted average diluted shares outstanding estimate for FY2026 is 312 million shares thus giving us a FCF/share estimate of ~$5.39 – ~$5.51. Based on the recent ~$79.64 purchase price, the forward P/FCF is ~14.45 – ~14.8.
Modified FCF Calculation
SBC has been trending lower in recent years and in Q1 2026, SBC was ~27.856 million lower than in Q1 2025. If the remaining 3 quarters are similar to Q1 2026, FY2026 SBC should be ~$0.111B lower than in FY2025 or ~$0.8205B versus ~$0.9313. If the weighted average number of outstanding shares drops to ~312 million for the year, we arrive at ~$2.63 FCF/share. Divide the young investor’s recent ~$79.64 purchase price and the P/FCF is ~30.3.
In my February 25 post I wrote:
If the FY2026 SBC increases from the FY2025 level of ~$0.931B to ~$1B, the FY2026 FCF range drops to ~$0.68B – ~$0.72B. I calculate this range by subtracting ~$1.0B from management’s FY2026 FCF outlook. Taking the ~$0.7B mid-point and dividing it by 318 million shares, I arrive at a FY2026 FCF/share estimate of ~$2.20. Divide my ~$73.60 purchase price by ~$2.20 and the P/FCF is ~33.5.
Should ZM repurchase ~$1.6B of its shares at attractive valuations throughout FY2026, the weighted average number of outstanding shares should be less than 318 million. The FCF/share should be somewhat greater than ~$2.20 meaning that the P/FCF should be better than ~33.5.
Final Thoughts
I continue to hold 1000 ZM shares at an average cost of ~$64.38 in a ‘Core’ account within the FFJ Portfolio. ZM, however, is not a top 30 holding.
In October 2020, some investors ponied up ~$565/ZM share. ZM, however, generated ~$2.651B in Revenue, ~$0.672B in Net income per share attributable to common stockholders, and cash and cash equivalents and marketable securities totaled ~$4.24B in the fiscal year ending January 31, 2021.
In Q1 2026 alone, ZM generated ~$1.175B in Revenue and ~$0.255B in Net income per share attributable to common stockholders and cash and cash equivalents and marketable securities at the end of the quarter totaled ~$7.8B AFTER ~$1.51B of share repurchases in the most recent 5 quarters. Shares, however, trade at just under $80. Quite possibly, some ‘investors’ who purchased ZM shares in October 2020 would not even think of investing in ZM in the current environment.
As a relatively risk averse investor, my risk tolerance carries over to the investment recommendations I make to the young investors I am helping on their journey to financial freedom. Although their investment time horizon is much longer than mine, in the back of my mind I always remember Warren Buffett’s and Charlie Munger’s two rules of investing:
- Don’t lose money.
- Don’t forget rule #1.
While ZM’s total investment return could lag that of other ‘high flying’ companies, many ‘high flying’ companies are very richly valued. This makes their share price susceptible to a significant pullback in the event of market corrections.
Non-investment grade credit ratings are also assigned to the debt of some of these ‘high flying’ companies. Given my earlier comments, I think it is wise to avoid heavily indebted companies.
ZM’s Balance Sheet may be bloated with cash and cash equivalents and marketable securities. This, however, gives the company the liberty to make capital allocation decisions indebted companies are unable to entertain.
I currently consider ZM’s fair value to be in the low $90s. If it continues to perform as in recent quarters and to repurchase shares quarterly at levels similar to the last few quarters, it is conceivable that its fair value could reach ~$100 within the next 12 – 18 months for a ~25% improvement from the May 27 purchase price of ~$79.64.
I wish you much success on your journey to financial freedom!
Note: Please send any feedback, corrections, or questions to finfreejourney@gmail.com.
Disclosure: I am long ZM.
Disclaimer: I do not know your circumstances and do not provide individualized advice or recommendations. I encourage you to make investment decisions by conducting your research and due diligence. Consult your financial advisor about your specific situation.
I wrote this article myself and it expresses my own opinions. I do not receive compensation for it and have no business relationship with any company mentioned in this article.