 In my last Danaher Corporation (DHR) review, I disclose the purchase of an additional 100 shares @ $188.30 on July 21, 2025 in a ‘Core’ account in the FFJ Portfolio; my DHR exposure is currently 902 shares. By the time I wrote my post, however, DHR’s share price had risen to ~$197.40. Despite the increase in DHR’s share price, I still considered shares to be undervalued.
At the time of that review, the Q2 and YTD2025 results were the most current. With the release of Q3 and YTD2025 results on October 21, 2025, this is a good time to revisit this holding.
Business Overview
DHR is a global science and technology innovator committed to accelerating the power of science and technology to improve human health. It is comprised of more than 18 operating companies with leadership positions in the biotechnology, life sciences and diagnostics sectors, organized under three segments (Biotechnology, Life Sciences and Diagnostics). Its research and development, manufacturing, sales, distribution, service and administrative facilities are located in more than 50 countries.
Links to the websites of the entities under the DHR umbrella are accessible here.
Part 1 Item 1 in the Form 10-K that is accessible through the SEC Filings section of the company’s website provides ample information to learn about the company.
Financials
Q3 and YTD2025 Results
On October 21, DHR released Q3 and YTD2025 results and affirmed its FY2026 guidance. Refer to the material available in the Quarterly Earnings section of DHR’s website.
On the Q3 2025 earnings call with analysts, management states:
Sales were ~$6.1B in Q3 and we delivered ~3% core revenue growth. Geographically, core revenues in developed markets were up mid-single digits with North America up mid-single digits and Western Europe approximately flat. Core revenues in high-growth markets were up low single digits as solid performance outside of China was offset by a mid-single-digit decline in China. Growth in our Biotechnology and Life Sciences businesses in China was more than offset by declines in Diagnostics due to volume-based procurement and reimbursement policy changes implemented in the last 12 months.
Our gross profit margin for Q3 was ~58.2%, and our adjusted operating profit margin of ~27.9% was up 40 bps YoY as the favorable impact of higher volume leverage and disciplined cost management more than offset the impact of productivity investments.
Adjusted diluted net earnings per common share of $1.89 were up ~10% YoY. We generated $1.4B of FCF in the quarter and ~$3.5B in the first 3 quarters of the year, resulting in a YTD FCF to net income conversion ratio of 146%.
The section entitled ‘Business Performance and Outlook’ that commences on page 31 of 53 in DHR’s Q3 2025 Form 10-Q reflects:
Danaher operates a diversified global supply chain and sources parts and materials globally. During 2025, the U.S. has implemented significant new tariffs on imports from a wide range of countries, which has also prompted retaliatory tariffs by a number of countries, including tariffs and export restrictions on certain manufacturing components imposed by China and tariffs pursuant to trade agreements the U.S. has entered into with certain countries. In addition, a number of new tariffs have been threatened and the U.S. and other countries continue to negotiate trade arrangements and tariff levels. In August 2025, the U.S. Court of Appeals for the Federal Circuit ruled against certain of the U.S. tariffs that have been implemented. The U.S. administration has appealed this ruling and the U.S. Supreme Court has agreed to hear the case, with oral arguments anticipated in November 2025.
Based on the tariffs enacted and in effect as of October 19, 2025 (the “enacted tariffs”), the Company anticipates incurring incremental tariff costs for the full year 2025 of several hundred million dollars. These incremental costs from the enacted tariffs reflect their impact on the costs of parts and materials used by the Company to produce products, as well as costs the Company incurs on finished goods shipped to customers. The Company expects to, and has thus far, largely offset the operating profit impact of the enacted tariffs with manufacturing footprint changes, supply chain adjustments, surcharges and additional productivity and cost savings actions. To the extent the Company is unable to continue to offset the incremental cost from the enacted tariffs, the enacted tariffs negatively impact demand or the export restrictions negatively impact manufacturing, the Company’s revenue and profitability would be adversely impacted. If delayed tariffs come into effect or other additional tariffs are adopted, the Company would incur additional tariff costs that could be material and the Company’s revenue and profitability could be adversely impacted.
In addition to changes in trade policy, the new U.S. administration has implemented a number of other regulatory, policy and personnel changes, including the elimination, downsizing and reduced funding of certain government agencies and programs and the cancellation or delay of government contracts and research grants, each of which may be exacerbated by the U.S. government shutdown that began in October 2025. In addition, the administration has changed the composition of and guidance from advisory panels on healthcare practices.
The full impact of the matters noted above on the Company, our customers, end-users and business partners, the overall economy and capital markets remains uncertain. The Company currently expects academic and government demand to remain weaker with ongoing uncertainty around research funding and a cautious bioprocessing equipment spending environment.
Investors would be wise not to fixate on DHR’s short-term business challenges. They are unlikely to persist in perpetuity, and therefore, we should concern ourselves with how management navigates the company during periods of economic upheaval.
Many retail investors often overlook a company’s effective tax rate to their detriment. Fortunately, DHR is acutely aware of the impact of taxes on its results (see page 16 in the Q3 2025 Form 10-Q).
The Company operates globally, including in certain jurisdictions with lower tax rates than the U.S. federal statutory rate. Therefore, the impact of Danaher’s global operations and benefits from tax credits and incentives contributes to a lower effective tax rate compared to the U.S. federal statutory tax rate. For each period presented, the effective tax rate differs from the U.S. federal statutory rate of 21.0% principally due to the impact of the Company’s global operations, research tax credits, foreign-derived intangible income and aggregate net discrete benefits or charges.
For the three-month period ended September 26, 2025, the effective tax rate was reduced by the tax effect from intangible asset impairments in jurisdictions with higher statutory tax rates than the Company’s effective tax rate, which reduced the effective tax rate by 1.3%.
Conventional And Modified Free Cash Flow (FCF) Calculations (FY2019 – FY2024 and the first 9 months of FY2024 and FY2025)
In several posts I express my thoughts about the way many companies calculate Free Cash Flow (FCF). Since FCF is a non-GAAP metric, there is no standardization in its calculation.
In most cases, companies merely deduct net CAPEX from net cash flows from operating activities. I think it is also necessary to deduct share based compensation (SBC).
Many companies employ SBC as part of their employee compensation plans and reflect this cost within the Income Statement. Because SBC involves no cash outlay, however, companies add back SBC to determine net cash flows from operating activities in the Condensed Consolidated Statement of Cash Flows.
Suppose, however, that DHR were to compensate employees 100% by way of SBC. Since there is no cash outlay, the full amount of its employee compensation is added back in the Condensed Consolidated Statement of Cash Flows to determine net cash flows from operating activities.
If, on the other hand, DHR were to have no SBC and were to actually disburse funds to pay its employees, nothing would be added back in the Condensed Consolidated Statement of Cash Flows.
By merely changing the manner in which it compensates its employees we get very different net cash flows from operating activities! How does this make any sense? Is the use of SBC not a form of ‘financing’? Would it be more proper to reflect SBC within the Cash Flows From Financing Activities section of the Condensed Consolidated Statement of Cash Flows? This way, we would arrive at similar FCF results no matter how a company chooses to compensate its employees.
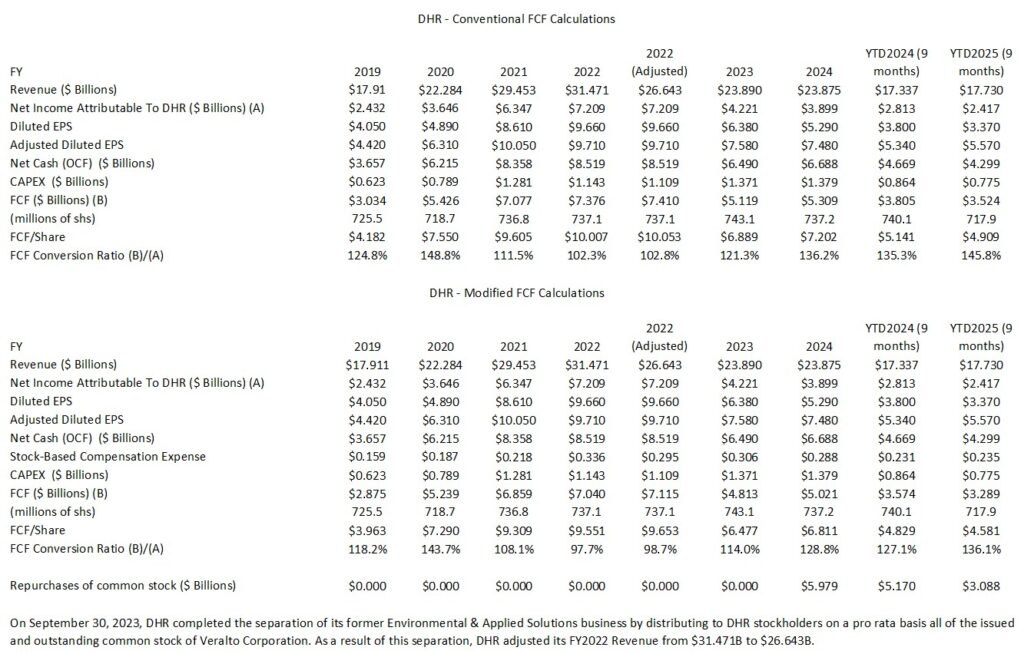
The following table reflects data extracted from the FY2019 – FY2024 and Q2 2025 reconciliation of GAAP and non-GAAP financial measures and supplemental forward-looking information documents that are accessible here. The section with the modified FCF calculations deducts share based compensation (SBC) from total operating cash provided by continuing operations.
In revisiting the historical data, I noticed that I inadvertently neglected to reflect DHR’s adjustment to its FY2022 revenue. Despite this oversight, there is no change in my assessment of DHR’s long-term outlook.
Strong free cash flow generation is one of the most important metrics at DHR. FY2024 marked the 33rd consecutive year of FCF to net income conversion which exceeded 100%. If we deduct SBC to determine FCF, however, DHR just fell short of 100% in FY2022. While there remains another quarter in DHR’s FY2025 fiscal year, DHR is ‘on track’ to record its 34th consecutive year in which FCF (calculated the in the conventional manner) exceeds GAAP earnings.
FY2025 Outlook
DHR’s Q3 2025 earnings release reflects the following:
The Company does not reconcile Non-GAAP forecasted core sales growth and adjusted diluted net earnings per common share to their respective, comparable measure prepared in accordance with U.S. generally accepted accounting principles (GAAP) (except for estimated amortization of acquisition-related intangible assets of $1.7 billion for the year ending December 31, 2025 and the estimated impact of foreign currency on sales, which for the full year 2025 is estimated to increase sales by 1.0%, assuming the currency exchange rates in effect as of September 26, 2025) because the additional elements that would be reflected in any such GAAP measures (such as the impact of currency exchange rates on profitability, acquisitions, divested product lines, discrete tax adjustments, impairments, gains and losses on investments and the outcome of legal proceedings) are difficult to predict and estimate and are often dependent on future events that may be uncertain or outside of our control. The impact of these additional elements could be material to our results computed in accordance with GAAP.
For full year 2025, the Company is maintaining its full year adjusted diluted net earnings per common share guidance range of $7.70 to $7.80. This includes an expectation that non-GAAP core revenue will grow low-single digits year-over-year for the full year 2025.
Preliminary FY2026 Outlook
Management will provide formal guidance on the Q4 2025 earnings call in January. It did, however, provide preliminary FY2026 guidance on the October 21 earnings call.
Management expects ~3% – ~6% core revenue growth assuming modest recovery across DHR’s end markets.
The preliminary assumptions are:
- Bioprocessing growth trends remain at levels consistent with 2025 including continued strength in consumables driven by healthy growth in monoclonal antibody demand and strong positioning across the biologics workflow.
- Life Sciences experiences a modest improvement in end markets. Growth, however, will remain below historical levels given the current geopolitical and policy environment.
- Diagnostics will experience higher growth in 2026 due to moving past headwinds from policy changes in China.
- Respiratory revenue at Cepheid will be ~$1.7B in 2026 which is consistent with DHR’s FY2025 expectations.
- Anticipated core revenue growth and the benefit of the various 2025 productivity initiatives are expected to lead to more than 100 bps of adjusted operating profit margin expansion. This would result in high single-digit adjusted EPS growth before any benefit from capital allocation.
Risk Assessment
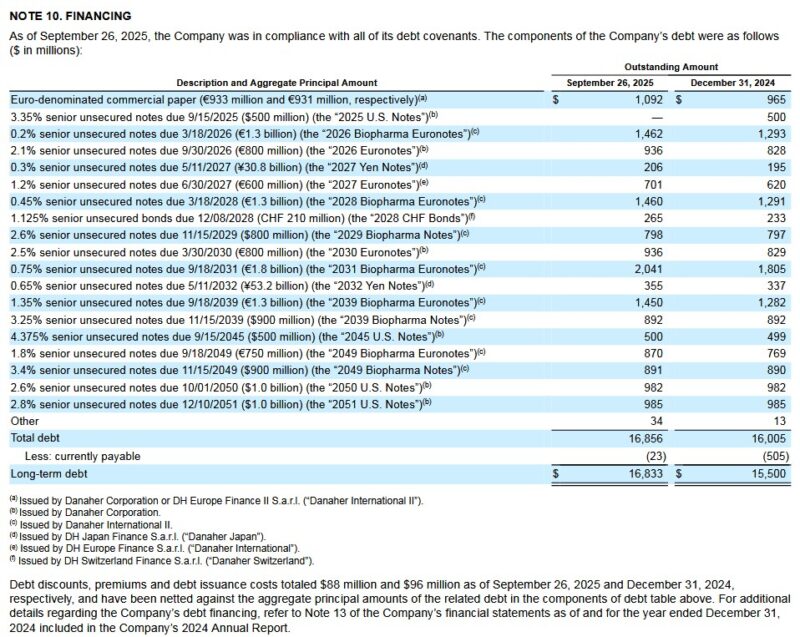
DHR has credit arrangements at very attractive rates. In addition, the scheduled maturity dates are well staggered.
~$2.4B of its long-term debt matures in 2026. I do not, however, foresee an issue in DHR’s ability to repay this debt from:
- cash generated from normal business operations and/or
- proceeds from new debt with maturity dates further out on the calendar.
The following schedule reflects DHR’s long term debt at the end of Q3 2025 and FYE2024.
DHR’s credit ratings remain the same from my last review.
- Moody’s: Upgraded to A3 from Baa1 on October 10, 2022. June 18, 2024 is the last review date and the outlook remains stable.
- S&P Global: Upgraded to A- from BBB+ on June 11, 2022. June 23, 2025 is the last review date and the outlook remains stable.
Both ratings are at the bottom tier of the upper-medium investment-grade tier. They define DHR as having a STRONG capacity to meet its financial commitments. DHR, however, is somewhat more susceptible to the adverse effects of changes in circumstances and economic conditions than obligors in higher-rated categories.
These ratings satisfy my conservative investment profile.
Dividend and Dividend Yield
DHR’s quarterly dividend is likely to remain a negligible component of the total investment return. Do not, however, fixate on dividend metrics. Focus on total potential long-term investment returns!
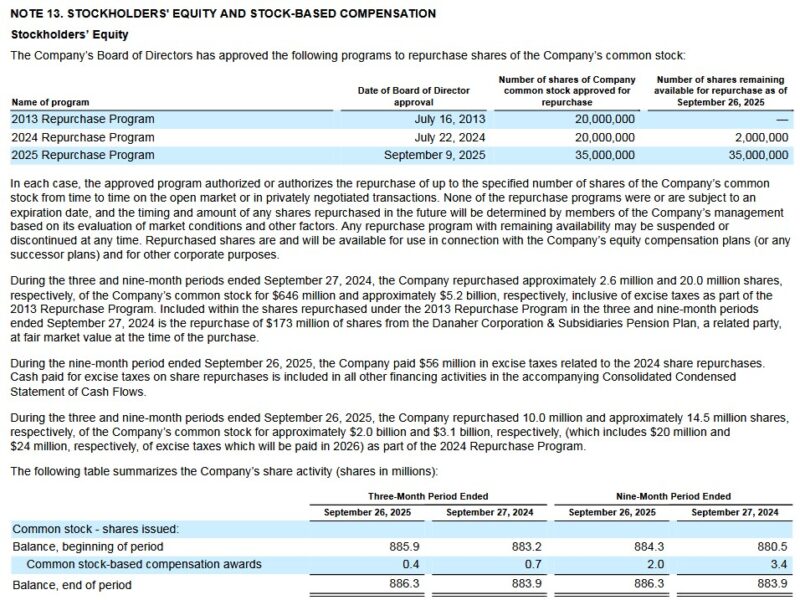
The table found in the Conventional And Modified Free Cash Flow (FCF) Calculations (FY2019 – FY2024 and the first 9 months of FY2024 and FY2025) section of this post shows that DHR has repurchased $9.067B of its issued and outstanding shares in recent quarters.
This table reflects 717.9 million as the weighted average number of diluted shares outstanding in FY2025. In Q3 2025, however, the weighted average had been reduced to 713.9 million.
The following is extracted from DHR’s Q3 2025 Form 10-Q. The 886.3 million shares at September 26, 2025 reflected below are the number of issued shares. This figure is not to be confused with the 713.9 million shares outstanding.
Valuation
DHR’s adjusted diluted earnings forecast for FY2025 remains at $7.70 – $7.80. The share price, however, closed at $220.77 on October 20 which is well above my last purchase price of $188.30 and ~$197.40 at the time I published by July 23, 2025 post.
In the first 9 months of FY2025, DHR has generated diluted EPS and adjusted diluted EPS of $3.37 and $5.57. In essence, DHR needs to generate ~$2.18 of adjusted diluted EPS in Q4 to reach the $7.75 mid-point of management’s FY2025 outlook.
Using the current $220.77 share price and the currently available broker adjusted diluted EPS estimates, the forward adjusted diluted PE levels are:
- FY2025 – 23 brokers – mean of $7.73 and low/high of $7.67 – $7.86. Using the mean, the forward adjusted diluted PE is ~28.6.
- FY2026 – 23 brokers – mean of $8.42 and low/high of $8.30 – $8.72. Using the mean, the forward adjusted diluted PE was ~26.2.
- FY2027 – 16 brokers – mean of $9.29 and low/high of $8.99 – $9.61. Using the mean, the forward adjusted diluted PE was ~23.8.
- FY2028 – 7 brokers – mean of $10.28 and low/high of $9.62 – $10.78. Using the mean, the forward adjusted diluted PE was ~21.5.
In the first 9 months of FY2025, DHR’s FCF/share is $4.909 and $4.581 (see table above) calculated using the conventional and the modified methods.
If it generates 33.3% of YTD2025 FCF in Q4, its FY2025 FCF calculated using the conventional and modified methods, should be ~$6.55 and ~$6.11. Erring on the side of caution, I use ~$6.50 and ~$6.06 to estimate DHR’s forward P/FCF.
Using the current $220.77 share price, the forward P/FCF is ~34 and ~36.4 using FCF calculated using the conventional and modified methods. These levels are slightly higher than at the time of my prior post.
For ease of comparison, I reflected the following in my July 23, 205 post:
In Q1, DHR generated diluted and adjusted diluted EPS of $1.32 and $1.88. In Q2, it generated diluted and adjusted diluted EPS of $0.77 and $1.80. YTD2025 diluted and adjusted diluted EPS total $2.09 and $3.68. If it generates similar diluted and adjusted diluted EPS in the second half of the year, FY2025 diluted and adjusted diluted EPS could be ~$4.18 and ~$7.36.
Management’s revised adjusted diluted earnings forecast for FY2025, however, is $7.70 – $7.80 versus previous guidance of $7.60 – $7.75. Using my recent $188.30 purchase price, the forward adjusted diluted PE range is ~24.1 – ~24.45.
With shares currently trading at ~$197.40, the forward adjusted diluted PE range is ~25.3 – ~25.64.
Using my recent $188.30 purchase price and the currently available broker earnings estimates, the forward adjusted diluted PE levels are:
- FY2025 – 26 brokers – mean of $7.76 and low/high of $7.65 – $7.90. Using the mean, the forward adjusted diluted PE is ~24.3.
- FY2026 – 25 brokers – mean of $8.59 and low/high of $8.32 – $9.00. Using the mean, the forward adjusted diluted PE was ~22.
- FY2027 – 17 brokers – mean of $9.51 and low/high of $9.05 – $10.15. Using the mean, the forward adjusted diluted PE was ~20.
- FY2028 – 8 brokers – mean of $10.61 and low/high of $10.20 – $11.55. Using the mean, the forward adjusted diluted PE was ~17.7.
The valuation is slightly higher if we use the current ~$197.40 share price.
These estimates are likely to change over the coming days since results have just been released.
For comparison, the following are my valuation estimates in my April 25, 2025 post. I used the current broker guidance and the April 24 closing share price of ~$196.50.
- FY2025 – 26 brokers – mean of $7.70 and low/high of $7.60 – $7.83. Using the mean, the forward adjusted diluted PE is ~25.5.
- FY2026 – 25 brokers – mean of $8.56 and low/high of $8.21 – $8.85. Using the mean, the forward adjusted diluted PE is ~23.
- FY2027 – 18 brokers – mean of $9.47 and low/high of $8.95 – $10.15. Using the mean, the forward adjusted diluted PE is ~20.7.
- FY2028 – 8 brokers – mean of $10.60 and low/high of $10.06 – $11.55. Using the mean, the forward adjusted diluted PE is ~18.5.
I place no credence in the FY2026 – FY2028 estimates as much can change over the next few years.
Earnings are subject to manipulation, and therefore, I prefer to value a company using free cash flow. Given that I rely on the more conservative modified FCF calculation method, my P/FCF estimates are higher than results calculated using the conventional method. The disparity between the conventional and modified calculations become increasingly pronounced the greater the SBC component.
In the first half of FY2025, DHR’s FCF/share is $2.99 and $2.78 (see table above) calculated using the conventional and the modified methods.
Given the current business environment, I anticipate that DHR’s FCF in the second half of FY2025 will be similar to the first half of the year. I, therefore, estimate that DHR’s FY2025 conventional and modified FCF/share will be ~$5.99 and ~$5.56. Using my recent $188.30 purchase price, my DHR forward P/FCF estimates are ~31.4 and ~33.9. With shares currently trading at ~$197.40, the forward P/FCF estimates increase to ~33 and ~35.5.
Final Thoughts
My final thoughts are the same as those in my July 23, 2025 post. DHR has undertaken various strategic acquisitions and divestitures in recent years. By shifting to attractive healthcare markets with high barriers to entry and impressive recurring consumables revenue streams, the business is now significantly less cyclical than historically.
DHR’s valuation is somewhat less attractive than in July 2025. It, however, remains an attractive investment for long-term investors.
Should DHR’s share price improve from the current ~$220.77 to ~$250 – below the ~$265 I consider to be a fair value – investors would generate a ~13% return. If the share price appreciates to $265, the return rises to ~20%.
As noted in the commentary extracted from DHR’s Q3 2025 Form 10-Q which is provided earlier in this post, management is of the opinion that the company will face challenging business conditions over the next few quarters. Once growth trends normalize, however, there should be a return to low double-digit earnings growth.
Until such time as business conditions normalize, I take comfort knowing that management has a solid track record of allocating capital to enhance shareholder returns regardless of market conditions.
DHR has repurchased $9.067B of its issued and outstanding shares in the last several quarters during which time shares have been undervalued. If shares remain undervalued, I envision more share repurchases.
At the end of Q3 2025, the company had Board approval to repurchase up to 37,000,000 shares (2,000,000 shares remaining from the 2024 repurchase program). I anticipate the diluted weighted average number of outstanding shares in Q4 2025 will drop below ~710 million from 713.7 million in Q3 2025.
I wish you much success on your journey to financial freedom!
Note: Please send any feedback, corrections, or questions to finfreejourney@gmail.com.
Disclosure: I am long DHR.
Disclaimer: I do not know your circumstances and do not provide individualized advice or recommendations. I encourage you to make investment decisions by conducting your research and due diligence. Consult your financial advisor about your specific situation.
I wrote this article myself and it expresses my own opinions. I do not receive compensation for it and have no business relationship with any company mentioned in this article.