![]()
In my December 20, 2025 post I look at Cintas’ (CTAS) Q2 and YTD2026 results. I also reference my December 8, 2025 post in which I raise the question of whether CTAS could take another run at trying to acquire Unifirst (UNF) – its largest US competitor.
On December 22, 2025, CTAS disclosed its proposal to acquire all outstanding UNF common and class B shares for $275.00/share. The Proposal, which was delivered to the UNF Board on December 12, 2025, implies a total value for UNF of ~$5.2B and offers UNF shareholders a 64% premium to UNF’s ninety-day average closing price as of December 11, 2025.
On March 11, 2026, CTAS disclosed that it and UNF had entered into a definitive agreement under which CTAS is to acquire UNF for $310.00/share in cash and stock, representing an enterprise value of ~$5.5B. This represents a multiple of 8.0x run-rate trailing 12 months EBITDA, including ~$0.375B of operating cost synergies.
The transaction is expected to close in the second half of calendar 2026, subject to customary closing conditions, approval by UNF shareholders and the receipt of certain regulatory approvals.
NOTE: The transaction has been unanimously approved by the CTAS and UNF Boards. Entities affiliated with the Croatti family, which control ~66.66% of the voting power of UNF’s common stock and Class B common stock, voting together as a class, have entered into a voting support agreement under which they have agreed to vote their shares in favor of the transaction.
There are no assurances regulatory approvals will be granted. CTAS and UNF, however, have already begun the process for satisfying these closing conditions and I expect the required regulatory approvals will be granted. I am, therefore, approaching my CTAS investment from the perspective that CTAS will become an even more dominant force in the North American uniform rental and facility services market once the UNF acquisition closes.
CTAS currently holds a ~39% market share and UNF captures ~15 – ~20% of the market.
Vestis (VSTS) (formerly Aramark Uniform Services) was spun-off from Aramark in late 2023. It holds roughly 20-25% of the market. The company was unprofitable in FY2025, generated negative free cash flow, carries considerable debt, and S&P Global and Moody’s assign non-investment grade credit ratings to its domestic unsecured long-term debt. I think VSTS is vulnerable to losing market share to CTAS given that it is competing from a position of weakness.
Business Overview
Part 1 Item 1 in the FY2025 Form 10-K and the company’s website provide a good overview of the company.
Financial Results
Q3 and YTD2026 Results
The March 25, 2026 earnings release reflecting Q3 and YTD2026 results is accessible through CTAS’s website (a link to the company’s EDGAR Filings on the SEC website).
Looking at CTAS’s Q3 and YTD2026 results, we see that is continues to ‘fire on all cyclinders’. Each of its three route-based businesses (uniform and work apparel, facility services, and first aid & safety) continue to grow at attractive rates. Adjusting for the impacts of acquisitions and foreign currency exchange rate fluctuations, CTAS’s organic revenue growth rate was 8.2%. In addition, CTAS achieved all-time high gross margins in each of its three route-based businesses.
Gross margin as a percent of revenue was 51%, a 40 bps increase over the prior year.
Operating income in Q3 2026 grew to ~$0.660B, an increase of ~8.2% over Q3 2025. Adjusting for a one-time gain on the sale of property and equipment in Q3 2025, operating income would have grown ~11%. Diluted EPS of $1.24 in Q3 2026 grew 9.7% over Q3 2025. Adjusting for the one-time gain in Q3 2025, diluted EPS would have grown ~12.7%.
Conventional And Modified Free Cash Flow (FCF) Calculations (FY2020 – FY2025 and YTD2026)
FCF is a non-GAAP measure, and therefore, its method of calculation is open to debate. Most companies subtract capital expenditures (CAPEX) from Net Cash Provided by Operating Activities found in the Consolidated Statement of Cash Flows.
The ‘conventional’ calculations do not deduct share-based compensation (SBC) while the ‘modified’ calculations deduct SBC. In several posts, I touch upon why I deduct SBC when analyzing a company’s FCF.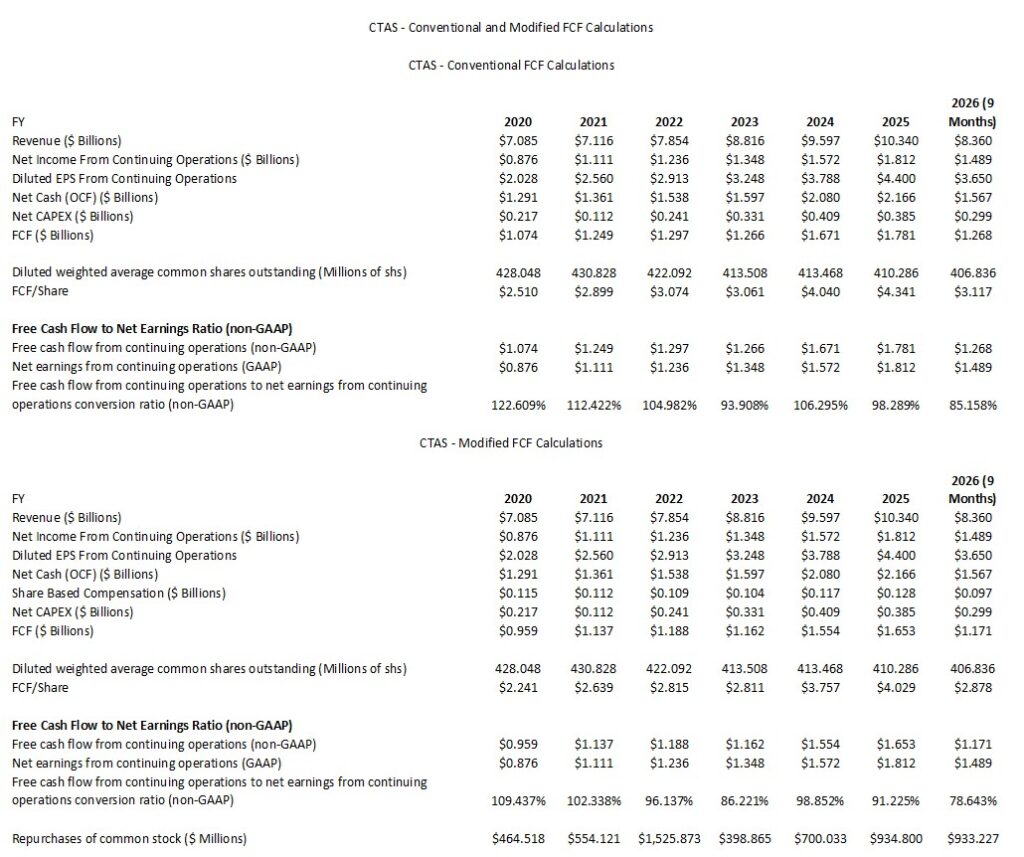
ROIC and WACC
Return on Invested Capital (ROIC) provides an indication of a company’s efficiency. In essence, is a company actually creating value or ‘burning’ cash for the sake of growth?
A company with a higher ROIC is mathematically worth more because it requires less reinvestment to achieve that growth.
A good indication of how well a company is performing is to compare ROIC to the Weighted Average Cost of Capital (WACC). WACC, however, is not a metric officially reported by CTAS but it can be roughly estimated based on the company’s credit profile and market conditions.
The generally accepted high-level formula used by Wall Street is:
ROIC = NOPAT/Average Invested Capital
with the Net Operating Profit After Tax (NOPAT) formula being Operating Income (EBIT) x (1-tax rate)
This shows how much profit the core business makes while ignoring how much debt the company has.
The Average Invested Capital is the total money tied up in the business.
- The Operating Approach formula is
- The Financing Approach is
CTAS successfully offsets higher labor and energy costs through route optimization and a shift toward higher-margin ‘Other’ services (First Aid and Safety).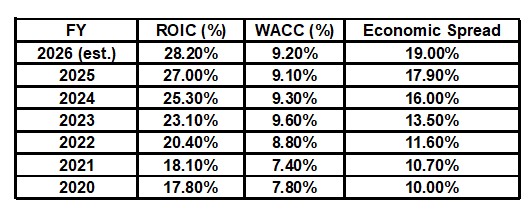
FY2026 Outlook
Current Outlook with the release of Q3 2026 results
- FY2025 and FY2026 having the same number of workdays for the year and by quarter;
- The exclusion of any future acquisitions, economic disruptions or downturn;
- A constant foreign currency exchange rate;
- Adjusted diluted EPS guidance excludes estimated non-recurring transaction costs related to the UNF acquisition. Transaction costs related to this impending acquisition incurred during FY2026 are estimated to have an impact on diluted EPS in a range of $0.03 – $0.04.
- FY2026 net interest of ~$0.101B compared to $95.5 million in FY2025, primarily as a result of refinancing senior notes at a higher interest rate in Q4 2025, as well as higher variable rate interest expense from commercial paper as a result of buyback activity during FY2026. Expected net interest may change as a result of future share buybacks or acquisition activity.
- A ~20% effective tax rate which is the same as FY2025.
Current Outlook with the release of Q2 2026 results
- FY2025 and FY2026 having the same number of workdays for the year and by quarter;
- The exclusion of any future acquisitions;
- A constant foreign currency exchange rate;
- FY2026 net interest of ~$0.104B compared to $95.5 million in FY2025, primarily as a result of refinancing senior notes at a higher interest rate in Q4 2025, as well as higher variable rate interest expense from commercial paper as a result of buyback activity during FY2026. Expected net interest may change as a result of future share buybacks or acquisition activity.
- A ~20% effective tax rate which is the same as FY2025.
Prior Outlook with the release of Q1 2026 results
- FY2025 and FY2026 having the same number of workdays for the year and by quarter;
- The exclusion of any future acquisitions;
- A constant foreign currency exchange rate;
- FY2026 net interest of ~$0.097B compared to $95.0 million in FY2025, primarily as a result of refinancing senior notes at a higher interest rate, partially offset by lower variable rate interest. Expected net interest may change as a result of future share buybacks or acquisition activity.
- A ~20% effective tax rate which is the same as FY2025.
Prior Outlook with the release of Q4 2025 results
- FY2025 and FY2026 have the same number of workdays for the year and by quarter;
- The exclusion of any future acquisitions;
- A constant foreign currency exchange rate;
- FY2026 net interest of ~$0.098B.
- A ~20% effective tax rate which is the same as FY2025.
Risk Assessment
Moody’s and S&P Global anticipate CTAS will use about $2.8B of debt along with common equity. The expected use of cash and stock to fund the transaction demonstrates management’s commitment to maintaining financial flexibility and both expect the company’s pro forma leverage will increase to about 1.5x at closing from 0.8x in FY2026. Despite this expected increase, neither rating agency is placing CTAS under review with a negative outlook.
No change from the following domestic senior unsecured long-term debt ratings is expected.
- Moody’s: A3 with a stable outlook (last reviewed on May 7, 2025)
- S&P Global: A- with a stable outlook (last reviewed on March 18, 2026)
Both ratings are the bottom tier of the upper medium-grade investment-grade category. These ratings define CTAS as having a strong capacity to meet its financial commitments. It is, however, somewhat more susceptible to the adverse effects of changes in circumstances and economic conditions than obligors in higher-rated categories.
Dividends and Share Repurchases
Dividend and Dividend Yield
CTAS’s dividend history is accessible here.
Little of CTAS’s total long-term shareholder return is likely to come from the quarterly dividend. I, therefore, disregard the dividend component of this investment when assessing CTAS as an investment.
Share Repurchases
On October 28, 2025, CTAS announced a new $1B stock buyback authorization.
The table provided in the Conventional And Modified Free Cash Flow (FCF) Calculations (FY2020 – FY2025 and YTD2026) section of this post reflects the dollar value of shares repurchased and the diluted weighted average common shares outstanding in FY2020 – FY2025 and YTD2026.
CTAS has been opportunistically repurchasing shares. If/once CTAS completes the UNF acquisition in the second half of 2026, I anticipate share repurchases will be dialed back with the company focusing on debt reduction. This is what CTAS did following its acquisition of G&K Services, Inc. in early 2017.
Valuation
Management’s FY2026 adjusted diluted EPS outlook is $4.86 – $4.90. Shares currently trade at ~$176.86 as I compose this post thus giving us a forward adjusted diluted PE range of ~36.1 – ~36.4.
Its valuation using the current broker guidance is:
- FY2026 – 23 brokers – mean of $4.88 and low/high of $4.84 – $4.93. Using the mean, the forward adjusted diluted PE is ~36.2.
- FY2027 – 23 brokers – mean of $5.42 and low/high of $5.24 – $5.59. Using the mean, the forward adjusted diluted PE is ~32.6.
- FY2028 – 15 brokers – mean of $6.02 and low/high of $5.62 – $6.80. Using the mean, the forward adjusted diluted PE is ~29.4.
I continue to estimate that the FY2026 FCF conversion ratio will be ~98% (calculated under the conventional method) and ~94% (calculated under the modified method). Using a ~$4.88 mid-point of management’s FY2026 guidance, CTAS’s FY2026 FCF is likely to be ~$4.78 (conventional) and ~$4.59 (modified). From these figures and the current ~$176.86 share price, I estimate CTAS’s forward P/FCF is ~37 and ~38.5 (calculated using the conventional and modified FCF values).
These valuations will undoubtedly change once CTAS completes its acquisition of UNF.
When I last reviewed CTAS in this December 20, 2025 post, I reflected the following:
The current share price is ~$187.60. Using management’s current $4.81 – $4.88 adjusted diluted EPS outlook, the forward adjusted diluted PE is ~38.4 – ~39.
NOTE: CTAS’s diluted EPS and adjusted diluted EPS are likely to continue to be relatively similar.
Its valuation using the current broker guidance is:
- FY2026 – 21 brokers – mean of $4.87 and low/high of $4.80 – $4.94. Using the mean, the forward adjusted diluted PE is ~38.5.
- FY2027 – 21 brokers – mean of $5.40 and low/high of $5.24 – $5.57. Using the mean, the forward adjusted diluted PE is ~34.7.
- FY2028 – 13 brokers – mean of $5.95 and low/high of $5.62 – $6.25. Using the mean, the forward adjusted diluted PE is ~31.5.
I continue to estimate that the FY2026 FCF conversion ratio will be ~98% (calculated under the conventional method) and ~94% (calculated under the modified method). Using a ~$4.85 mid-point of management’s FY2026 guidance, CTAS’s FY2026 FCF is likely to be ~$4.75 (conventional) and ~$4.56 (modified). From these figures and the current ~$187.60 share price, I estimate CTAS’s forward P/FCF is ~39.5 and ~41.1 (calculated using the conventional and modified FCF values).
This could significantly change depending upon the extent to which CTAS repurchases shares.
For comparison, the following is my valuation commentary from November 3, 2025 post.
Using my recent $181.455 purchase price and management’s current $4.74 – $4.86 adjusted diluted EPS outlook, the forward adjusted diluted PE is ~37.3 – ~38.3.
NOTE: CTAS’s diluted EPS and adjusted diluted EPS are likely to continue to be relatively similar.
Its valuation using the current broker guidance is:
- FY2026 – 19 brokers – mean of $4.84 and low/high of $4.78 – $4.90. Using the mean, the forward adjusted diluted PE is ~37.5.
- FY2027 – 19 brokers – mean of $5.36 and low/high of $5.15 – $5.55. Using the mean, the forward adjusted diluted PE is ~33.9.
- FY2028 – 10 brokers – mean of $5.92 and low/high of $5.53 – $6.20. Using the mean, the forward adjusted diluted PE is ~30.7.
I continue to estimate that the FY2026 FCF conversion ratio will be ~98% (calculated under the conventional method) and ~94% (calculated under the modified method). Using a $4.80 mid-point of management’s FY2026 guidance, CTAS’s FY2026 FCF is likely to be ~$4.70 (conventional) and ~$4.51 (modified). From these figures and my ~$181.455 purchase price, I estimate CTAS’s forward P/FCF is ~38.6 and ~40.2 (calculated using the conventional and modified FCF values).
This could significantly change depending upon the extent to which CTAS repurchases shares.
Final Thoughts
CTAS stands to become an even more dominant industry participant once it completes the UNF acquisition.
Despite the considerable premium it is paying to acquire UNF I am confident my CTAS investment will be far more valuable a decade from now.
I currently hold 702 CTAS shares in a ‘Side’ account in the FFJ Portfolio at an average cost of ~$186.5028. It was my 29th largest holding when I completed my 2025 Year-End Investment Holdings Review.
Shares appear to be currently undervalued, and therefore, a couple of young investors I am helping on their journey to financial freedom have increased their CTAS exposure at my urging on March 26 at an average cost of ~$176.39.
I wish you much success on your journey to financial freedom!
Note: Please send any feedback, corrections, or questions to finfreejourney@gmail.com.
Disclosure: I am long CTAS.
Disclaimer: I do not know your circumstances and do not provide individualized advice or recommendations. I encourage you to make investment decisions by conducting your research and due diligence. Consult your financial advisor about your specific situation.
I wrote this article myself and it expresses my own opinions. I do not receive compensation for it and have no business relationship with any company mentioned in this article.