 I last reviewed Agilent (A) in this May 30, 2025 post, at which time the most current financial information was for Q2 and YTD2025. With the release of Q3 and YTD2025 results and revised FY2025 outlook on August 27, I revisit this existing holding.
Business Overview
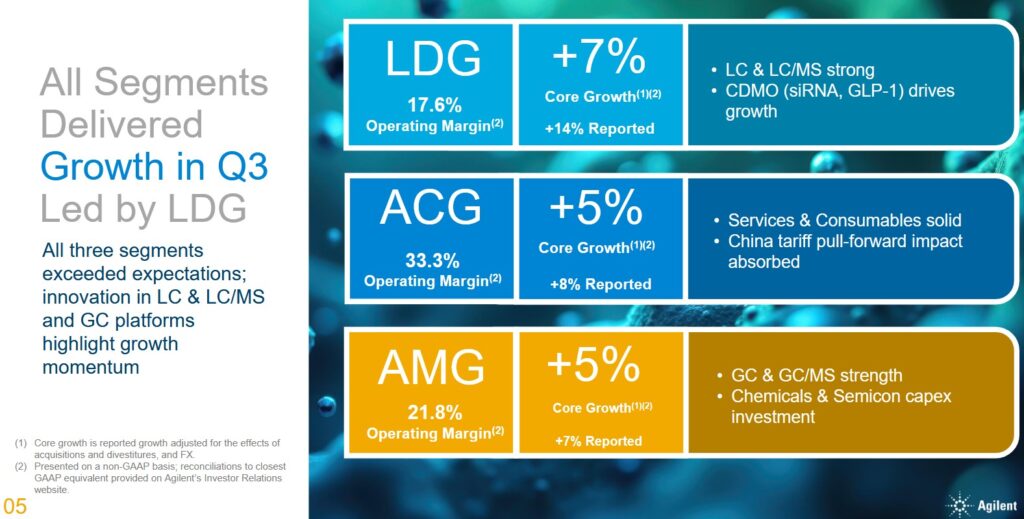
A has the following 3 reportable business segments:
- life sciences and applied markets (LDG);
- applied markets (AMG); and
- Agilent CrossLab (ACG).
A comprehensive overview of the business and each segment plus the risk factors is found in Item 1 within the FY2024 Form 10-K, (see SEC Filings). The company’s website also includes a wealth of information.
Financials
Q3 and YTD2025 Results
Material related to the Q3 and YTD2025 earnings release is accessible here.
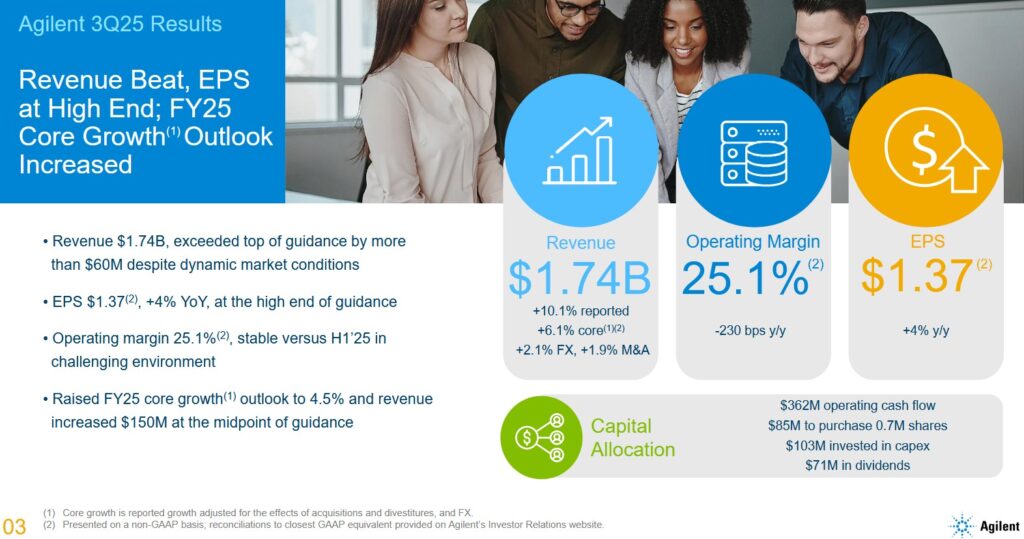
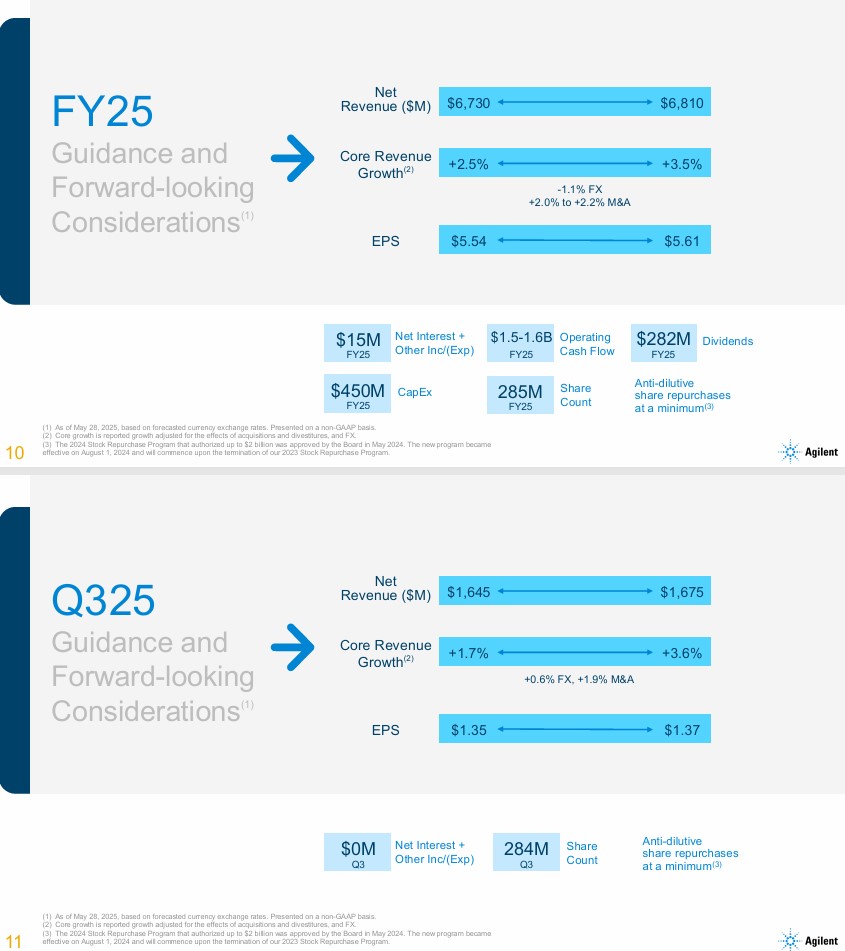
A reported 6.1% core revenue growth, exceeding management’s previous guidance of 1.7% – 3.6%. Adjusted EPS growth of 4% to $1.37 was the high end of prior guidance range of $1.35 – $1.37.
Operating Cash Flow (OCF), Free Cash Flow (FCF), and CAPEX
In recent posts I explain my rationale for deducting share-based compensation (SBC) from a company’s OCF to determine FCF. The following reflects A’s FCF using the conventional and modified methods.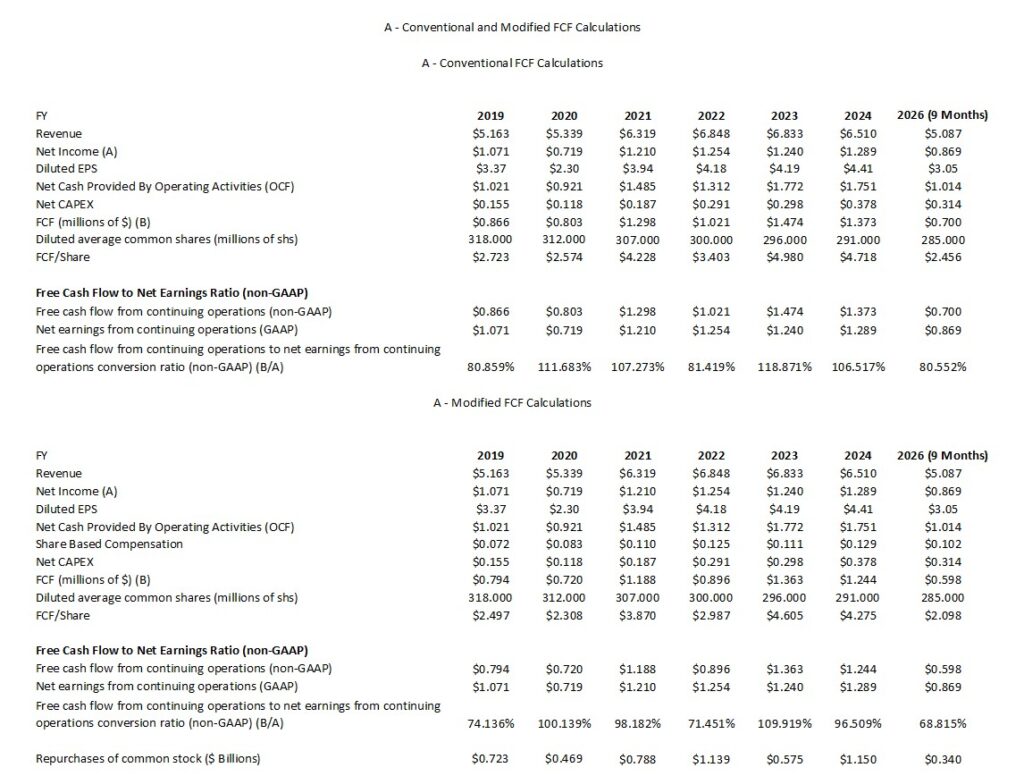
Management’s FY2025 outlook continues to include ~$1.5B – ~$1.6B of OCF and CAPEX of ~$0.45B. This would suggest A’s FCF calculated under the conventional method might be ~$1.05B – ~$1.15B.
If SBC is 33.3% of FY2025’s YTD $0.102B, FY2025 SBC could be ~$0.136B thus lowering FY2025 FCF to ~$0.914B – ~$1.014B.
In my May 30, 2025 post I wrote:
In the first half of FY2025, A has:
- generated ~$0.652B in net cash provided by operating activities; and
- disbursed ~$0.211B in payments to acquire property, plant and equipment
resulting in ~$0.441B of FCF. If we deduct ~$0.07 in share-based compensation (SBC), A’s modified FCF is ~$0.371B.
Management’s FY2025 outlook includes ~$1.5B – ~$1.6B of OCF and CAPEX of ~$0.45B. This would suggest A’s FCF calculated under the conventional method might be ~$1.05B – ~$1.15B.
If SBC is similar in the second half of FY2025 as in the first half, FY2025 SBC could be ~$0.14B thus lowering FY2025 FCF to ~$0.91B – ~$1.01B.
Capital Allocation
A’s capital allocation priority is to reinvest in the business. Share repurchases and dividend distributions are also a component of A’s capital allocation.
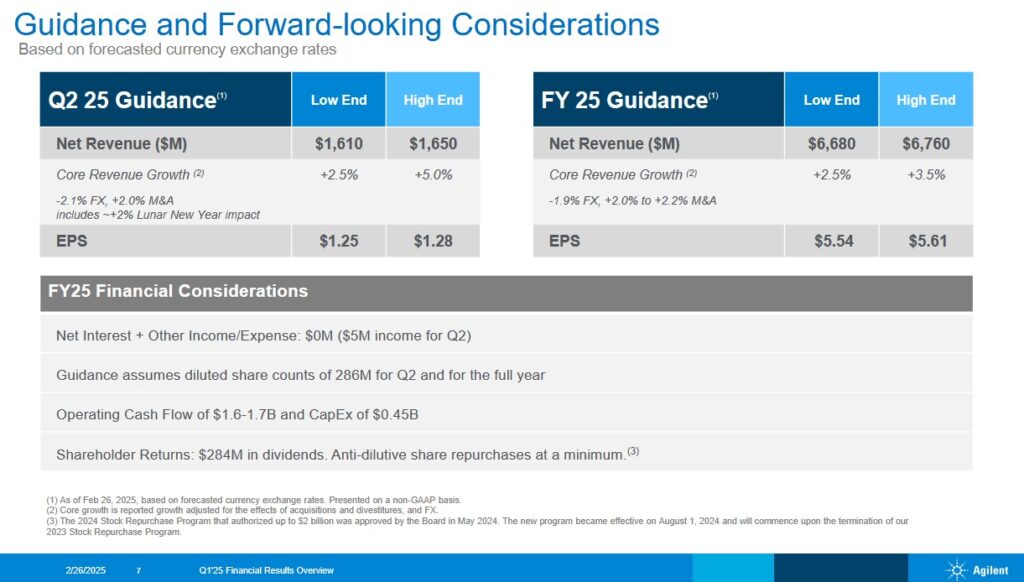
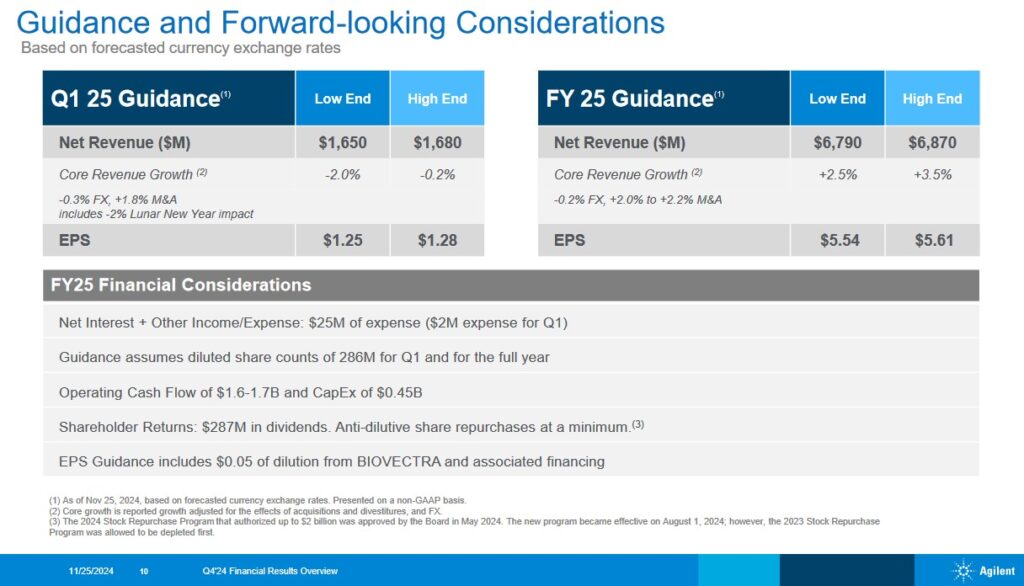
Q4 and FY2025 Guidance
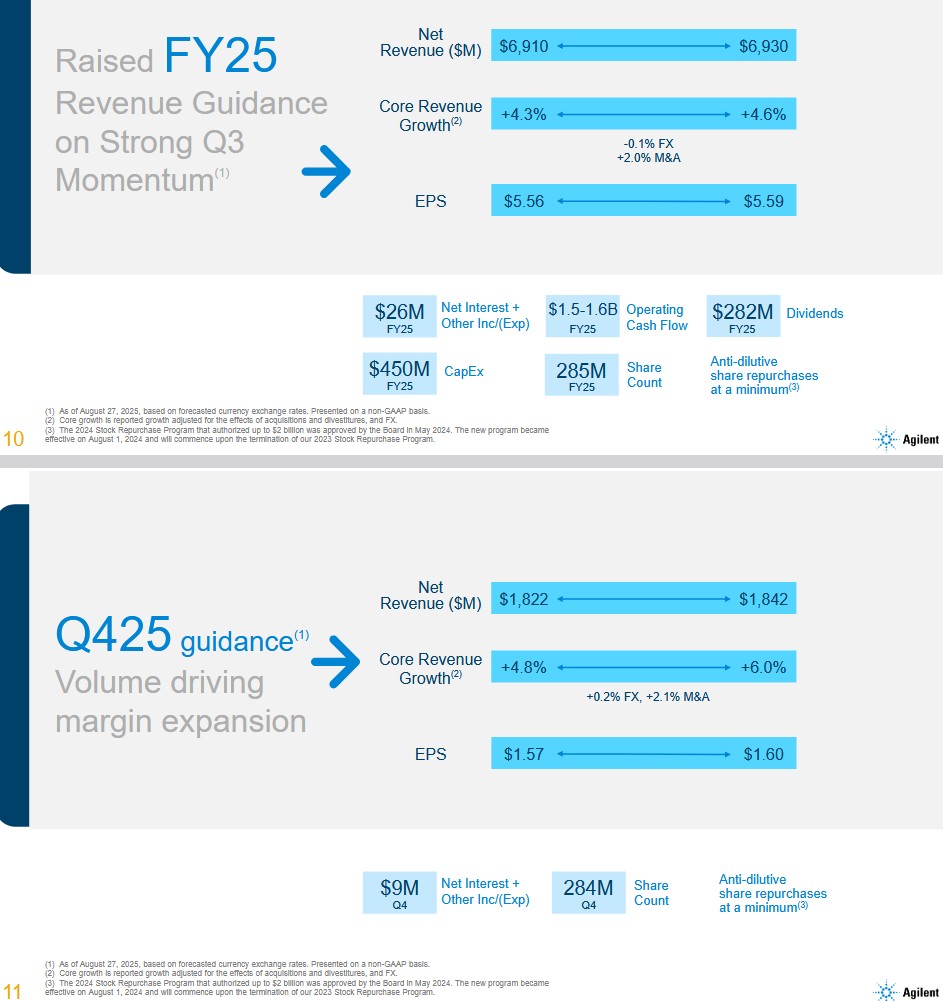
The following reflects A’s Q4 and FY2025 guidance.
Despite an increase in FY2025 revenue guidance, A has only narrowed its FY2025 adjusted diluted EPS guidance range.
Prior guidance is provided for comparison.
Risk Assessment
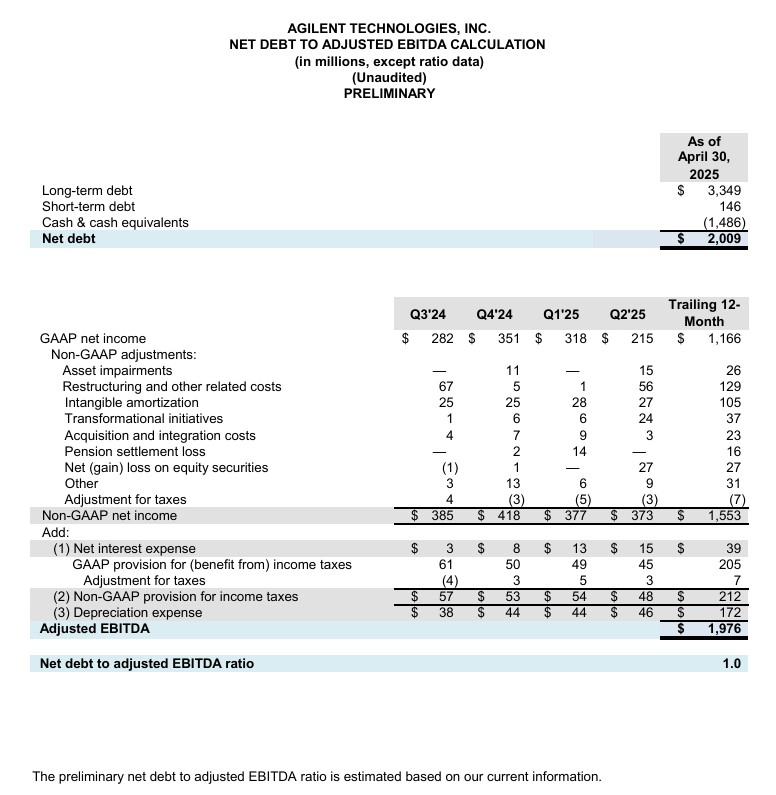
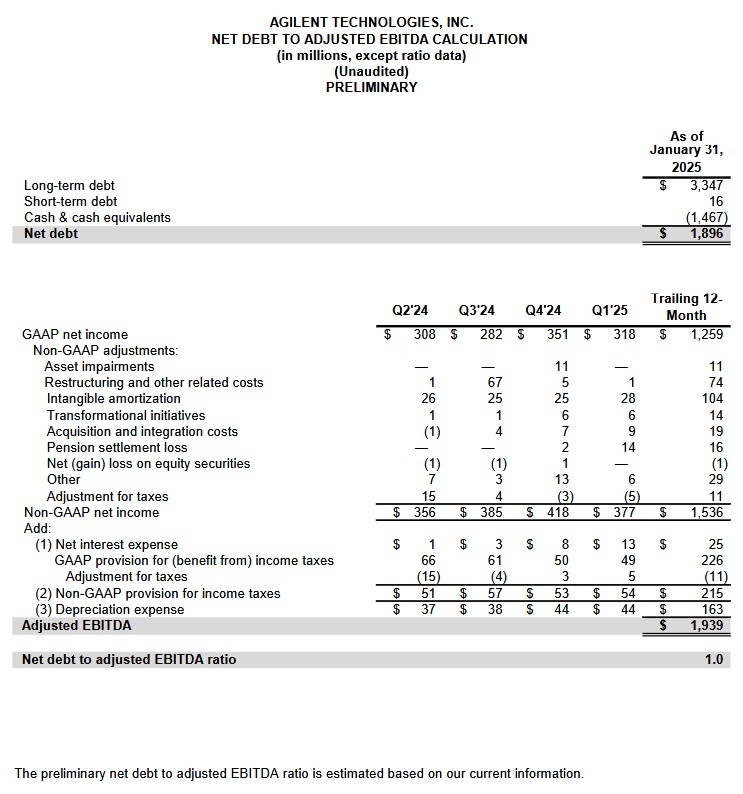
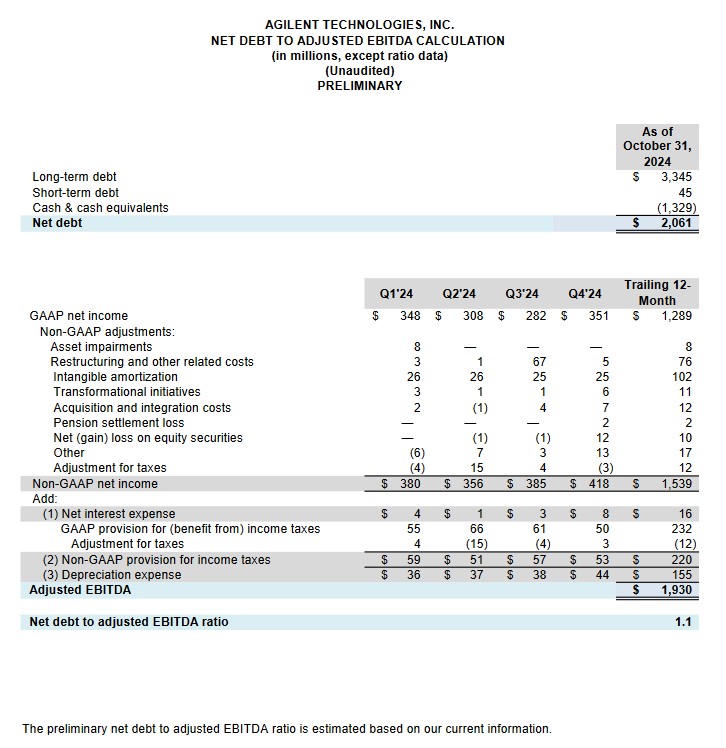
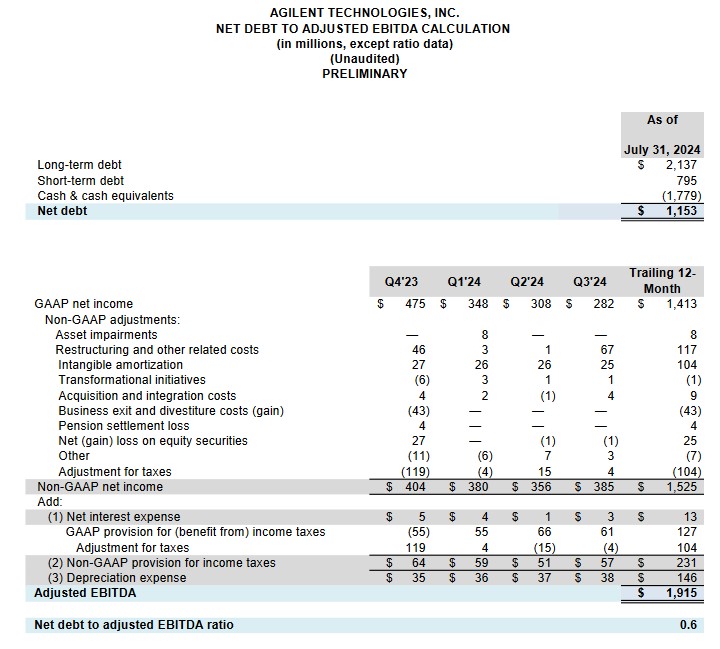
A’s net debt to adjusted EBITDA ratio is 0.9 at the end of Q3 2025.
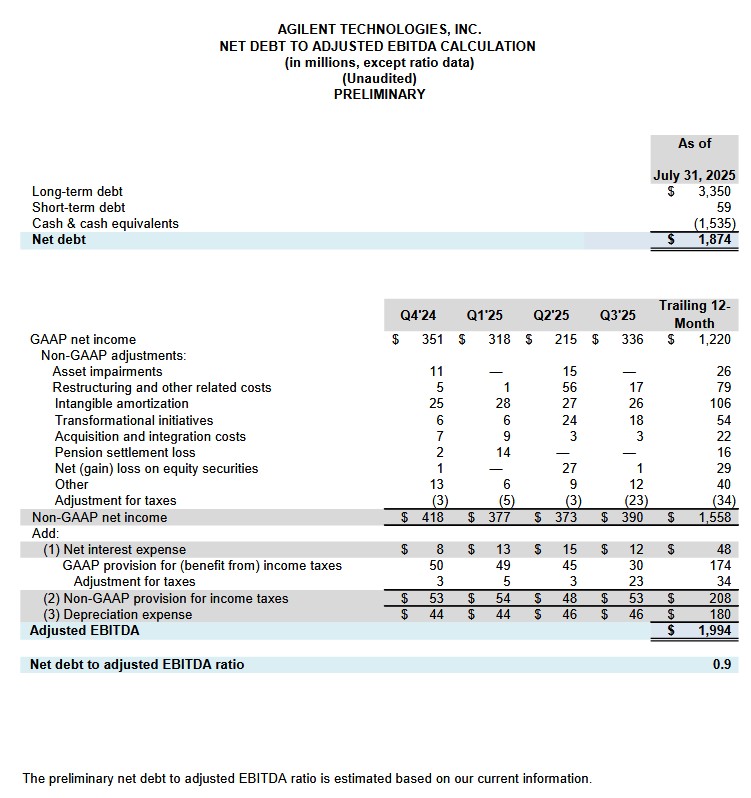
The following net debt to adjusted EBITDA calculations are provided for comparison.
A completed a couple of acquisitions which I touched upon in prior posts (Sigsense Technologies and BIOVECTRA). In FY2024, it disbursed ~$0.862B to acquire businesses and intangible assets, net of cash acquired. These acquired businesses, however, contributed little to A’s earnings.
A’s credit ratings remain unchanged from the time of my prior posts. A’s website currently reflects the following credit ratings.
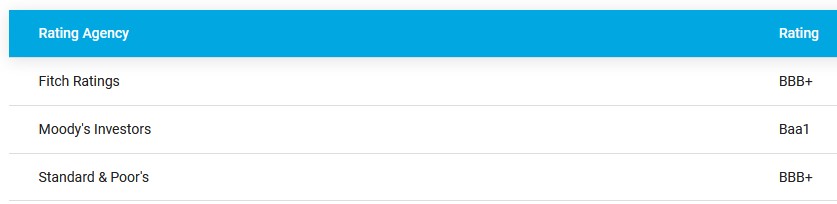
- Moody’s completed its most recent review on May 3, 2023 at which time A’s rating was upgraded from Baa2 to Baa1. The outlook is stable.
- S&P Global completed its most recent review on April 14, 2025 and affirmed A’s BBB+ rating with a Positive outlook.
- Fitch completed its most recent review on October 31, 2024 and affirmed A’s BBB+ rating with a Stable outlook.
All three rating agencies define A as having an adequate capacity to meet its financial commitments. However, adverse economic conditions or changing circumstances are more likely to lead to a weakened capacity of A to meet its financial commitments.
Dividend and Dividend Yield
A’s dividend history is accessible here.
The dividend yield is typically below 1%. Investors should expect the bulk of A’s future total investment return to continue to be predominantly in the form of capital appreciation.
The weighted average shares outstanding (in millions of shares) in FY2013 was ~345. In FY2024, Q4 2024, Q1, Q2, and Q3 2025, it was ~291, ~287, ~287, ~285, and ~285.
Repurchases in FY2018 – FY2024 (in $B) were 0.422, 0.723, 0.469, 0.788, 1.139, 0.575, and 1.15. Unfortunately, A’s shares were generally overvalued with the exception of the last couple of years.
The 2024 Stock Repurchase Program authorizes the repurchase of up to $2B. This was approved by the Board in May 2024 and became effective on August 1, 2024.
In Q3 2025, A repurchased 85 million shares in the first 9 months of the current fiscal year, A has repurchased ~$0.340B versus ~$0.815B in the corresponding period in the prior fiscal year. This was partially offset by $0.102B and $0.103B SBC during the same periods.
Management’s FY2025 guidance includes anti-dilutive share repurchases at a minimum and ~285 million in diluted outstanding shares although outstanding shares in Q4 2025 are expected to be ~284 million.
Valuation
A’s depreciation and amortization in FY2022 – FY2024 and the first half of FY2025 are ~$0.317B, ~$0.271B, ~$0.257B, and ~$0.145B. CAPEX during the same periods are ~$0.291B, ~$0.298B, ~$0.378B, and ~$0.211B. Looking at these results, we see that the ongoing CAPEX is not that significantly different from the combination of depreciation and amortization that is deducted on the Income Statement to determine Net Earnings.
A’s FY2025 adjusted diluted EPS outlook is $5.56 – $5.59 versus the previous $5.54 – $5.61. As I compose this post, shares trade at ~$124.40 giving us a forward adjusted diluted PE of ~22.3 – ~22.4.
A’s forward-adjusted diluted PE levels using this share price and the current broker estimates are:
- FY2025 – 18 brokers – ~22.3 using a mean of $5.57 and low/high of $5.55 – $5.59.
- FY2026 – 18 brokers – ~20.7 using a mean of $6.02 and low/high of $5.91 – $6.10.
- FY2027 – 13 brokers – ~18.7 using a mean of $6.66 and low/high of $6.48 – $6.87.
A’s FY2025 FCF using the conventional method remains the same as in my prior post. I anticipate ~$1.05B – ~$1.15B of FCF and ~285 million diluted outstanding shares. Using these estimates, A could generate ~$3.68 – ~$4.04 of FCF/share. With shares currently trading at ~$124.40, the forward P/FCF is ~30.8 – ~33.8.
Under the modified method of calculation FCF, my estimation is that A will generate ~$0.914B – ~$1.014B. Divide this by ~285 million diluted outstanding shares and we arrive at a FCF/share range of ~$3.21 – ~$3.56. With shares currently trading at ~$124.40, the forward P/FCF is ~35 – ~38.8.
In my May 30, 2025 post, I wrote:
It generated $1.31 in each of Q1 and Q2 and the Q3 outlook is $1.35 – $1.37 for a total of ~$3.98. This means it will need to generate ~$1.56 – ~$1.63 in Q4 to achieve its FY2025 target.
Using the current ~$113.30 share price, the forward adjusted diluted PE is ~20.2 – ~20.5.
A’s forward-adjusted diluted PE levels using this share price and the current broker estimates are:
- FY2025 – 20 brokers – ~20.3 using a mean of $5.57 and low/high of $5.47 – $5.61.
- FY2026 – 20 brokers – ~18.7 using a mean of $6.07 and low/high of $5.80 – $6.22.
- FY2027 – 14 brokers – ~16.9 using a mean of $6.70 and low/high of $6.49 – $6.86.
Earlier in this post, I estimated that A’s FY2025 FCF calculated under the conventional method might be ~$1.05B – ~$1.15B. The outlook is for ~285 million diluted outstanding shares meaning, A could generate ~$3.68 – ~$4.04 of FCF/share. With shares currently trading at ~$113.30, the forward P/FCF is ~28 – ~30.8.
Under the modified method of calculation FCF, I estimate A will generate ~$0.91B – ~$1.01B. Divide this by ~285 million diluted outstanding shares and we arrive at a FCF/share range of ~$3.19 – ~$3.54. With shares currently trading at ~$113.30, the forward P/FCF is ~32 – ~35.5.
Final Thoughts
A has experienced its challenges post-pandemic. While its pharmaceutical end market has grown ~9% on higher capital spending and the chemical and advanced materials end market have achieved ~10% core sales growth, the higher demand for instruments is being driven primarily from the sale of relatively low margin products (compare the Q3 2024 and Q3 2025 gross and operating margins).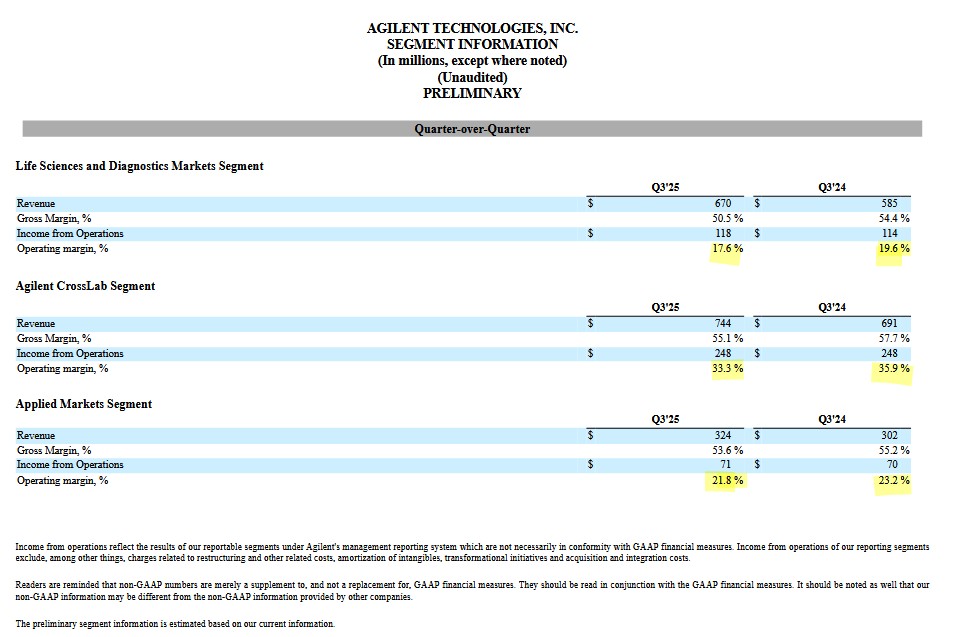
On the Q3 earnings call, management stated that the company’s profits have been constrained as it absorbs the impact of new tariffs and higher variable pay. It has, however, reorganized supply chains, shifted production across its global footprint and implemented targeted pricing actions. Management is now confident that it can fully mitigate the impact of tariffs (at current rates) in FY2026.
My exposure now consists of 602 shares in a ‘Core’ account the FFJ Portfolio at an average cost of ~$121.76; A was not a top 30 holding when I completed my 2025 Mid-Year Portfolio Review.
I continue to be of the opinion that ~$140 is A’s fair value. Although shares appear to be undervalued, I am satisfied with my current exposure. There are other companies in which I want to acquire additional shares and I want to have sufficient liquidity on hand in the event their valuations retrace to enticing levels.
I wish you much success on your journey to financial freedom!
Note: Please send any feedback, corrections, or questions to finfreejourney@gmail.com.
Disclosure: I am long A.
Disclaimer: I do not know your circumstances and do not provide individualized advice or recommendations. I encourage you to make investment decisions by conducting your research and due diligence. Consult your financial advisor about your specific situation.
I wrote this article myself and it expresses my own opinions. I do not receive compensation for it and have no business relationship with any company mentioned in this article.