![]()
I last reviewed RTX Corporation (RTX) in this January 27, 2026 post following the release of its Q4 and FY2025 results. With the release of Q1 2026 results on April 21, I revisit this existing holding.
Business Overview
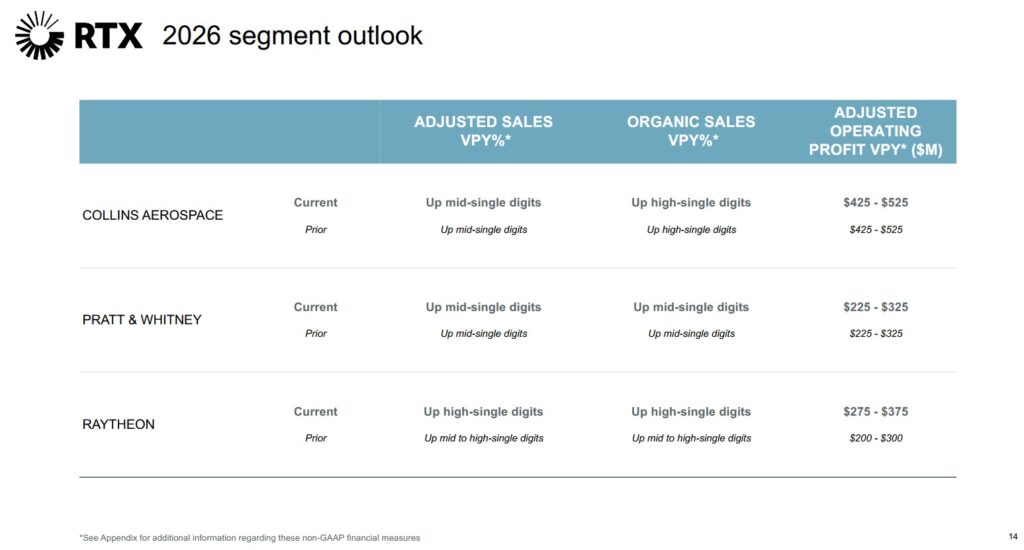
RTX has 3 business segments (Collins Aerospace, Pratt & Whitney, and Raytheon). Investors unfamiliar with RTX should review the company’s website and Part 1 Item 1 within the 2025 Form 10-K.
Financials
Q1 2026 Results
I dispense with a review of Q1 2026 results and recommend reviewing the Form 8-K and Earnings Presentation and earnings call transcript.
Backlogs and Bookings
RTX’s total backlog was ~$271B, ~$268B, and ~$218B as of March 31, 2026, December 31, 2025, and December 31, 2024 respectively.
Total backlog includes commercial backlog of ~$162B, ~$161B, and ~$125B as of March 31, 2026, December 31, 2025, and December 31, 2024. The defense backlog was ~$109B, ~$107B, and ~$93B as of March 31, 2026, December 31, 2025, and December 31, 2024, respectively.
Bookings are an important measure of RTX’s future performance for its defense businesses. Its defense operations consist primarily of the Raytheon segment and operations in the defense businesses within the Collins and Pratt & Whitney segments.
Defense bookings were ~$61B in both FY2025 and FY2024 and ~$51B in FY2023. Defense bookings were ~$14B and ~$9B for Q1 2026 and 2025, respectively.
Bookings are impacted by the timing and amounts of awards in a given period, which are subject to numerous factors, including:
- the desired capability by the customer and urgency of customer needs;
- customer budgets and other fiscal constraints;
- political and economic and other environmental factors;
- the timing of customer negotiations; and
- the timing of customer and governmental approvals and notifications.
Due to these factors, quarterly bookings tend to fluctuate from period to period, particularly on a segment basis.
Operating Cash Flow (OCF), CAPEX, and Free Cash Flow (FCF)
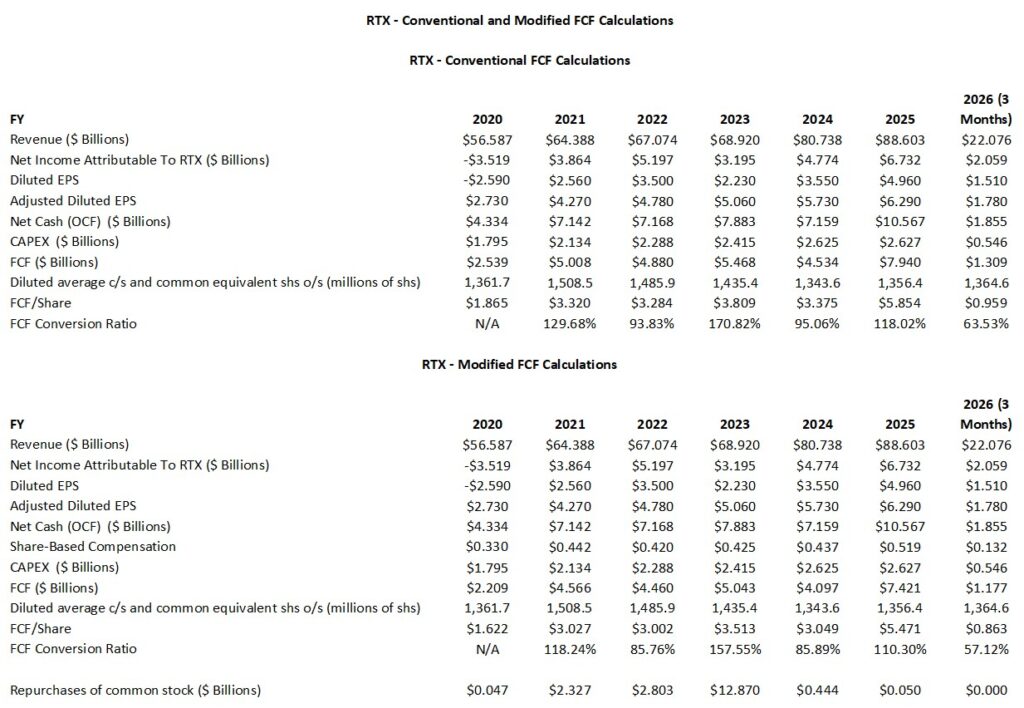
FCF is a non-GAAP measure, and therefore, its method of calculation is open to debate. Most companies merely subtract capital expenditures (CAPEX) from Net Cash Provided by Operating Activities found in the Consolidated Statement of Cash Flows.
The following reflects RTX’s annual FCF for the FY2020 – FY2025 and the first quarter of FY2026. The ‘conventional’ calculations do not deduct share-based compensation (SBC) while the ‘modified’ calculations deduct SBC.
NOTE: The FCF conversion ratio for 2026 reflects data just for 3 months and is, therefore, misleading.
Return On Invested Capital (ROIC)
High quality companies often generate a high ROIC. If a company generates a high ROIC, it needs to invest less to achieve a certain growth rate thus reducing the need for external capital.
When a company consistently generates a high ROIC over the long term and it is growing its revenue, it can reinvest a portion of its profits under favorable conditions thereby leading to a compounding effect. I would much rather invest in a growing company that can reinvest to create greater shareholder value than to invest in a company that has limited growth opportunities and thus chooses to distribute a growing dividend.
RTX’s ROIC improved from just under 4% in FY2020 to just over 8% in FY2025. Its WACC, however, was just over 7% in FY2020 and just under 9% in FY2025. During this 6 year time frame, RTX’s WACC has exceeded its ROIC by ~3.5% in FY2020 to ~0.5% in FY2025. This negative variance implies that RTX has not been an efficient capital allocator in recent years.
The Pratt & Whitney powder metal issue, which necessitated billions in charges and grounded hundreds of aircraft, was a significant factor in this sub-standard performance as it severely impacted net operating profit after tax (NOPAT).
The gradual reduction in the negative variance, however, is attributed to:
- Record-high demand for engine maintenance and spare parts at Collins Aerospace and Pratt & Whitney.
- A record backlog of $271B (as of Q1 2026), driven by increased global demand for land and air defense systems like the Patriot missile and GEM-T.
- Realization of merger-related cost savings and a lower effective tax rate (14.4% in Q1 2026).
RTX’s (ROIC) is slowly recovering from the lows of the 2020 merger and pandemic period. After several years in which the WACC exceeded ROIC, RTX now appears to be on the path to ‘value creation’ territory where its returns exceed its cost of funding.
The company is currently in a heavy investment phase and management is optimistic the capital currently being deployed will drive ROIC well above its WACC by 2027–2028 as production rates for the GTF engine and missile systems reach full capacity.
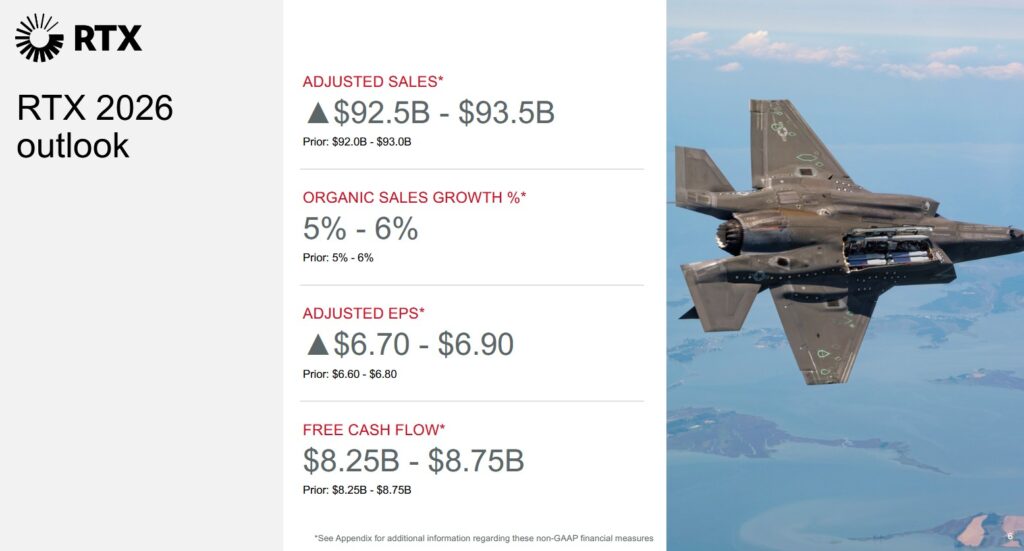
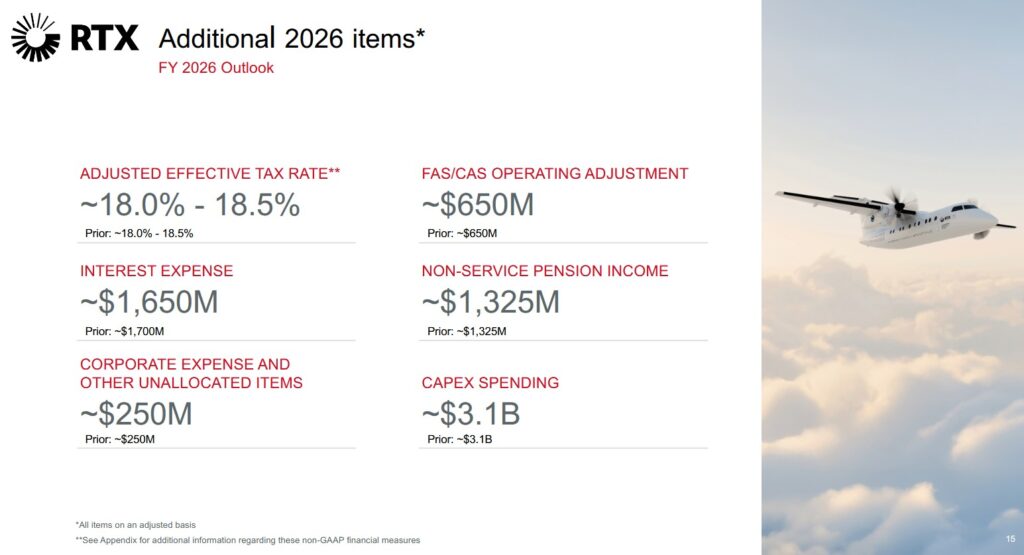
FY2026 Outlook
The following reflect RTX’s current and prior FY2026 outlook.
Risk Assessment
The following is a schedule of RTX’s long-term debt at FYE2024 and FYE2025 extracted from the FY2025 Form 10-K. The weighted-average interest rate related to total debt was 4.5% at December 31, 2025 and 2024. At FYE2025, the average maturity of RTX’s LTD was ~12 years.
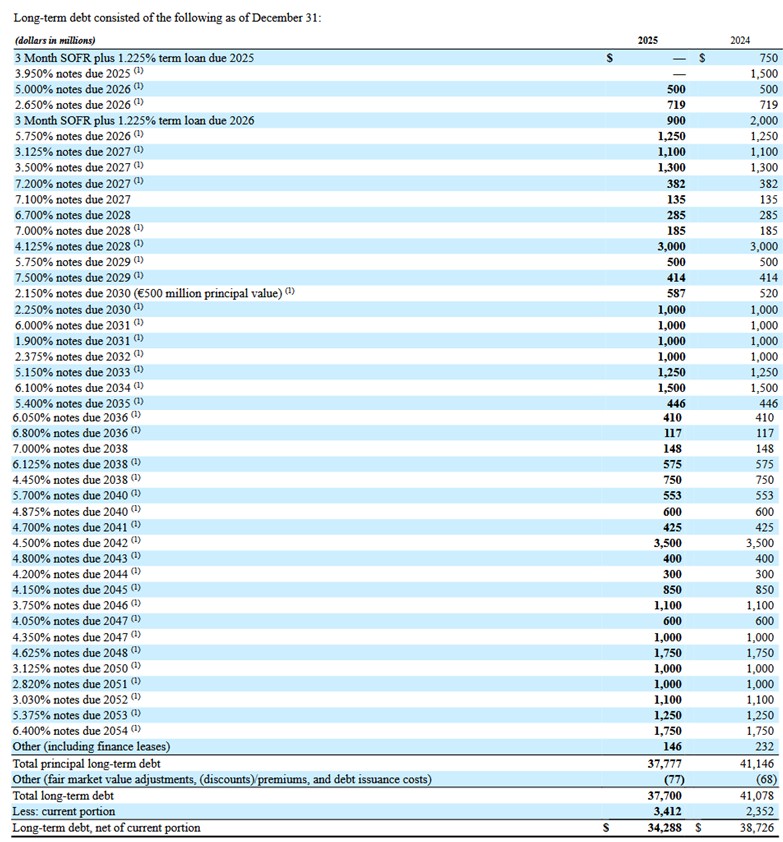
RTX’s total debt at the end of Q1 2026 is $37.187B with $4.213B being the current portion (CPLTD) and $32.974B being the long-term portion. According to the Q1 2026 Condensed Consolidated Statement of Cash Flows, RTX repaid $0.5B of the CPLTD.
I expect RTX will be able to easily meet its obligations.
- Moody’s assigns a Baa1 rating to RTX’s senior unsecured domestic currency debt with a stable outlook. It was last reviewed on February 18, 2026.
- S&P Global assigns a BBB+ to RTX Corp.’s senior unsecured notes with a stable outlook. This rating is equivalent to that assigned by Moody’s. It was last reviewed on September 17, 2025.
Both ratings are the top tier of the lower medium-grade category. They define RTX as having an ADEQUATE capacity to meet its financial commitments. However, adverse economic conditions or changing circumstances are more likely to lead to a weakened capacity to meet its financial commitments.
Both ratings are investment grade and are acceptable for my purposes.
Dividend and Dividend Yield
I am interested in an investment’s total potential shareholder return. Dividend metrics, therefore, are of little relevance in my investment decision making process. Nevertheless, some investors fixate on dividend metrics, and therefore, are interested in RTX’s dividend history.
In early May we can expect RTX to declare a dividend for distribution in June. I anticipate the quarterly dividend will be increased from $0.68 to ~$0.73.
RTX’s focus has been on aggressively deleveraging following the Raytheon and United Technologies merger in April 2020. Following this merger, RTX’s debt profile peaked. The ability to rapidly deleverage was complicated by the $10B accelerated share repurchase (ASR) in FY2023 and the debt taken on to manage the Pratt & Whitney GTF engine powder metal issue in late 2023.
Looking at the schedule within the Operating Cash Flow (OCF), CAPEX, and Free Cash Flow (FCF) section of this post, we see that share repurchases were negligible in FY2024, FY2025, and Q1 2026.
In FY2025, SBC was $0.519B and share repurchases were only $0.050B as RTX continued to prioritize a return to pre-merger debt levels. In Q1 2026, SBC was $0.132B and share repurchases were $0.
On October 21, 2023, RTX’s Board authorized a share repurchase program for up to $11B of common stock, replacing the previous program announced on December 12, 2022. At March 31, 2026, management had remaining authority to repurchase ~$0.6B of common stock under the October 21, 2023 share repurchase program.
Now that RTX’s period of aggressive deleveraging is maturing, I anticipate RTX’s Board will increase the share repurchase authorization thus permitting the company to return to a more balanced capital allocation phase.
Valuation
As I finalize this post mid-day April 22, 2026, RTX shares trade at ~$180.60 versus ~$213 at the beginning of March. Using management’s FY2026 adjusted diluted EPS outlook of $6.70 – $6.90 we get a forward adjusted diluted PE of ~26.2 – ~27.
RTX’s valuation using the current broker forward-adjusted diluted earnings estimates is:
- FY2026 – 23 brokers – mean of $6.84 and low/high of $6.55 – $7.04. Using the current mean, the forward adjusted diluted PE is ~26.4.
- FY2027 – 23 brokers – mean of $7.54 and low/high of $7.03 – $7.90. Using the current mean, the forward adjusted diluted PE is ~24.
- FY2028 – 16 brokers – mean of $8.28 and low/high of $7.13 – $8.91. Using the current mean, the forward adjusted diluted PE is ~21.8.
NOTE: Revisions to these estimates are likely over the coming days given that RTX just released its Q1 results and updated FY2026 outlook on April 21. I also recommend placing very little reliance on any earnings estimates beyond the current fiscal year. The macro environment is fraught with so much uncertainty that it is virtually impossible to accurately estimate a company’s earnings beyond the current fiscal year. Furthermore, the variance in estimates reflects how analyst opinions significantly vary on RTX’s future performance.
I think it is wise to value RTX using $6.70 (the low end of management’s outlook). On this basis, RTX’s adjusted diluted PE is ~27.
Management’s FY2026 FCF outlook remains unchanged at ~$8.25B – ~$8.75B. This outlook, however, does not deduct SBC to arrive at its FCF outlook. Looking at the annual SBC in recent years, I estimate that FY2026 SBC could be ~$0.085B greater than in FY2025. If this assumption is reasonably accurate, SBC in FY2026 could be ~$0.604B. If we deduct this amount from RTX’s FY2026 FCF outlook, the revised FCF range becomes ~$7.646B – ~$8.146B.
Share repurchases have not been a priority in recent years with deleveraging being the focus. Now that the Balance Sheet is in better shape than a couple of years ago, I anticipate RTX will ramp up share repurchases. As noted earlier, however, the remaining share repurchase authority is only ~$0.6B. Until such time as RTX’s Board approves an increase in the share repurchase authorization, I think it is prudent to estimate the diluted weighted average shares outstanding in FY2026 could increase to ~1.375 million.
If we divide my estimated FY2026 modified FCF range (~$7.646B – ~$8.146B) by ~1.375 million shares, RTX’s forward FCF per share should be ~$5.56 – ~$5.92. With shares trading @ ~$180.60, the forward P/FCF is ~30.5 – ~32.5.
For the sake of comparison, the following reflects my assessment of RTX’s valuation at the time of my prior post.
Shares now trade at ~$200 as I compose this post on January 27. Management’s FY2026 Adjusted diluted EPS outlook is $6.60 – $6.80. This gives us a forward adjusted diluted PE of ~29.4 – ~30.3.
RTX’s valuation using the current broker forward-adjusted diluted earnings estimates is:
- FY2026 – 23 brokers – mean of $6.71 and low/high of $6.50 – $6.97. Using the current mean, the forward adjusted diluted PE is ~29.8.
- FY2027 – 18 brokers – mean of $7.45 and low/high of $6.83 – $8.08. Using the current mean, the forward adjusted diluted PE is ~26.8.
- FY2028 – 8 brokers – mean of $8.00 and low/high of $7.22 – $8.36. Using the current mean, the forward adjusted diluted PE is ~25.
NOTE: Upwards revisions to these estimates are likely over the coming days given that RTX has just released its Q4 and FY2025 results and FY2026 outlook.
Management’s FY2026 FCF outlook is ~$8.25B – ~$8.75B. This outlook, however, does not deduct SBC to arrive at its FCF outlook. Looking at the annual SBC in recent years, I estimate that FY2026 SBC could be ~$0.085B greater than in FY2025. If this assumption is reasonably accurate, SBC in FY2026 could be ~$0.604B. If we deduct this amount from RTX’s FY2026 FCF outlook, the revised FCF range becomes ~$7.646B – ~$8.146B.
Share repurchases are currently not a priority so the diluted weighted average shares outstanding in FY2026 could increase from 1,361.7 million in Q4 2025 to ~1.375 million.
If we divide my estimated FY2026 modified FCF range by ~1.375 million shares, RTX’s forward FCF per share should be ~$5.62 – ~$5.92. With shares trading @ ~$200, the forward P/FCF is ~33.8 – ~35.6.
Final Thoughts
My RTX exposure currently consists of 959 shares in 2 ‘Core’ accounts within the FFJ Portfolio. My exposure at the time of my January 27, 2026 post was 957 shares. The slight increase is solely the result of the automatic reinvestment of dividend income.
When I completed my 2025 Year-End Investment Holdings Review, RTX was my 23rd largest holding. This review was prepared using the December 31, 2025 ~$183.40 closing share price.
RTX’s WACC exceeds ROIC in recent years. The recent year trend, however, suggests ROIC is on the cusp of exceeding WACC.
I consider ~$175 to be a fair value. Using $6.70 as my FY2026 adjusted diluted EPS estimate, the forward adjusted diluted PE is ~26.1.
Using my $5.56 – ~$5.92 FY2026 forward FCF per share estimate and a ~$175 share price, the forward P/FCF is ~29.6 – ~31.5.
With the pullback in RTX’s share price in recent weeks, shares are close to fair valuation. I am, however, satisfied with my current exposure and do not intend to immediately acquire additional shares.
I wish you much success on your journey to financial freedom!
Note: Please send any feedback, corrections, or questions to finfreejourney@gmail.com.
Disclosure: I am long RTX.
Disclaimer: I do not know your circumstances and am not providing individualized advice or recommendations. I encourage you not to make investment decisions without conducting your research and due diligence. You should also consult your financial advisor about your specific situation.
I wrote this article myself and it expresses my own opinions. I am not receiving compensation for it and have no business relationship with any company whose stock is mentioned in this article.