![]()
Following the release of Danaher’s (DHR) FY2025 results on January 28, 2026 and my February 1, 2026 post, DHR announced that it had entered into a definitive agreement to acquire Masimo Corporation (MASI) for $180/share in cash, or a total enterprise value of ~$9.9B including assumed indebtedness and net of acquired cash. This represents a transaction multiple of ~18x estimated 2027 EBITDA, or ~15x 2027 estimated EBITDA including the full benefit of expected annual synergies.
DHR’s management anticipates MASI will be accretive to adjusted diluted EPS by $0.15 – $0.20 in the first full year and ~$0.70 in the fifth full year following completion of the acquisition. Furthermore, the expectation is for MASI to deliver high-single digit core revenue growth over the long-term thus accelerating Danaher’s Diagnostics segment core revenue growth profile.
Under DHR’s ownership, the expectation is for MASI to generate EBITDA of more than $0.53B in 2027. DHR also expects to realize more than $0.125B of annual cost synergies and more than $0.05B of annual revenue synergies by the fifth full year following completion of the acquisition.
MASI is a leading specialty diagnostics provider of pulse oximetry and other patient monitoring solutions, primarily in acute care settings. Pulse oximetry is a non-invasive test that measures the oxygen saturation level of our blood. It is a quick way to determine how effectively oxygen is being sent to the parts of our body furthest from our heart, such as the arms and legs.
In FY2023 – FY2025, MASI generated revenue of ~$1.276B, ~$1.395B, and ~$1.528B.
The transaction is to close in the second half of 2026 and is subject to customary conditions. This includes receipt of applicable regulatory clearances and MASI shareholder approval. Funding is to come from cash on hand and proceeds from debt financing.
Given this recent acquisition announcement and the release of Q1 2026 results on April 21, I revisit this existing holding.
Business Overview
DHR is a global science and technology innovator committed to accelerating the power of science and technology to improve human health. It is comprised of more than 18 operating companies with leadership positions in the biotechnology, life sciences and diagnostics sectors, organized under three segments (Biotechnology, Life Sciences and Diagnostics). Its research and development, manufacturing, sales, distribution, service and administrative facilities are located in more than 50 countries.
It is one of the top three global leaders in the life sciences and diagnostics industries. Thermo Fisher Scientific and Roche are the other two.
It is a dominant player because it controls ‘high-moat’ niche markets through its subsidiaries and it does not have a single ‘one-to-one’ competitor because its portfolio is so diverse.
Links to the websites of the entities under the DHR umbrella are accessible here.
Part 1 Item 1 in the Form 10-K, accessible through the SEC Filings section of the company’s website, provides information to learn about the company.
Financials
Q1 2026 Results
On April 21, 2026, DHR released Q1 2026 results and provided updated FY2026 guidance. Refer to the material available in the Quarterly Earnings section of DHR’s website.
Conventional And Modified Free Cash Flow (FCF) Calculations (FY2019 – FY2025 and Q1 2026)
Strong free cash flow generation is one of the most important metrics at DHR. FY2025 marked the 34th consecutive year of FCF to net income conversion which exceeded 100%. If we deduct SBC to determine FCF, however, DHR just fell short of 100% in FY2022. Although the modified FCF in Q1 2026 is below 100%, there are still 3 more quarters to go in FY2026. I am not, therefore, concerned.
The following table reflects data extracted from the FY2019 – FY2025 and Q1 2026 reconciliation of GAAP and non-GAAP financial measures and supplemental forward-looking information documents that are accessible here. The modified FCF calculations deduct share based compensation (SBC) from total operating cash provided by continuing operations.
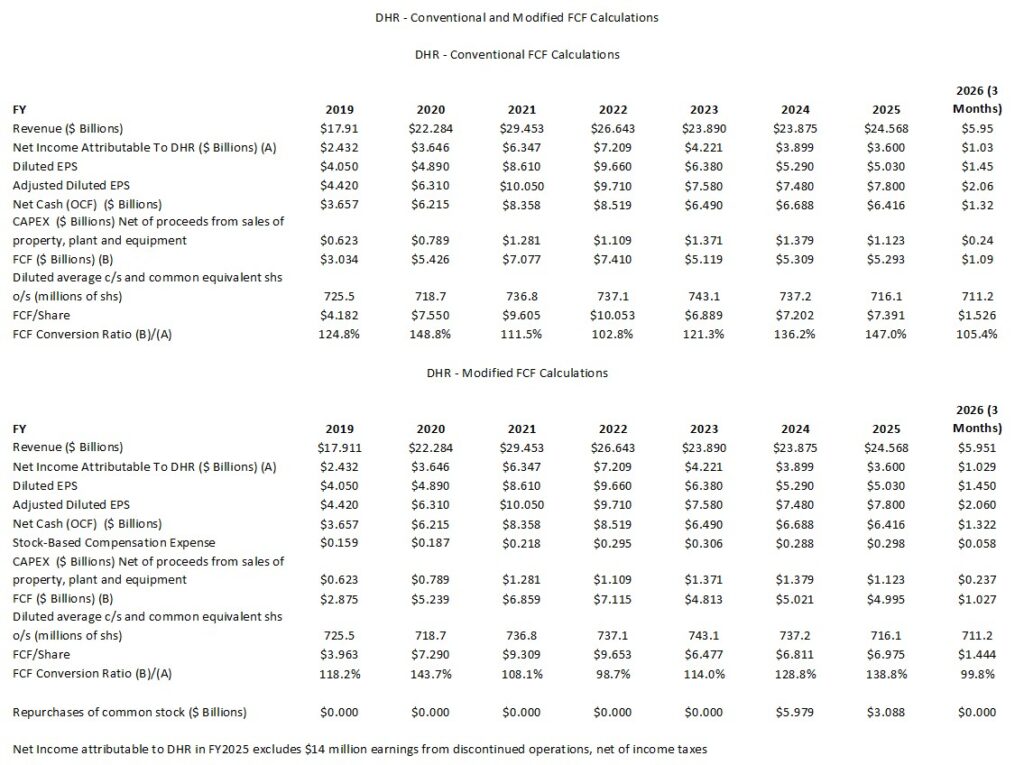
Since Free Cash Flow (FCF) is a non-GAAP metric, there is no standardization in its calculation. In several posts I express my thoughts on the method by which many companies calculate it. Most companies merely deduct net CAPEX from net cash flows from operating activities. I, however, think it is also necessary to deduct share based compensation (SBC).
Many companies employ SBC as part of their employee compensation plans. Because SBC involves no cash outlay, companies add back SBC to determine net cash flows from operating activities in the Condensed Consolidated Statement of Cash Flows.
Suppose, however, that DHR were to compensate employees 100% by way of SBC. Since there is no cash outlay, the full amount of its employee compensation would be added back in the Condensed Consolidated Statement of Cash Flows to determine net cash flows from operating activities.
If, on the other hand, DHR were to have no SBC and were to actually disburse funds to pay its employees, nothing would be added back in the Condensed Consolidated Statement of Cash Flows. The entire amount paid to employees would be expensed on the Income Statement.
We arrive at very different net cash flows from operating activities by merely changing the manner in which a company compensates its employees!
This makes no sense. Is SBC not a form of ‘financing’?
It might be more proper to reflect SBC within the Cash Flows From Financing Activities section of the Condensed Consolidated Statement of Cash Flows. This way, we would arrive at similar FCF results no matter how a company chooses to compensate its employees.
FY2026 Outlook
DHR’s FY2026 outlook calls for ~3% – ~6% core revenue growth and $8.35 – $8.55 in adjusted diluted EPS. In Q2 2026, management’s expectations are for low single-digit core revenue growth and an adjusted operating margin of ~28.5%.
The prior FY2026 outlook was for ~3% – ~6% core revenue growth and $8.35 – $8.50 in adjusted diluted EPS. In Q1 2026, management’s expectations were for low single-digit core revenue growth and an adjusted operating margin of ~28.5%.
ROIC and WACC
Return on Invested Capital (ROIC) provides an indication of a company’s efficiency. In essence, is a company actually creating value or ‘burning’ cash for the sake of growth?
A company with a higher ROIC is mathematically worth more because it requires less reinvestment to achieve that growth.
A good indication of how well a company is performing is to compare ROIC to the Weighted Average Cost of Capital (WACC).
The generally accepted high-level formula used by Wall Street is:
ROIC = NOPAT/Average Invested Capital
with the Net Operating Profit After Tax (NOPAT) formula being Operating Income (EBIT) x (1-tax rate)
This shows how much profit the core business makes while ignoring how much debt the company has.
The Average Invested Capital is the total money tied up in the business.
- The Operating Approach formula is
- The Financing Approach is
One shortcoming with ROIC is that it is a non-GAAP metric. This means the input data plugged into the ROIC formula is inconsistent.
DHR’s ROIC in FY2019 – FY2025 has typically in the mid to high single digits. Its WACC during this period, however, has risen from the mid 4% level in FY2019 – FY2020 to the high single digits in FY2021 – FY2025. In FY2023 – FY2025, DHR’s WACC has marginally exceeded its ROIC.
These results, on the surface, may lead to an investor seriously questioning whether DHR is a worthwhile investment.
The ROIC decline in recent years is attributed in part to the ‘post-pandemic normalization’ in bioprocessing demand (inventory destocking) and the spin-off of Veralto on September 30, 2023, which removed a high-margin environmental segment from DHR’s balance sheet. DHR has also undergone a significant portfolio transformation in 2019 – 2025 by shifting into a pure-play life sciences and diagnostics innovator. This transition included the massive acquisition of GE Biopharma (now Cytiva) in 2020.
When DHR makes a sizable acquisition, Goodwill and Intangibles instantly increase on DHR’s Balance Sheet (the ‘Invested Capital’ capital component of the ROIC formula) while the Net Operating Profit After Tax (NOPAT) numerator takes years to scale through the Danaher Business System (DBS).
Investor need to recognize that DHR’s major acquisitions are very rarely made at book value. The premium it pays is recorded as Goodwill and Intangibles (brands, patents, customer relationships). These assets stay on the balance sheet under ‘Invested Capital’. Because the price paid for acquisitions is often many times the target’s physical assets, the denominator in the ROIC formula becomes very large.
A large denominator means DHR must generate massive amounts of NOPAT just to keep a steady ROIC. This is why DHR’s mid to high single digits ROIC often looks lower than other companies that have fewer intangible assets.
Under GAAP, Intangible Assets (unlike Goodwill) must be amortized over time. This amortization is an accounting expense that reduces GAAP Operating Profit. While amortization reduces the ‘accounting’ ROIC, it is a non-cash expense. This explains why many investors often calculate ROIC by adding back amortization to NOPAT to see how the underlying business is actually performing.
Goodwill is not amortized, however, it is tested annually for impairment. Should DHR overpay for an acquisition and that company fails to meet growth targets, DHR must ‘write down’ Goodwill. A write-down actually reduces the denominator (Invested Capital), which can artificially inflate ROIC in future periods because the capital base appears smaller, even though the company actually lost value.
Anticipated Impact of Masimo (MASI) Acquisition On DHR’s ROIC and WACC
The MASI acquisition will very likely follow the classic DHR M&A playbook. DHR’s returns will be compressed in the short-term but should expand in the long-term through the Danaher Business System (DBS).
In the short term, the acquisition will likely exert downward pressure on DHR’s consolidated ROIC due to the significant ‘goodwill’ and premium paid (~18x estimated 2027 EBITDA).
In the first 3 years (Integration Phase), the expectation is for DHR’s ROIC to dip as the $9.9B capital outlay enters the denominator of the ROIC calculation before the full earnings potential is realized. MASI has faced recent profitability challenges which creates a low starting base for returns.
By the 5th full year of ownership, DHR’s management expects MASI to deliver high-single-digit (HSD) ROIC.
As stated at the outset of this post, DHR expects $125 million in annual cost synergies and $50 million in revenue synergies by Year 5. Applying the DBS to MASI’s business model in which over 80% is recurring revenue from sensors, the expectation is for MASI’s high-20% range operating margins to increase toward DHR’s segment standards of 30%+.
The acquisition is expected to marginally increase DHR’s WACC in the near term, though it remains supported by the company’s strong credit profile.
DHR will fund the acquisition using a combination of cash on hand and new debt financing. This will increase the company’s leverage (Debt/EBITDA), which may lead to a slight uptick in the cost of debt component of WACC. DHR’s strong quarterly free cash flow generating capabilities, however, should enable DHR to rapidly deleverage.
I anticipate the ‘spread’ between ROIC and WACC will be thin or negative in the first 24 months. As cost structures are optimized, however, there should be a significant positive spread by 2031.
Risk Assessment
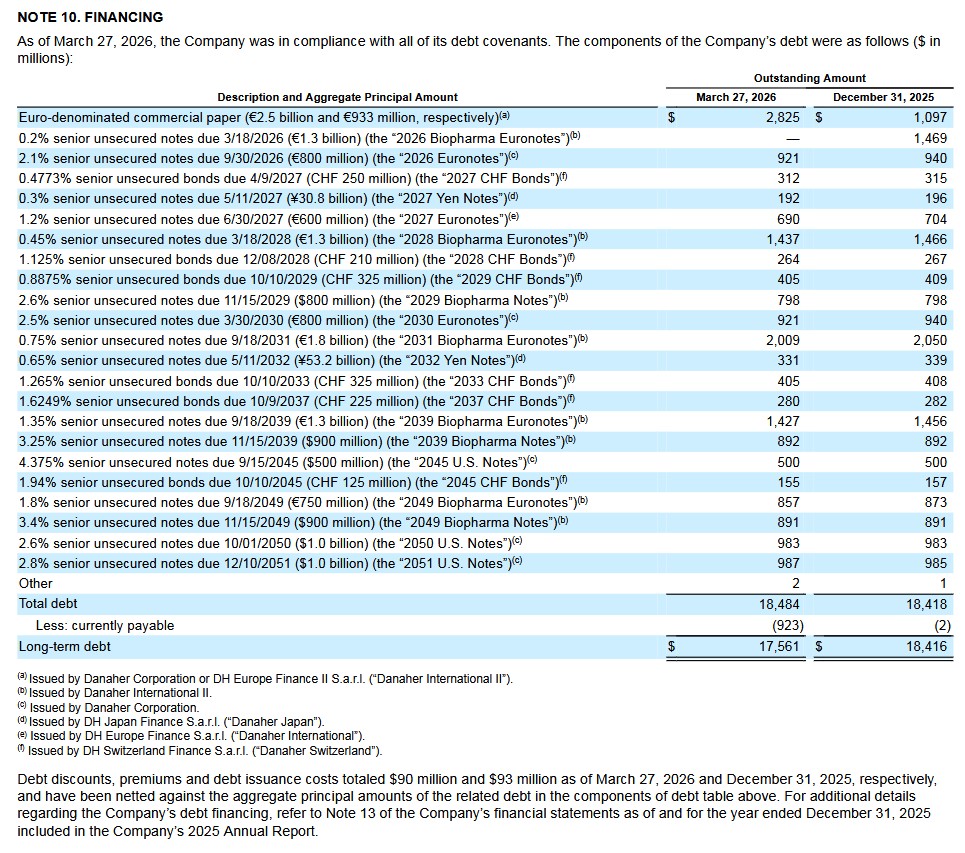
DHR has attractive credit arrangements with well staggered scheduled maturities.
The following is DHR’s schedule of long-term debt at the end of Q1 2026 and FYE2025.
In my February 1, 2026 post I wrote:
At FYE2025, DHR had ~$4.615B in cash and equivalents versus ~$1.528B at the end of Q3 2025 and ~$2.078B at FYE2024. While gross debt increased ~$1.58B relative to the end of Q3 2025, the Net Debt stayed nearly flat because the majority of the borrowed funds remained on the Balance Sheet as cash at FYE2025.
The increase in long term debt in Q4 was primarily driven by strategic capital allocation to strengthen the company’s liquidity and to prepare for an anticipated uptick in M&A activity in 2026. On the Q4 2025 earnings call, management mentions that the M&A environment had become ‘more constructive’. Given this, DHR took advantage of a constructive credit market in late 2025 to issue new long-term notes.
In addition, DHR repaid upcoming 2026 debt maturities (see debt maturing in 2026 in the above schedule), ensuring it maintains a long-dated, low-cost debt profile before any potential interest rate volatility in 2026.
With Net Debt to EBITDA ratio remaining below 2.0x, the increased debt provides the the liquidity for potential bolt-on acquisitions in the Bioprocessing and Life Sciences sectors.
On April 16, 2026 DHR entered into a new $5.0B 364-day revolving credit facility (set to expire on April 15, 2027) in preparation for the MASI acquisition. Under the terms of the revolving credit facility agreement, DHR may elect to convert any loans outstanding on the Scheduled Termination Date into term loans that are due and payable one year following the Scheduled Termination Date.
DHR’s credit ratings remain the same from my last review and there is no indication the rating agencies intend to amend the current ratings following the MASI acquisition announcement.
- Moody’s: Upgraded to A2 from A3 on November 17, 2025 and the outlook is stable.
- S&P Global: Upgraded to A- from BBB+ on June 11, 2022. June 23, 2025 is the last review date and the outlook is stable.
Moody’s rating is the middle tier of the upper-medium investment-grade tier. S&P’s rating is the bottom tier of the upper-medium investment-grade tier. They define DHR as having a STRONG capacity to meet its financial commitments. DHR, however, is somewhat more susceptible to the adverse effects of changes in circumstances and economic conditions than obligors in higher-rated categories.
These ratings satisfy my conservative investment profile.
Dividend and Dividend Yield
On April 24, 2026, DHR is to distribute a $0.40 quarterly dividend. While DHR’s dividend yield is negligible, investors would be wise not to fixate on dividend metrics. The focus should be on total potential investment return.
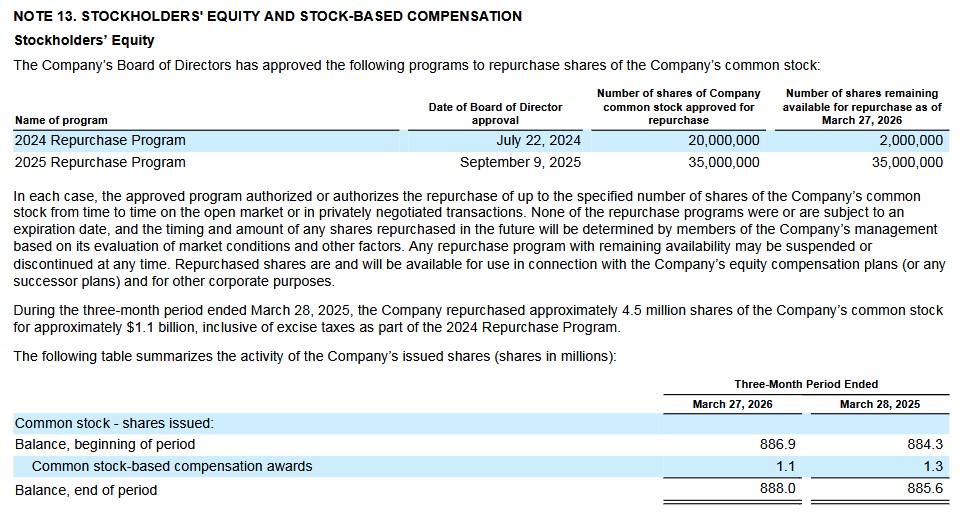
DHR repurchased no shares in Q1 2026. This is not surprising given the impending MASI acquisition.
The following, extracted from DHR’s Q1 2026 Form 10-Q, reflects the number of shares remaining available for repurchase under the company’s share repurchase programs.
Valuation
DHR’s adjusted diluted earnings forecast for FY2026 is $8.35 – $8.55. Using the April 21, 2026 $194.54 closing share price and management’s guidance, the forward adjusted diluted PE is ~22.75 – ~23.3.
In Q1 2026, DHR generated $1.45 of diluted EPS and $2.06 of adjusted diluted EPS. If DHR generates $8.40 of adjusted diluted EPS in FY2026, the forward adjusted diluted PE is ~23.2 ($194.54/$8.40).
Using the current share price and the currently available broker adjusted diluted EPS estimates, the forward adjusted diluted PE levels are:
- FY2026 – 25 brokers – mean of $8.43 and low/high of $8.36 – $8.51. Using the mean, the forward adjusted diluted PE is ~23.08.
- FY2027 – 26 brokers – mean of $9.11 and low/high of $8.83 – $9.40. Using the mean, the forward adjusted diluted PE is ~21.35.
- FY2028 – 17 brokers – mean of $10.05 and low/high of $9.62 – $10.75. Using the mean, the forward adjusted diluted PE is ~19.36.
In Q1 2026, DHR generated $1.45 of diluted EPS. If it can generate $5.80 in FY2026 ($1.45 x 4 quarters) and the FCF conversion ratio conservatively reaches 115% (calculated when we deduct share-based compensation), we should anticipate ~$6.67 ($5.80 x 115%) of FCF/share in FY2026. Divide $194.54 by ~$6.67 and the forward diluted P/FCF is ~29.2.
In my February 1, 2026 post I reflect:
In FY2025, DHR generated diluted EPS and adjusted diluted EPS from continuing operations of $5.03 and $7.80. The January 30, 2025 closing share price was $218.89 thus giving us a diluted PE and adjusted diluted PE of ~43.5 and ~28.1.
DHR’s FY2025 FCF/share was $7.391 and $6.975 (see table in the Conventional And Modified Free Cash Flow (FCF) Calculations (FY2019 – FY2025) section of this post). Using the current $218.89 share price, the P/FCF is ~30 and ~31.4.
DHR’s adjusted diluted earnings forecast for FY2026 is $8.35 – $8.50. Using the current $218.89 share price and management’s guidance, the forward adjusted diluted PE is ~25.75 – ~26.2.
Using the current share price and the currently available broker adjusted diluted EPS estimates, the forward adjusted diluted PE levels are:
- FY2026 – 25 brokers – mean of $8.43 and low/high of $8.35 – $8.75. Using the mean, the forward adjusted diluted PE is ~26.
- FY2027 – 24 brokers – mean of $9.16 and low/high of $9.00 – $9.85. Using the mean, the forward adjusted diluted PE is ~23.9.
- FY2028 – 16 brokers – mean of $10.11 and low/high of $9.77 – $11.15. Using the mean, the forward adjusted diluted PE is ~21.7.
Final Thoughts
DHR operates as a high-performance compounding machine as opposed to a traditional industrial conglomerate. Its investment thesis is built on operational excellence, a recurring revenue model, and disciplined capital allocation.
Approximately 80% of DHR’s revenue is recurring, coming from sensors, resins, filters, and diagnostic tests.
In Q1 2026, DHR reported a 30% surge in bioprocessing equipment orders which represents the first positive growth in nearly two years. This is a ‘leading indicator’ that suggests a multi-year investment cycle in biologic drug manufacturing is beginning.
DHR continues to have a wide moat related to intangible assets (ie. trademarks, brands, patents, copyrights) in its differentiated technology. There are also substantial customer switching costs which ‘locks in’ customers.
Management expects revenue growth to accelerate to the high single digits from 3% – 6% in FY2026 with adjusted diluted EPS growth in the low double digits over the long term.
In my prior DHR post I conclude that:
DHR has positioned itself to have ‘fire power’ to take advantage of a ‘more constructive’ M&A environment. An acquisition announcement within the next few months is, therefore, a very real possibility.
Within days after that post, DHR announced its intent to acquire MASI. Subject to the appropriate regulatory approvals, management anticipates the acquisition will close in the second half of FY2026.
On the Q1 2026 earnings call, management states:
With the strength of our balance sheet and robust free cash flow generation, we’re well positioned for further capital deployment going forward.
I anticipate DHR will announce another meaningful acquisition before FYE2026.
When I completed my 2025 Year-End Investment Holdings Review, DHR was my 19th largest holding. The share price at the time was ~$229 and my total exposure was 903 shares in a ‘Core’ account in the FFJ Portfolio.
My current exposure is 904.11874 shares. On April 24, however, I will receive a $0.40/share dividend. As a Canadian resident holding shares in a taxable account, I incur a 15% dividend withholding tax. I, therefore, will only receive $0.34/share or ~$307.40 come the next distribution. All dividend income is directed toward the automatic purchase of additional DHR shares.
In the past several years, the divestiture of non-core businesses has allowed DHR to focus on higher margin businesses.
Despite a disappointing total investment return, DHR remains fundamentally sound (ie. growth, profitability, strong FCF generation). In my opinion, a fair value appears to be ~$240 – ~$260. DHR has the potential to provide investors with a ~28.5% return if its share price appreciates to $250 from the current $194.54 share price (($250 – $194.54)/$194.54).
I am satisfied with my current exposure and will merely increase my exposure by way of the automatic reinvestment of dividend income.
I wish you much success on your journey to financial freedom!
Note: Please send any feedback, corrections, or questions to finfreejourney@gmail.com.
Disclosure: I am long DHR.
Disclaimer: I do not know your circumstances and do not provide individualized advice or recommendations. I encourage you to make investment decisions by conducting your research and due diligence. Consult your financial advisor about your specific situation.
I wrote this article myself and it expresses my own opinions. I do not receive compensation for it and have no business relationship with any company mentioned in this article.