![]()
In my November 21, 2025 post I reviewed Veeva (VEEV) following the release of its Q3 and YTD2026 results. I subsequently provided updates on January 6 and January 18, 2026 that are accessible through the FFJ Archives.
The Q4 and FY2026 results are now available thus prompting me to revisit this existing holding.
Business Overview
VEEV is the leading provider of industry cloud solutions for the global life sciences industry. Its offerings span cloud software, data, and business consulting and are designed to meet customers’ unique needs and their most strategic business functions ranging from R&D through commercialization. These solutions help life sciences companies develop and bring products to market faster and more efficiently, market and sell more effectively, and maintain compliance with government regulations.
The best way to learn about the company is to review the company’s website and Part 1 in the most recent Form 10-K found in the SEC Filings section of the company’s website.
In 2019, VEEV set an ambitious target of achieving $3B of annual revenue by 2025. Having achieved this target, the company’s new target is to double revenue to $6B by FY2030.
Financial Review
Q4 and FY2026
Material related to the Q4 and FY2026 earnings release (including management’s prepared remarks) is accessible here.
Conventional And Modified Free Cash Flow (FCF) Calculations (FY2018 – FY2026)
VEEV deducts Capital Expenditures (CAPEX) from Operating Cash Flow (OCF) to calculate its FCF. In prior posts, however, I explain my rationale for also deducting share-based compensation (SBC) from a company’s OCF.
The following reflects VEEV’s FCF using the conventional and modified methods. We see from the historical results that the magnitude VEEV’s SBC has a material impact on FCF/share.
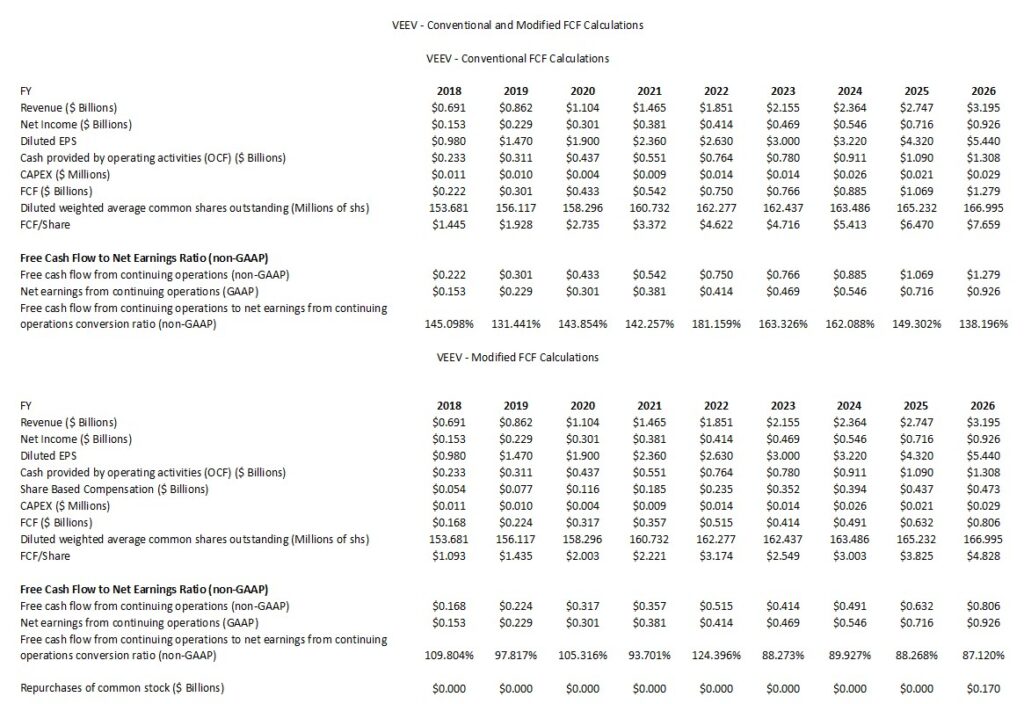
VEEV’s CAPEX might be relatively insignificant. It does, however, spend a considerable amount on research and development (~$0.629B, ~$0.693B, and ~$0.767B in FY2024 – FY2026).
ROIC and WACC
Return on Invested Capital (ROIC) provides an indication of a company’s efficiency. In essence, is a company actually creating value or ‘burning’ cash for the sake of growth?
A company with a higher ROIC is mathematically worth more because it requires less reinvestment to achieve that growth.
A good indication of how well a company is performing is to compare ROIC to the Weighted Average Cost of Capital (WACC). WACC, however, is not a metric officially reported by VEEV but it can be roughly estimated based on the company’s credit profile and market conditions.
The generally accepted high-level formula used by Wall Street is:
ROIC = NOPAT/Average Invested Capital
with the Net Operating Profit After Tax (NOPAT) formula being Operating Income (EBIT) x (1-tax rate)
This shows how much profit the core business makes while ignoring how much debt the company has.
The Average Invested Capital is the total money tied up in the business.
- The Operating Approach formula is
- The Financing Approach is
VEEV’s capital is mostly research & development which it expenses on the income statement rather than capitalizing it on the balance sheet. This can make ROIC a less than perfect metric for VEEV.
VEEV carries a considerable amount of cash and cash equivalents and marketable securities on its Balance Sheet and it has no debt. In ROIC calculations, excess cash is often treated as part of Invested Capital. Since VEEV has not ‘deployed” this cash, it artificially lowers the ROIC.
If we ‘back out’ excess cash from the Invested Capital denominator portion of the ROIC formula, we are essentially calculating ROIC on Operating Assets. For a company like VEEV, which maintains a massive, debt-free cash balance, this adjustment reveals the true power of its software engine.
In FY2024, VEEV’s adjusted ROIC dropped because of its heavy investment phase of migrating customers from Salesforce to the proprietary Veeva Vault CRM. Now that the migration is scaling, ROIC is beginning to improve.
VEEV’s WACC has risen recently to 11.6%, largely because its capital structure is almost 100% equity. As interest rates rose and the stock’s beta fluctuated during VEEV’s breakup with Salesforce, the cost of equity (and thus WACC) increased.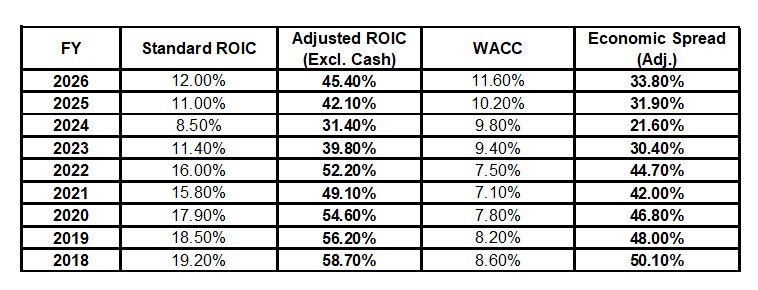
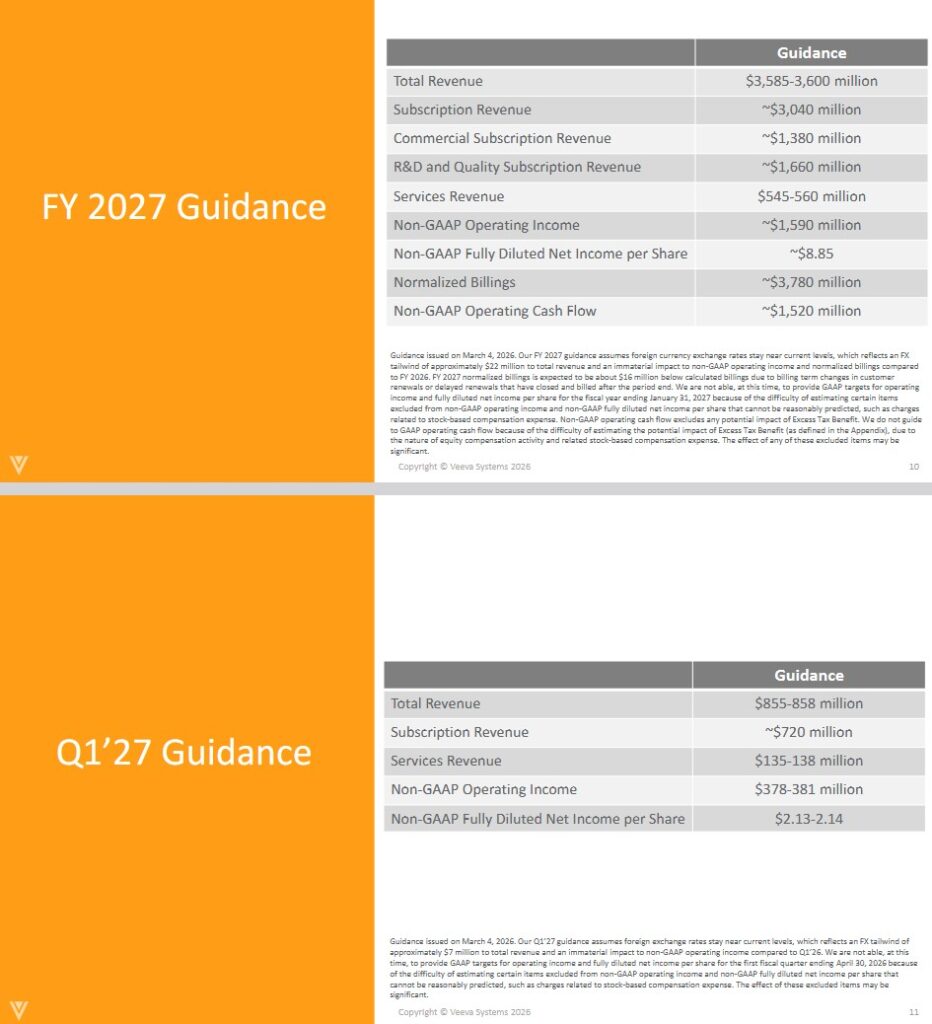
Q1 and FY2027 Guidance
The following reflects VEEV’s current guidance.
Risk Assessment
VEEV has no debt to rate.
At FYE2026, VEEV had ~$1.421B in cash and cash equivalents and ~$5.140B in short-term investments for a total of ~$6.561B. In comparison, it had:
- ~$1.119B and ~$4.031B for a total of ~$5.15B at FYE2025; and
- ~$0.703B and ~$3.324B for a total of ~$4.027B at FYE2024.
In comparison, its total liabilities at FYE2024 – FY2026 were:
- ~$1.765B in total liabilities of which ~$1.489B was deferred revenue (funds received from clients in advance of services being provided) leaving ~$0.276B in all other liabilities at FYE2026;
- ~$1.507B in total liabilities of which ~$1.274B was deferred revenue leaving ~$0.233B in all other liabilities at FYE2025; and
- ~$1.266B in total liabilities of which ~$1.050B was deferred revenue leaving ~$0.216B in all other liabilities at FYE2024.
VEEV satisfies my risk-averse investor profile.
Dividends and Dividend Yield
VEEV does not distribute a dividend.
The weighted average number of diluted shares outstanding (in millions rounded) in FY2021 – 2026 is ~160.7, ~162.2, ~162.4, ~163.5, ~165.2, and ~167.
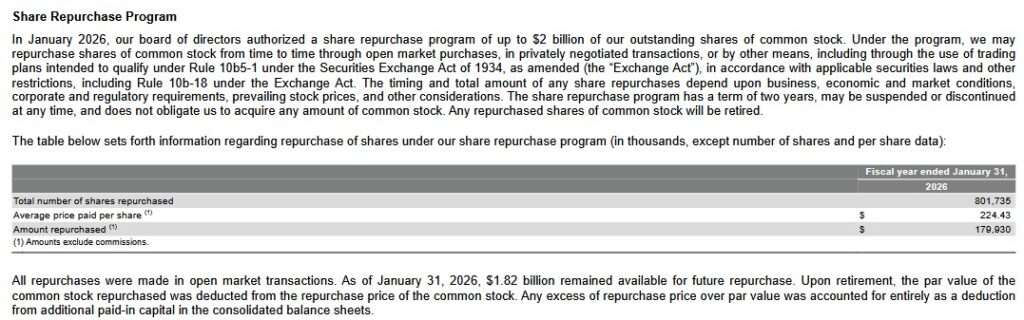
VEEV has ample liquidity and it generates strong earnings and FCF. In prior posts I express my hope for a share repurchase program. On January 5, 2025, VEEV announced a $2B share repurchase program and in Q4 2026, VEEV made its first share repurchase (~$0.17B). SBC in FY2026 was ~$0.473B but with shares being significantly undervalued, I am hopeful that VEEV can aggressively reduce the weighted average number of diluted shares outstanding (offset the annual SBC at the very least).
Valuation
I last purchased VEEV shares @ $219.45 on January 15, 2026 at which time its valuation based on analysts adjusted diluted earnings estimates was:
- FY2026 – 27 brokers – mean of $7.94 and low/high of $7.92 – $8.04. Using the mean estimate, the forward adjusted diluted PE is ~27.6.
- FY2027 – 27 brokers – mean of $8.59 and low/high of $8.23 – $8.93. Using the mean estimate, the forward adjusted diluted PE is ~25.5.
- FY2028 – 22 brokers – mean of $9.79 and low/high of $8.54 – $14.21. Using the mean estimate, the forward adjusted diluted PE is ~22.4.
With shares currently trading @ ~$178, its valuation using current estimates is:
- FY2027 – 27 brokers – mean of $8.82 and low/high of $8.06 – $9.10. Using the mean estimate, the forward adjusted diluted PE is ~20.2.
- FY2028 – 26 brokers – mean of $9.84 and low/high of $8.85 – $10.29. Using the mean estimate, the forward adjusted diluted PE is ~18.1.
- FY2029 – 12 brokers – mean of $10.76 and low/high of $8.00 – $11.66. Using the mean estimate, the forward adjusted diluted PE is ~16.5.
Valuation Based On FCF Estimates
The company’s FY2027 Non-GAAP Fully Diluted Net Income per Share outlook is ~$8.85. The non-GAAP and GAAP diluted EPS values in FY2022 – FY2026 reflect an increasing variance between GAAP and non-GAAP earnings.
- In FY2026, VEEV generated $8.10 and $5.44 of non-GAAP and GAAP earnings per share, a variance of $2.66.
- In FY2025, VEEV generated $6.60 and $4.32 of non-GAAP and GAAP earnings per share, a variance of $2.28.
- In FY2024, VEEV generated $4.84 and $3.22 of non-GAAP and GAAP earnings per share, a variance of $1.62.
- In FY2023, VEEV generated $4.28 and $3.00 of non-GAAP and GAAP earnings per share, a variance of $1.28.
- In FY2022, VEEV generated $3.73 and $2.63 of non-GAAP and GAAP earnings per share, a variance of $1.10.
If the increase in variance continues at the same pace, the variance in FY2027 could be ~$3.05. Deduct ~$3.05 from the ~$8.85 FY2027 non-GAAP outlook and the FY2027 GAAP EPS could be ~$5.80.
If we apply a 138% FCF to net earnings ratio (to be somewhat consistent with FY2026), VEEV’s FCF/share could be ~$8.00 (~$5.80 x 138%) when calculated under the conventional method.
If we apply a 87% FCF to net earnings ratio (to be somewhat consistent with FY2023 – FY2026), VEEV’s FCF/share would be ~$5.05 (~$5.80 x 87%) when calculated under the modified method.
Using the current ~$178 share price, VEEV’s P/FCF is ~22.3 if we use ~$8.00 or ~35.2 if we use ~$5.05.
These valuations are far superior to those reflected in prior posts.
Final Thoughts
VEEV has become a dominant player in life sciences by building software specifically for the unique regulatory and operational needs of pharmaceutical and biotech companies rather than trying to adapt a general-purpose tool. Since initiating a position in March 2024, I have gradually increased my exposure and currently hold 800 shares in a ‘Core’ account in the FFJ Portfolio at an average cost of $216.1643. It was my 28th largest holding when I completed my 2025 Year-End Investment Holdings Review but it may not currently be a top 30 holding.
Although VEEV’s annual CAPEX is negligible, it MUST spend a considerable amount annually on research & development (~$0.767B in FY2026). Looking at the annual R&D spend growth over the past several years, it is quite possible that VEEV’s annual R&D expenses could easily approach $1B in the next few years given its ambitious target to double revenue to $6B by FY2030.
VEEV’s weighted average number of diluted shares outstanding has increased significantly in recent years. It now appears that VEEV is beginning to address my concern about this increase with the repurchase of 801,735 shares @ $224.43 in FY2026. At FYE2026, VEEV had $1.82B remaining available for share repurchases. VEEV certainly has ample liquidity to repurchase a significant number of shares which is why I want its share price to remain under pressure.
In my opinion, a fair price is ~$240 – ~$250 thereby making VEEV an attractive investment opportunity at ~$178.
Note: Please send any feedback, corrections, or questions to finfreejourney@gmail.com.
Disclosure: I am long VEEV.
Disclaimer: I do not know your circumstances and do not provide individualized advice or recommendations. I encourage you to make investment decisions by conducting your own research and due diligence. Consult your financial advisor about your specific situation.
I wrote this article myself and it expresses my own opinions. I do not receive compensation for it and have no business relationship with any company mentioned in this article.