![]()
I last reviewed SPGI in my August 1, 2025 post at which time the most current financial information was for Q2 and YTD2025. I, however, published a brief post on September 18, 2025 in which I disclose the purchase of additional shares in the FFJ Portfolio.
On February 10, 2026, S&P Global (SPGI) released its Q4 and FY2025 results and FY2026 guidance thus prompting me to revisit this existing holding.
Business Overview
Learn about SPGI’s business and risk factors by reading Part 1 in the FY2024 10-K and the company’s website.
OSTTRA Divestiture
In FY2025, SPGI and CME Group signed a definitive agreement to sell OSTTRA, a leading provider of post-trade solutions for the global OTC market, to investment funds managed by KKR, a leading global investment firm. The terms of the deal equalled a total enterprise value of $3.1B, subject to customary purchase price adjustments.
SPGI applied its 50% share of the net proceeds toward share repurchases.
Mobility Division Spin-Off
On April 29, 2025 SPGI announced its intent to separate S&P Global Mobility (Mobility) from SPGI. The separation will result in Mobility becoming a standalone public company.
On February 3, 2026, the company officially announced that the new entity will be named Mobility Global, Inc..
The separation is to be tax-free to shareholders with a target completion by late 2026 (within the original 12-to-18-month window provided during the April 29, 2025 announcement).
Financial Results
Q4 and FY2025
Material related to the Q4 and FY2025 earnings release is accessible here.
SPGI has surpassed consensus EPS estimates 3 times over the last four quarters. Nevertheless, Q4 2025 results and a FY2026 earnings forecast fell short of analysts’ expectations.
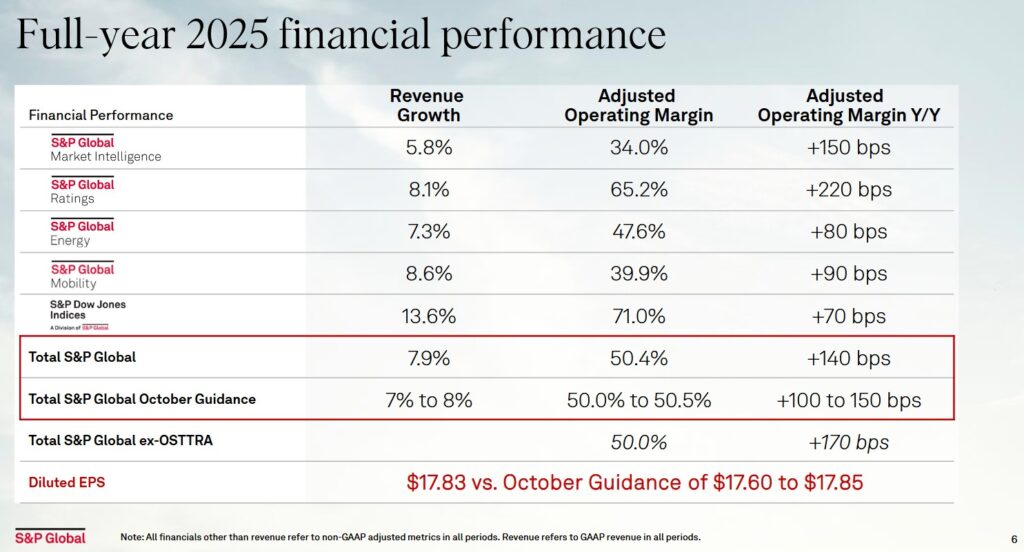
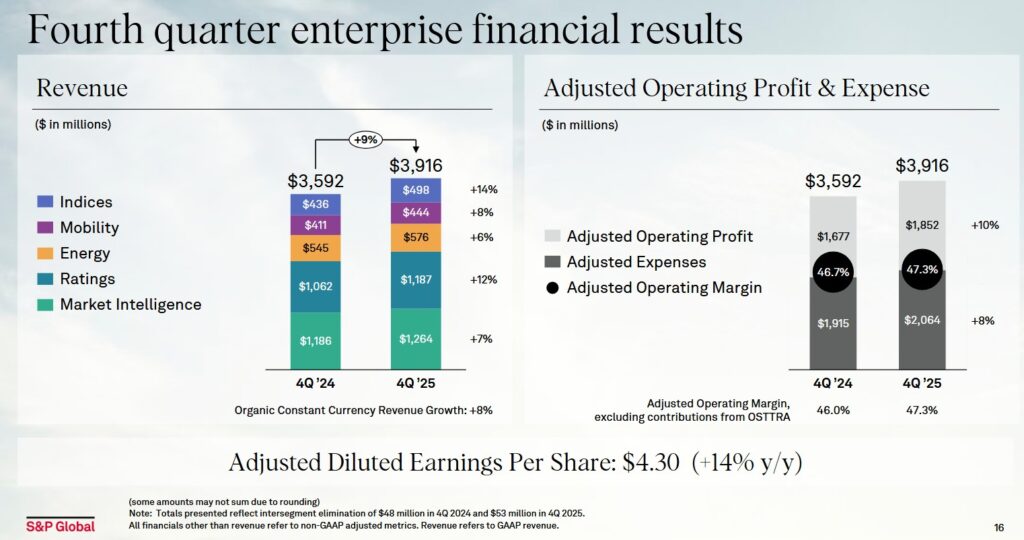
Details about each business segment’s performance in Q4 2025 relative to Q4 2024 is in the Q4 2025 related material.
Operating Cash Flow (OCF), Free Cash Flow (FCF), and CAPEX (FY2019 – FY2025)
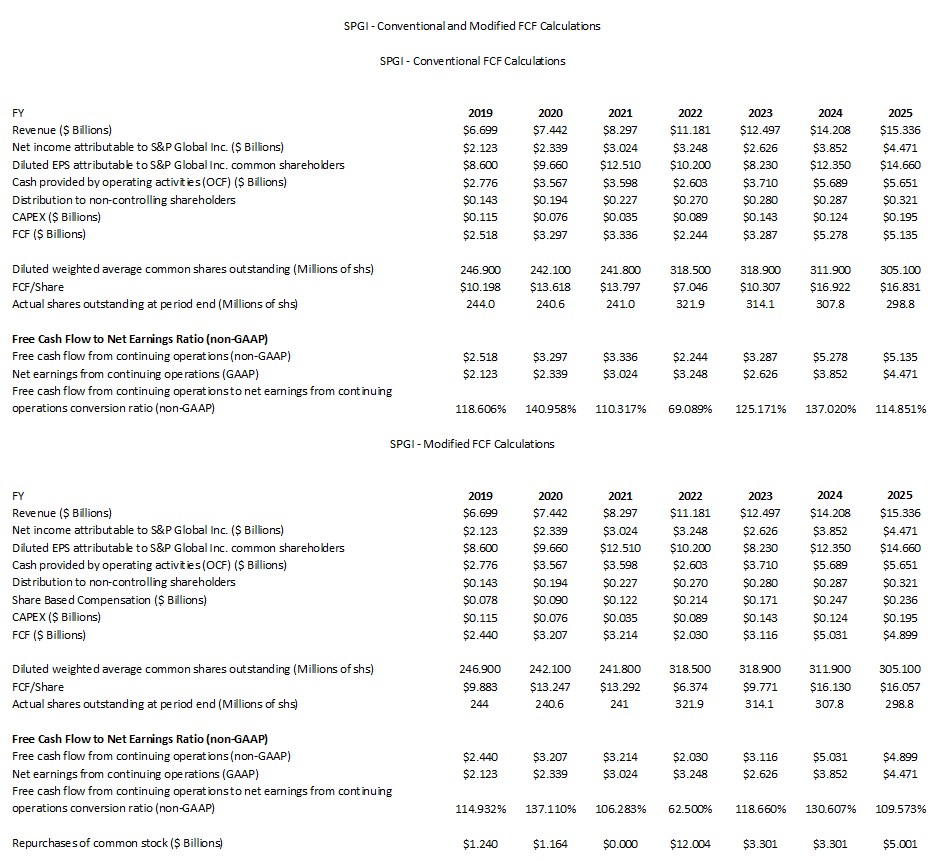
FCF is a non-GAAP metric, and therefore, its method of calculation is inconsistent. Historically, SPGI deducts CAPEX from OCF to calculate its FCF. In prior posts, however, I explain my rationale for also deducting share-based compensation (SBC) from a company’s OCF.
SPGI deducts distributions to non-controlling interests in determining its FCF. I neglected to do so in my prior post and now account for this line item.
The following reflects SPGI’s FCF using the conventional and modified calculation methods.
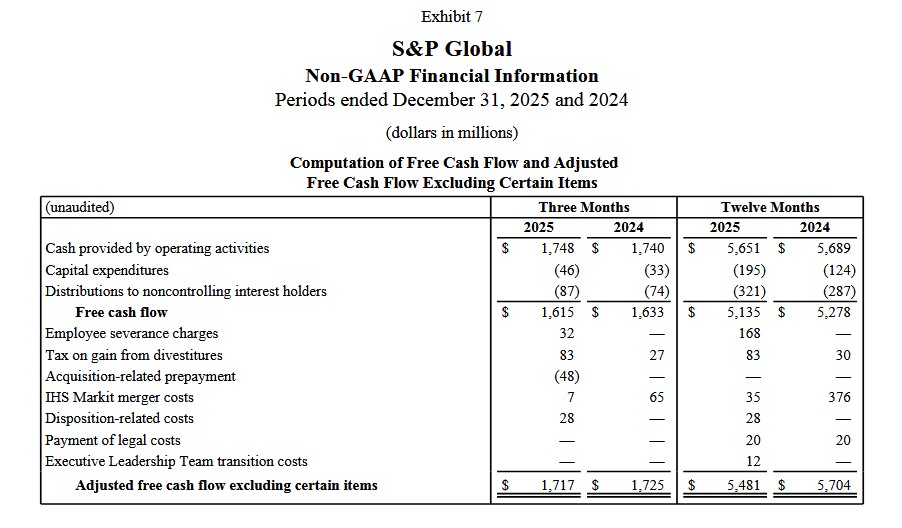
The following reflects how SPGI determines FCF in Q4 2024 and Q4 2025 and FY2024 and FY2025.
Capital Allocation
During the FY2019 – FY2025 time frame, SPGI transitioned from a steady-state financial data provider to an expanded information powerhouse through its $44B acquisition of IHS Markit announced in 2020 and completed in 2022. Its capital allocation strategy during this period was characterized by a disciplined rule of returning 85% of adjusted free cash flow to shareholders while executing massive strategic reconfigurations.
SPGI has now expanded into high-growth adjacencies with added depth in private markets, energy transition, and supply chain data.
In order to obtain regulatory approval for the IHS Markit acquisition, SPGI divested several assets, including its CUSIP Global Services business (sold to FactSet for ~$1.9B) and its Engineering Solutions division (sold to KKR for ~$1.2B).
As noted earlier in this post, SPGI will also be separating S&P Global Mobility into a standalone public entity. This move signals a refined focus on the company’s 4 core pillars: Ratings, Market Intelligence, Energy, and Indices.
In addition to its 50+ year track record of dividend increases, it has repurchased more than $26B of its shares in FY2019 – FY2025.
A significant portion of capital is being allocated toward revenue from new/enhanced products. SPGI generally allocates ~$1B+ annually to technology. In the past couple of years, SPGI has shifted its technology spend heavily toward Generative AI integration across its data platforms and ‘Market Intelligence’ workflows.
FY2026 Guidance
The following reflects SPGI’s FY2026 guidance for the company as a whole and by division.

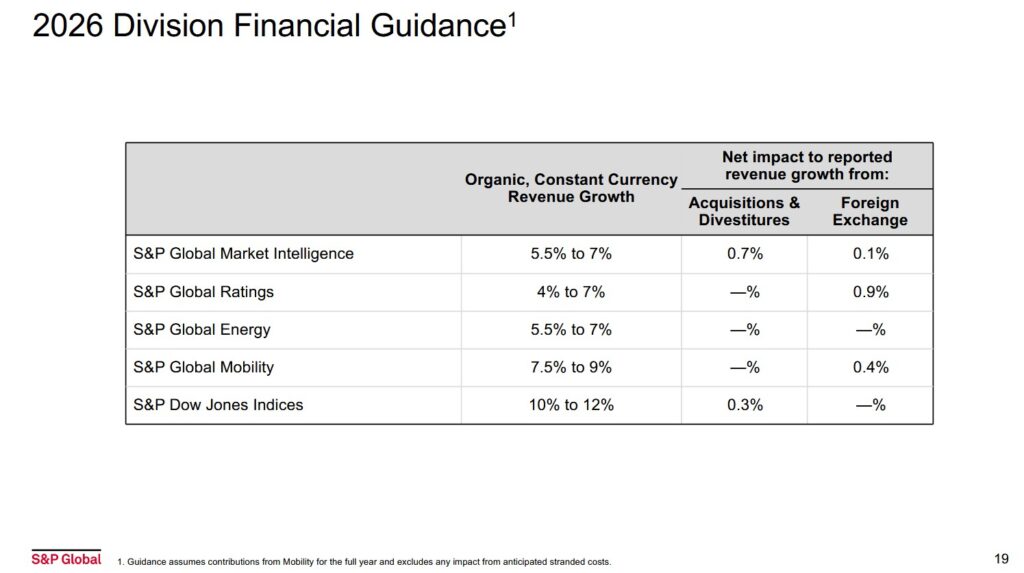
The market’s negative reaction appears to be partially attributed to a few revenue blips in Q4 and and a slightly weaker-than-expected ratings outlook.
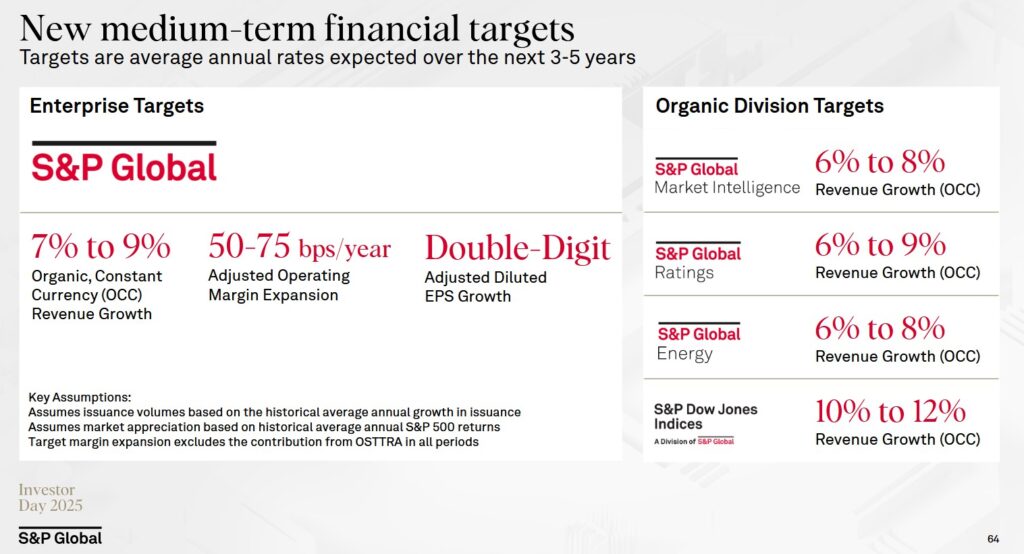
Elevated deal activity and low spreads have spurred bond issuance but SPGI’s FY2026 revenue growth guidance for its Ratings segment is 4% – 7%. This is below the firm’s 6% – 9% medium-term target for this segment that was unveiled at SPGI’s November 2025 Investor Day.
On the Q4 2025 earnings call on February 10, 2026, management states:
Our base case assumption starts with billed issuance up low to mid-single digits in 2026. We continue to see favorable market conditions, with spreads remaining low and our expectation for two rate cuts from the U.S. Fed in the back half of the year. We also see encouraging maturity walls. M&A tends to be more challenging to predict, but we saw a strong pipeline of deals announced in the back half of 2025 and continue to see pent-up demand given the dry powder in the market.
We also saw significant debt issuance from hyperscaler investments in AI infrastructure in the second half of 2025, and we expect that to continue in 2026, albeit spread more throughout the year. Given the phasing of issuance in 2025 and the expectations for 2026, we would expect growth rates to fluctuate from quarter to quarter. We expect bond issuance growth year over year in the first quarter, with acceleration in the second quarter as we lap the disruption from last April. Given the difficult compare, we would then expect deceleration in the third quarter before bond issuance growth turns negative in the fourth quarter. In the event of macroeconomic distress, elevated market volatility or uncertainty, or a slowdown in economic growth, we would expect bond issuance to be lower than our forecast.
We could see potential upside if we see elevated M&A, additional pull forward from outyear maturity walls, or greater than expected debt for technology and infrastructure projects. Given that refinancing activity tends to be the most predictable issuance in a given year, I wanted to spend an extra moment to discuss what we’re seeing for 2026. When comparing the 2026 maturity wall now to the 2025 maturity wall a year ago, we see 12% higher maturities and a stable mix of high yield versus investment grade. The two year and three year cumulative maturity walls are also up from last year.
While our base case assumption is that we do not see dramatic pull forward from the 2027 and 2028 walls into 2026, we note that if credit conditions remain highly favorable and we see additional reductions in interest rates, we may start to see more of that debt coming to market early.
ROIC and WACC
Return on Invested Capital (ROIC) provides an indication of a company’s efficiency. In essence, is a company actually creating value or ‘burning’ cash for the sake of growth?
A company with a higher ROIC is mathematically worth more because it requires less reinvestment to achieve that growth.
A good indication of how well a company is performing is to compare ROIC to the Weighted Average Cost of Capital (WACC). WACC, however, is not a metric officially reported by SPGI but it can be roughly estimated based on the company’s credit profile and market conditions.
The generally accepted high-level formula used by Wall Street is:
ROIC = NOPAT/Average Invested Capital
with the Net Operating Profit After Tax (NOPAT) formula being Operating Income (EBIT) x (1-tax rate)
This shows how much profit the core business makes while ignoring how much debt the company has.
The Average Invested Capital is the total money tied up in the business.
- The Operating Approach formula is
- The Financing Approach is
One shortcoming with ROIC is that it is a non-GAAP metric meaning the input data plugged into the ROIC formula is inconsistent.
SPGI’s financial profile during the 2019–2025 period was defined by the massive $44B IHS Markit merger, which caused a temporary structural dip in ROIC followed by a steady recovery through 2025 as synergies were realized.
Before the 2022 merger with IH Markit, SPGI was an exceptionally ‘asset-light’ business with an ROIC often exceeding 40% – 50%. The 2022 merger, however, fundamentally altered the denominator of the ROIC = NOPAT/Average Invested Capital equation.
In 2022 – 2023, upon closing the IHS Markit deal, SPGI’s invested capital base expanded significantly due to the large amount of goodwill and intangibles added to the balance sheet. This caused ROIC to drop into the low teens (10% – 13%) on a reported basis.
In 2024 – 2025, SPGI’s ROIC has improved driven by cost synergies, margin expansion, and asset divestitures.
SPGI’s WACC remained relatively stable but faced upward pressure during the high-interest-rate environment of 2023–2024. It has, however, maintained a a STRONG capacity to meet its financial commitments.
Its cost of debt has stabilized as the company has proactively managed its debt maturity profile.
Like most of its peers in the financial data sector, SPGI’s WACC is estimated to sit in the ~8% – ~9.5% range.
Risk Assessment
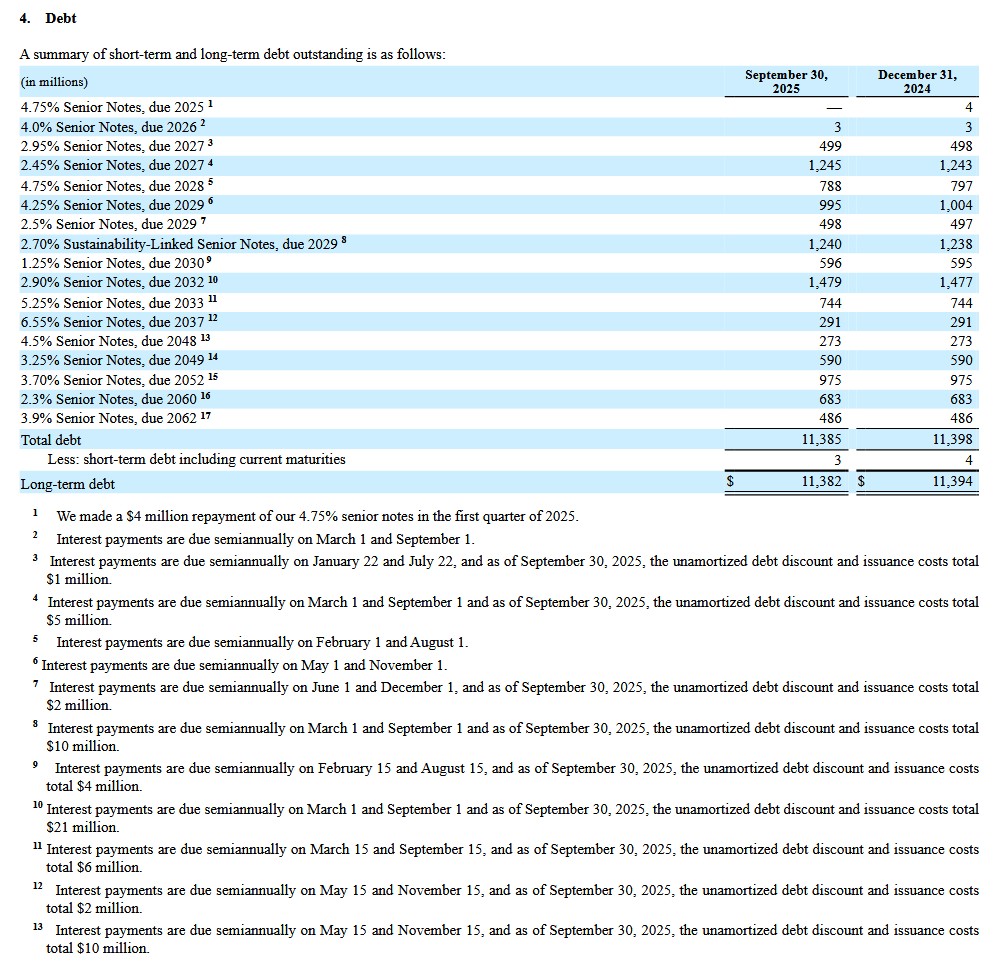
I hate losing money more than I like making money which is why I pay particularly close attention to the risk aspect of my investments. Given this, I have a particular interest in a company’s schedule of long-term debt.
SPGI’s short-term debt at FYE2025 is ~$0.718B and its long-term debt is ~$12.37B. Looking at its scheduled of short- and long-term-debt at the end of Q3 2025, we see that the long-term debt is ~$1B greater than at the end of Q3 2025 and FYE2024.
The company generates ample FCF and I see no reason why SPGI should not be able to meet its contractual short- and long-term obligations.
On August 8, 2018, Moody’s upgraded SPGI’s domestic senior unsecured debt from Baa1 to A3. This is the lowest tier within the upper-medium investment-grade group of ratings. This rating was affirmed on October 2, 2025.
This rating means SPGI has a STRONG capacity to meet its financial commitments. It is, however, somewhat more susceptible to the adverse effects of changes in circumstances and economic conditions than obligors in higher-rated categories.
SPGI’s credit risk is acceptable from my perspective.
Dividend and Dividend Yield
SPGI’s dividend history on its website only dates back to 1995 but its track record of consecutive years of dividend increases extends well beyond this.
On January 14, 2026, SPGI declared an increase in its quarterly dividend from $0.96/share to $0.97/share commencing with the dividend payable on March 11, 2026. This increase is negligible but as a long-term investor looking at a company’s potential total overall return, a company’s dividend metrics are irrelevant in my decision making process.
I hold SPGI shares in taxable accounts. As a Canadian resident, I incur a non-recoverable 15% dividend withholding tax. In addition, I must declare dividend income annually. Being in the highest income tax bracket, I take ANOTHER ‘haircut’.
I prefer that a company:
- retain money to grow the business if it can generate returns well in excess of its cost of capital; and/or
- repurchase undervalued shares.
Share Repurchases
Following completion of the February 2022 ~$44B IHS Markit acquisition, SPGI’s weighted average diluted shares outstanding surged from 241.8 million shares in FY2021 to 318.5 million in FY2022 (see table in the Operating Cash Flow (OCF), Free Cash Flow (FCF), and CAPEX section of this post).
By FYE2025, the actual shares outstanding amount to 298.8 million.
SPGI expects to continue to return ~85% of adjusted FCF to shareholders through dividends and share repurchases.
FY2026 guidance does not specifically mention SPGI’s share repurchase plans in FY2026. Its track record of share repurchases, however, suggests we can expect more share repurchases in FY2026.
Valuation
SPGI projects a FY2026 adjusted diluted EPS of $19.40 – $19.65. This fell short of the Wall Street consensus of ~$19.96.
With shares trading at ~$401 at the February 10 market close, the forward adjusted diluted PE range is ~20.4 – ~20.7.
The forward-adjusted diluted PE levels using the current share price and broker estimates are:
- FY2026 – 25 brokers – ~20.5 using a mean of $19.59 and low/high of $16.62 – $20.04.
- FY2027 – 24 brokers – ~18.2 using a mean of $22.02 and low/high of $18.72 – $22.70.
- FY2028 – 11 brokers – ~16.1 using a mean of $24.90 and low/high of $24.25 – $25.94.
Considering SPGI just released its results, I fully expect these estimates to change over the next few days.
I place little reliance on earnings estimates beyond the next 4 quarters since much can change beyond this time frame. We also know that SPGI will spin-off its Mobility segment in late 2026. The current broker estimates will require amendments in due course to account for the spin-off.
SPGI’s FY2025 FCF using my modified method of calculating FCF is $4.899B (see the Operating Cash Flow (OCF), Free Cash Flow (FCF), and CAPEX (FY2019 – FY2025) section of this post). The weighted average diluted shares outstanding in FY2025 is 305.1 million. This gives us ~$16.06 FCF/share for FY2025. This is lower than the ~$17.90 FCF/share I calculate in my prior post. SPGI’s current ~$401 share price, however, is considerably lower than $512.96 on September 18. Divide ~$401 by ~$16.06 and the P/FCF is ~25. In my prior post I calculate P/FCF as being ~28.7.
We also know that at FYE2025, the number of diluted shares outstanding was 298.8 million. Divide FCF of $4.899B by 298.8 million and the FCF/share is ~$16.4. Divide ~$401 by ~$16.40 and the P/FCF is ~24.5.
For comparison, this is what I reflect in my September 18, 2025 post:
Using management’s $14.35 – $14.60 GAAP diluted EPS guidance and my September 18 ~$512.96 weighted average purchase price, the forward diluted PE is ~35.4 based on the ~$14.475 mid-point. The forward adjusted diluted PE is ~30 based on the ~$17.125 mid-point of management’s $17.00 – $17.25 adjusted diluted EPS guidance.
The forward-adjusted diluted PE levels using my average purchase price and broker estimates are:
- FY2025 – 24 brokers – ~29.8 using a mean of $17.23 and low/high of $17.12 – $17.40.
- FY2026 – 24 brokers – ~26.6 using a mean of $19.26 and low/high of $18.75 – $19.95.
- FY2027 – 18 brokers – ~23.8 using a mean of $21.55 and low/high of $20.77 – $23.05.
As noted in several previous posts, I place almost no reliance on earnings estimates beyond the current fiscal year.
In my August 1, 2025 post, I note that the FYE2024 shares outstanding was 307.8 million. I anticipated the FYE2025 shares outstanding could drop to ~301 million suggesting a ~304.4 million mid-point (~301 – ~307.8 million).
To estimate SPGI’s valuation using FCF, divide the average of management’s adjusted guidance (~$5.7B) by ~304.4 million shares to arrive at ~$18.73 in FCF/share. Divide the $512.96 weighted average purchase price of my September 18 purchases, and the forward P/FCF is ~27.4.
If we estimate FY2025’s SBC will be ~$0.255B (~$0.247B in FY2024), the FY2025 FCF drops to ~$5.445B ($5.7B – ~$0.255B). Divide this by 304.4 million shares and we get ~$17.90 FCF/share. Divide $512.96 by ~$17.90 and the P/FCF is ~28.7.
Final Thoughts
SPGI’s share price has recently faced significant pressure. The business remains fundamentally sound but a few factors have converged to dampen investor sentiment. The market’s reaction to SPGI’s results and guidance is typical of a jittery market. In such an environment, the expectation is for knee-jerk reactions.
The recent release of Claude’s Opus 4.6 model is designed to carry out financial research. This has many investors on edge as to the extent to which AI will disrupt certain markets. In my opinion, SPGI’s Market Intelligence clients have meaningful switching costs. Furthermore, the company’s S&P’s proprietary benchmarks (ratings, indexes, Platts) are likely insulated from AI disruption.
Guidance for organic constant currency revenue growth was set at 6% – 8%. This is a slight deceleration compared to the 8% growth achieved in FY2025.
Analysts point to weak guidance (projected at 4% – 7%) in the Ratings division. This suggests that the post-pandemic surge in bond issuance may be normalizing or facing headwinds from persistent interest rate uncertainty.
The Q4 2025 results released on February 10, 2026 include reported adjusted EPS of $4.30, narrowly missing the consensus estimate of $4.32 – $4.34. It is common knowledge that stocks priced to perfection can experience outsized price corrections even if earnings miss ever so slightly.
SPGI is in the process of spinning off its Mobility division (formerly part of IHS Markit) into a standalone public entity. The purpose of this spin-off is to unlock value. Spin-offs, however, often create short-term ‘technical’ selling and uncertainty regarding the remaining ‘core’ company’s growth profile. This is very similar to what Becton Dickinson (BDX) is going through with a spin-off of part of its business; I cover this in my February 10, 2026 BDX post.
The late 2025 $1.8B acquisition of With Intelligence has also added to integration ‘noise’, leading some investors to favor a simpler story in a volatile market.
There is also an ongoing debate regarding the impact of Generative AI on the Market Intelligence segment. SPGI invests heavily in AI but some investors fear that large language models (LLMs) could eventually commoditize high-end financial data or that the company will have to spend more on R&D to maintain its competitive moat, potentially squeezing future margins.
NOTE: LLMs are a highly advanced pattern-recognition engine that has ‘read’ a massive portion of the internet (books, research papers, financial reports, and news).
When I completed my 2024 Year End Review, SPGI shares were trading at ~$496 and it was my was my 17th largest holding.
At the time of my 2025 Mid-Year Portfolio Review, SPGI had become my 6th largest holding (350 shares in a ‘Core’ account and 200 shares in a ‘Side’ account in the FFJ Portfolio) and shares were trading at ~$527.30.
When I completed my 2025 Year-End Investment Holdings Review, SPGI was my 4th largest holding (450 shares in a ‘Core’ account and 300 shares in a ‘Side’ account in the FFJ Portfolio) and shares were trading at ~$522.59.
On February 6, 2026 I acquired 50 shares @ ~$438.5154 in a ‘Core’ account in the FFJ Portfolio. On February 10, 2026, I acquired another 50 shares @ ~$413.085 in another ‘Core’ account in the FFJ Portfolio. Together, I hold 550 SPGI shares in ‘Core’ accounts and 300 shares in a ‘Side’ account.
I like the company’s long-term outlook despite the current negative market sentiment. In my opinion, this is an opportune time to acquire shares in SPGI.
I wish you much success on your journey to financial freedom!
Note: Please send any feedback, corrections, or questions to finfreejourney@gmail.com.
Disclosure: I am long SPGI.
Disclaimer: I do not know your circumstances and do not provide individualized advice or recommendations. I encourage you to make investment decisions by conducting your research and due diligence. Consult your financial advisor about your specific situation.
I wrote this article myself and it expresses my own opinions. I do not receive compensation for it and have no business relationship with any company mentioned in this article.