![]()
I last reviewed Danaher (DHR) in this October 22, 2025 post following the release of Q3 and YTD2025 results. Despite the recent surge in the share price, I deemed shares to still be undervalued. I did not, however, add to my exposure. My last purchase, therefore, is 100 shares @ $188.30 on July 21, 2025 in a ‘Core’ account in the FFJ Portfolio.
When I completed my 2025 Year-End Investment Holdings Review, my total exposure was 903 shares making it my 19th largest holding. The share price at the time of that review was ~ $229.
This is a good time to revisit this holding given the release of Q4 and FY2025 results and FY2026 guidance on January 28, 2026.
Business Overview
DHR is a global science and technology innovator committed to accelerating the power of science and technology to improve human health. It is comprised of more than 18 operating companies with leadership positions in the biotechnology, life sciences and diagnostics sectors, organized under three segments (Biotechnology, Life Sciences and Diagnostics). Its research and development, manufacturing, sales, distribution, service and administrative facilities are located in more than 50 countries.
Links to the websites of the entities under the DHR umbrella are accessible here.
Part 1 Item 1 in the Form 10-K that is accessible through the SEC Filings section of the company’s website provides ample information to learn about the company.
Financials
Q4 and FY2025 Results
On January 28, 2026, DHR released Q4 and FY2025 results and provided FY2026 guidance. Refer to the material available in the Quarterly Earnings section of DHR’s website.
Conventional And Modified Free Cash Flow (FCF) Calculations (FY2019 – FY2025)
Since Free Cash Flow (FCF) is a non-GAAP metric, there is no standardization in its calculation. In several posts I express my thoughts on the method by which many companies calculate it. Most companies merely deduct net CAPEX from net cash flows from operating activities. I, however, think it is also necessary to deduct share based compensation (SBC).
Many companies employ SBC as part of their employee compensation plans. Because SBC involves no cash outlay, companies add back SBC to determine net cash flows from operating activities in the Condensed Consolidated Statement of Cash Flows.
Suppose, however, that DHR were to compensate employees 100% by way of SBC. Since there is no cash outlay, the full amount of its employee compensation would be added back in the Condensed Consolidated Statement of Cash Flows to determine net cash flows from operating activities.
If, on the other hand, DHR were to have no SBC and were to actually disburse funds to pay its employees, nothing would be added back in the Condensed Consolidated Statement of Cash Flows. The entire amount paid to employees would be expensed on the Income Statement.
We arrive at very different net cash flows from operating activities by merely changing the manner in which a company compensates its employees!
This makes no sense. Is SBC not a form of ‘financing’?
It might be more proper to reflect SBC within the Cash Flows From Financing Activities section of the Condensed Consolidated Statement of Cash Flows. This way, we would arrive at similar FCF results no matter how a company chooses to compensate its employees.
The following table reflects data extracted from the FY2019 – FY2025 reconciliation of GAAP and non-GAAP financial measures and supplemental forward-looking information documents that are accessible here. The modified FCF calculations deduct share based compensation (SBC) from total operating cash provided by continuing operations.

Strong free cash flow generation is one of the most important metrics at DHR. FY2025 marked the 34th consecutive year of FCF to net income conversion which exceeded 100%. If we deduct SBC to determine FCF, however, DHR just fell short of 100% in FY2022.
FY2026 Outlook
DHR’s FY2026 outlook calls for ~3% – ~6% core revenue growth and $8.35 – $8.50 in adjusted diluted EPS.
In Q1 2026, management expects low single-digit core revenue growth and an adjusted operating margin of ~28.5%.
The expectation is for bioprocessing to remain strong with projected high single-digit core revenue growth in bioprocessing for FY2026.
The current backlog and order trajectory support equipment revenue improving to approximately flat for the year.
ROIC and WACC
Return on Invested Capital (ROIC) provides an indication of a company’s efficiency. In essence, is a company actually creating value or ‘burning’ cash for the sake of growth?
A company with a higher ROIC is mathematically worth more because it requires less reinvestment to achieve that growth.
A good indication of how well a company is performing is to compare ROIC to the Weighted Average Cost of Capital (WACC).
The generally accepted high-level formula used by Wall Street is:
ROIC = NOPAT/Average Invested Capital
with the Net Operating Profit After Tax (NOPAT) formula being Operating Income (EBIT) x (1-tax rate)
This shows how much profit the core business makes while ignoring how much debt the company has.
The Average Invested Capital is the total money tied up in the business.
- The Operating Approach formula is
- The Financing Approach is
One shortcoming with ROIC is that it is a non-GAAP metric meaning the input data plugged into the ROIC formula is inconsistent.
DHR’s ROIC in FY2019 – FY2025 has typically in the mid to high single digits. Its WACC during this period, however, has risen from the mid 4% level in FY2019 – FY2020 to the high single digits in FY2021 – FY2025. In FY2023 – FY2025, DHR’s WACC has marginally exceeded its ROIC.
These results, on the surface, may lead to an investor seriously questioning whether DHR is a worthwhile investment.
The ROIC decline in recent years is attributed in part to the ‘post-pandemic normalization’ in bioprocessing demand (inventory destocking) and the spin-off of Veralto on September 30, 2023, which removed a high-margin environmental segment from DHR’s balance sheet. DHR has also undergone a significant portfolio transformation in 2019 – 2025 by shifting into a pure-play life sciences and diagnostics innovator. This transition included the massive acquisition of GE Biopharma (now Cytiva) in 2020.
When DHR makes a sizable acquisition, Goodwill and Intangibles instantly increase on DHR’s Balance Sheet (the ‘Invested Capital’ capital component of the ROIC formula) while the Net Operating Profit After Tax (NOPAT) numerator takes years to scale through the Danaher Business System (DBS).
Investor need to recognize that DHR’s major acquisitions are very rarely made at book value. The premium it pays is recorded as Goodwill and Intangibles (brands, patents, customer relationships). These assets stay on the balance sheet under ‘Invested Capital’. Because the price paid for acquisitions is often many times the target’s physical assets, the denominator in the ROIC formula becomes very large.
A large denominator means DHR must generate massive amounts of NOPAT just to keep a steady ROIC. This is why DHR’s mid to high single digits ROIC often looks lower than other companies that have fewer intangible assets. DHR’s FYE2025 Goodwill is $43.151B and its Other Net Intangible Assets are $17.817B for a total of $60.968B. Total Assets, in comparison, amount to $83.464B.
Under GAAP, Intangible Assets (unlike Goodwill) must be amortized over time. This amortization is an accounting expense that reduces GAAP Operating Profit. While amortization reduces the ‘accounting’ ROIC, it is a non-cash expense. This explains why many investors often calculate ROIC by adding back amortization to NOPAT to see how the underlying business is actually performing.
Goodwill is not amortized, however, it is tested annually for impairment. Should DHR overpay for an acquisition and that company fails to meet growth targets, DHR must ‘write down’ Goodwill. A write-down actually reduces the denominator (Invested Capital), which can artificially inflate ROIC in future periods because the capital base appears smaller, even though the company actually lost value.
Risk Assessment
DHR has attractive credit arrangements with well staggered scheduled maturities.
The schedule of DHR’s long-term debt (~$18.416B) at FYE2025 is currently unavailable, and therefore, I provide its schedule of long term debt at the end of Q3 2025 and FYE2024.
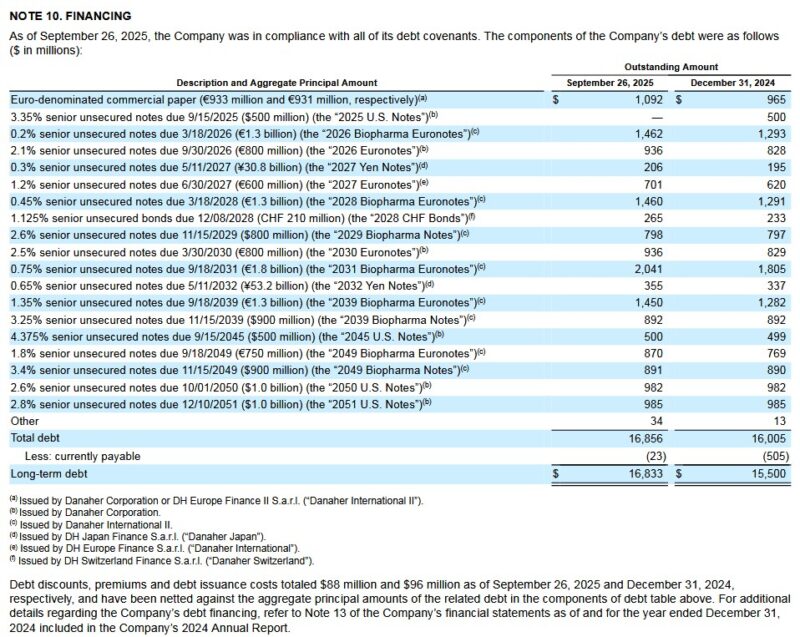
At FYE2025, DHR had ~$4.615B in cash and equivalents versus ~$1.528B at the end of Q3 2025 and ~$2.078B at FYE2024. While gross debt increased ~$1.58B relative to the end of Q3 2025, the Net Debt stayed nearly flat because the majority of the borrowed funds remained on the Balance Sheet as cash at FYE2025.
The increase in long term debt in Q4 was primarily driven by strategic capital allocation to strengthen the company’s liquidity and to prepare for an anticipated uptick in M&A activity in 2026. On the Q4 2025 earnings call, management mentions that the M&A environment had become ‘more constructive’. Given this, DHR took advantage of a constructive credit market in late 2025 to issue new long-term notes.
In addition, DHR repaid upcoming 2026 debt maturities (see debt maturing in 2026 in the above schedule), ensuring it maintains a long-dated, low-cost debt profile before any potential interest rate volatility in 2026.
With Net Debt to EBITDA ratio remaining below 2.0x, the increased debt provides the the liquidity for potential bolt-on acquisitions in the Bioprocessing and Life Sciences sectors.
DHR’s credit ratings remain the same from my last review.
- Moody’s: Upgraded to A2 from A3 on November 17, 2025 and the outlook is stable.
- S&P Global: Upgraded to A- from BBB+ on June 11, 2022. June 23, 2025 is the last review date and the outlook is stable.
Moody’s rating is the middle tier of the upper-medium investment-grade tier while S&P’s rating is the bottom tier of the upper-medium investment-grade tier. They define DHR as having a STRONG capacity to meet its financial commitments. DHR, however, is somewhat more susceptible to the adverse effects of changes in circumstances and economic conditions than obligors in higher-rated categories.
These ratings satisfy my conservative investment profile.
Dividend and Dividend Yield
DHR’s quarterly dividend is likely to remain a negligible component of the total investment return. Do not, however, fixate on dividend metrics. Focus on total potential long-term investment returns!
On September 9, 2025, DHR’s Board approved a new share repurchase program authorizing the periodic repurchase of up to 35 million shares on the open market.
The table found in the Conventional And Modified Free Cash Flow (FCF) Calculations (FY2019 – FY2025) section of this post shows that DHR has repurchased $9.067B of its issued and outstanding shares in FY2024 and FY2025.
This table reflects 717.9 million as the weighted average number of diluted shares outstanding in FY2025. At FYE2025, however, the weighted average had been reduced to 711 million.
Valuation
In FY2025, DHR generated diluted EPS and adjusted diluted EPS of $5.05 and $7.80. The January 30, 2025 closing share price was $218.89 thus giving us a diluted PE and adjusted diluted PE of ~43.3 and ~28.1.
DHR’s adjusted diluted earnings forecast for FY2026 is $8.35 – $8.50. Using the current $218.89 share price and management’s guidance, the forward adjusted diluted PE is ~25.75 – ~26.2.
Using the current share price and the currently available broker adjusted diluted EPS estimates, the forward adjusted diluted PE levels are:
- FY2026 – 25 brokers – mean of $8.43 and low/high of $8.35 – $8.75. Using the mean, the forward adjusted diluted PE is ~26.
- FY2027 – 24 brokers – mean of $9.16 and low/high of $9.00 – $9.85. Using the mean, the forward adjusted diluted PE is ~23.9.
- FY2028 – 16 brokers – mean of $10.11 and low/high of $9.77 – $11.15. Using the mean, the forward adjusted diluted PE is ~21.7.
DHR’s FY2025 FCF/share was $7.391 and $6.975 (see table above) calculated using the conventional and the modified methods. Using the current $218.89 share price, the P/FCF is ~30 and ~31.4.
DHR’s FCF conversion ratio generally exceeds 100% meaning it generates more FCF/share than EPS/share. I expect this will continue in FY2026, and therefore, DHR’s P/FCF should be roughly the same (or slightly better) than the FY2026 forward adjusted diluted PE of ~26.
For comparison, I reflect the following in my October 22, 205 post:
DHR’s adjusted diluted earnings forecast for FY2025 remains at $7.70 – $7.80. The share price, however, closed at $220.77 on October 20 which is well above my last purchase price of $188.30 and ~$197.40 at the time I published by July 23, 2025 post.
In the first 9 months of FY2025, DHR has generated diluted EPS and adjusted diluted EPS of $3.37 and $5.57. In essence, DHR needs to generate ~$2.18 of adjusted diluted EPS in Q4 to reach the $7.75 mid-point of management’s FY2025 outlook.
Using the current $220.77 share price and the currently available broker adjusted diluted EPS estimates, the forward adjusted diluted PE levels are:
- FY2025 – 23 brokers – mean of $7.73 and low/high of $7.67 – $7.86. Using the mean, the forward adjusted diluted PE was ~28.6.
- FY2026 – 23 brokers – mean of $8.42 and low/high of $8.30 – $8.72. Using the mean, the forward adjusted diluted PE was ~26.2.
- FY2027 – 16 brokers – mean of $9.29 and low/high of $8.99 – $9.61. Using the mean, the forward adjusted diluted PE was ~23.8.
- FY2028 – 7 brokers – mean of $10.28 and low/high of $9.62 – $10.78. Using the mean, the forward adjusted diluted PE was ~21.5.
In the first 9 months of FY2025, DHR’s FCF/share is $4.909 and $4.581 (see table above) calculated using the conventional and the modified methods.
If it generates 33.3% of YTD2025 FCF in Q4, its FY2025 FCF calculated using the conventional and modified methods, should be ~$6.55 and ~$6.11. Erring on the side of caution, I use ~$6.50 and ~$6.06 to estimate DHR’s forward P/FCF.
Using the current $220.77 share price, the forward P/FCF is ~34 and ~36.4 using FCF calculated using the conventional and modified methods. These levels are slightly higher than at the time of my prior post.
I reflected the following in my July 23, 205 post:
In Q1, DHR generated diluted and adjusted diluted EPS of $1.32 and $1.88. In Q2, it generated diluted and adjusted diluted EPS of $0.77 and $1.80. YTD2025 diluted and adjusted diluted EPS total $2.09 and $3.68. If it generates similar diluted and adjusted diluted EPS in the second half of the year, FY2025 diluted and adjusted diluted EPS could be ~$4.18 and ~$7.36.
Management’s revised adjusted diluted earnings forecast for FY2025, however, is $7.70 – $7.80 versus previous guidance of $7.60 – $7.75. Using my recent $188.30 purchase price, the forward adjusted diluted PE range is ~24.1 – ~24.45.
With shares currently trading at ~$197.40, the forward adjusted diluted PE range is ~25.3 – ~25.64.
Using my recent $188.30 purchase price and the currently available broker earnings estimates, the forward adjusted diluted PE levels are:
- FY2025 – 26 brokers – mean of $7.76 and low/high of $7.65 – $7.90. Using the mean, the forward adjusted diluted PE was ~24.3.
- FY2026 – 25 brokers – mean of $8.59 and low/high of $8.32 – $9.00. Using the mean, the forward adjusted diluted PE was ~22.
- FY2027 – 17 brokers – mean of $9.51 and low/high of $9.05 – $10.15. Using the mean, the forward adjusted diluted PE was ~20.
- FY2028 – 8 brokers – mean of $10.61 and low/high of $10.20 – $11.55. Using the mean, the forward adjusted diluted PE was ~17.7.
The valuation is slightly higher if we use the current ~$197.40 share price.
These estimates are likely to change over the coming days since results have just been released.
For comparison, the following are my valuation estimates in my April 25, 2025 post. I used the current broker guidance and the April 24 closing share price of ~$196.50.
- FY2025 – 26 brokers – mean of $7.70 and low/high of $7.60 – $7.83. Using the mean, the forward adjusted diluted PE is ~25.5.
- FY2026 – 25 brokers – mean of $8.56 and low/high of $8.21 – $8.85. Using the mean, the forward adjusted diluted PE is ~23.
- FY2027 – 18 brokers – mean of $9.47 and low/high of $8.95 – $10.15. Using the mean, the forward adjusted diluted PE is ~20.7.
- FY2028 – 8 brokers – mean of $10.60 and low/high of $10.06 – $11.55. Using the mean, the forward adjusted diluted PE is ~18.5.
I place no credence in the FY2026 – FY2028 estimates as much can change over the next few years.
Earnings are subject to manipulation, and therefore, I prefer to value a company using free cash flow. Given that I rely on the more conservative modified FCF calculation method, my P/FCF estimates are higher than results calculated using the conventional method. The disparity between the conventional and modified calculations become increasingly pronounced the greater the SBC component.
In the first half of FY2025, DHR’s FCF/share is $2.99 and $2.78 (see table above) calculated using the conventional and the modified methods.
Given the current business environment, I anticipate that DHR’s FCF in the second half of FY2025 will be similar to the first half of the year. I, therefore, estimate that DHR’s FY2025 conventional and modified FCF/share will be ~$5.99 and ~$5.56. Using my recent $188.30 purchase price, my DHR forward P/FCF estimates are ~31.4 and ~33.9. With shares currently trading at ~$197.40, the forward P/FCF estimates increase to ~33 and ~35.5.
Final Thoughts
DHR has certainly tested investor patience in recent years. I have chosen, however, to be extremely patient with my DHR investment and to periodically acquire additional shares on weakness. My rationale for doing so is that the company has exited lower margin and slower growth businesses to focus on higher margin and faster growing businesses. This takes time but once completed, DHR’s performance should vastly improve.
DHR continues to have a wide moat related to intangible assets (ie. trademarks, brands, patents, copyrights) in its differentiated technology. There are also substantial customer switching costs which ‘locks in’ customers.
Management expects revenue growth to accelerate to the high single digits from 3% – 6% expected in 2026. Adjusted diluted EPS is also projected to grow in the low double digits over the long term.
I anticipate growth in R&D budgets and ongoing demand for biopharma and diagnostic products. The potential return of biopharmaceutical production to the US could also increase demand for DHR’s life
science tools.
I typically place no/very little reliance on brokers’ earnings estimates beyond the next 4 quarters. Because of its highly acquisitive nature, trying to estimate DHR’s results well into the future is a ‘guessing game’.
DHR has positioned itself to have ‘fire power’ to take advantage of a ‘more constructive’ M&A environment. An acquisition announcement within the next few months is, therefore, a very real possibility.
As explained earlier, DHR’s low ROIC metric is misleading. This is why making investment decisions based solely/primarily on data derived from stock screeners is ill-advised.
At the end of January 2026, my DHR exposure is 904.11874 shares in a ‘Core’ account in the FFJ Portfolio. Although DHR’s fair value appears to be ~$240 – ~$260, I have no immediate plans to add to my exposure.
I wish you much success on your journey to financial freedom!
Note: Please send any feedback, corrections, or questions to finfreejourney@gmail.com.
Disclosure: I am long DHR.
Disclaimer: I do not know your circumstances and do not provide individualized advice or recommendations. I encourage you to make investment decisions by conducting your research and due diligence. Consult your financial advisor about your specific situation.
I wrote this article myself and it expresses my own opinions. I do not receive compensation for it and have no business relationship with any company mentioned in this article.