![]()
I consider West Pharmaceutical (WST) to be the silent winner of the GLP-1 obesity drug boom. Novo Nordisk (NVO) and Eli Lilly (LLY) may grab the headlines. WST, however, is the ‘picks and shovels’ play in this space.
I last reviewed WST in this October 24, 2025 post at which time the share price had risen to ~$307.25 (up from ~$188 in early April). I deemed shares to be overvalued. Almost immediately after publishing that post, WST’s share price promptly proceeded to head lower. At the February 12, 2026 market close, WST’s share price is $243.61.
Now that we have WST’s Q4 and FY2025 results and Q1 and FY2026 outlook I revisit this existing holding.
Business Overview
Refer to the company’s website and the FY2024 Form 10-K and Q4 2025 Form 8-K.
Financials
Q4 and FYE2025 Results
In addition to the SEC Filings, I recommend reviewing the Q4 2025 Earnings Presentation.
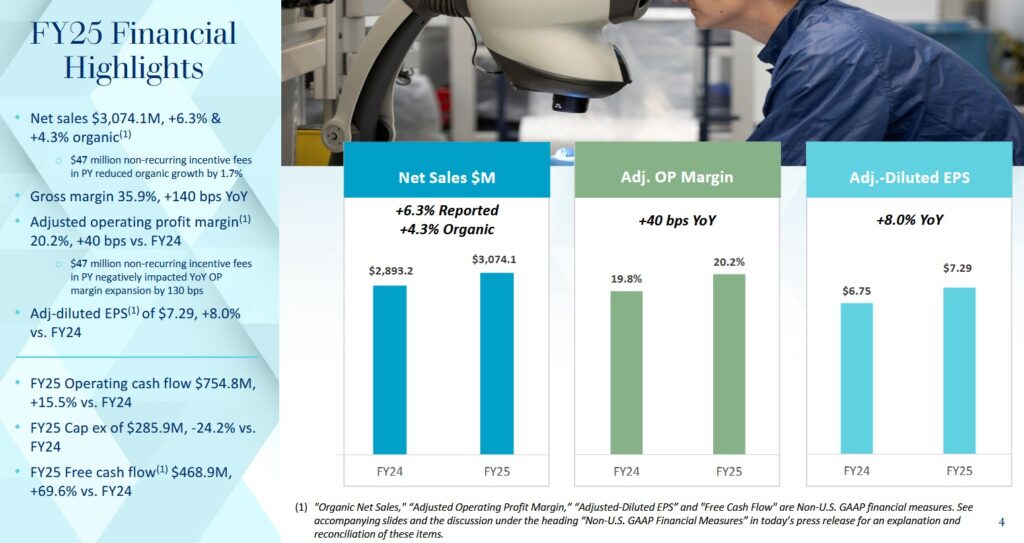
WST’s February 12, 2026 Q4 2025 earnings call was defined by a strong ‘beat and raise’ narrative. Improving results is being driven by the explosive demand for GLP-1 (obesity/diabetes) components and a successful recovery from previous destocking headwinds.
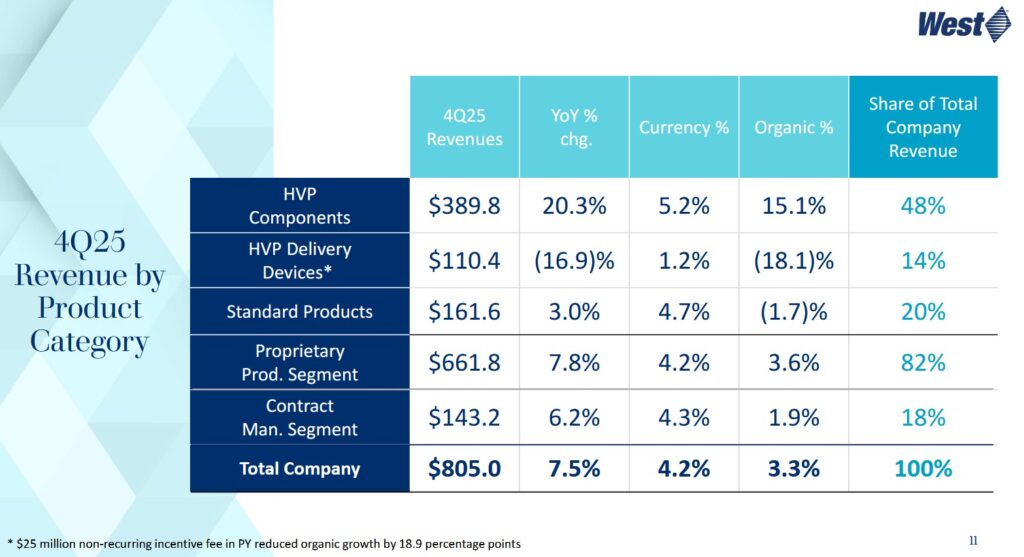
GLP-1 related products (elastomers and delivery devices) now account for ~17% of total net sales. High-Value Product (HVP) components, the company’s highest-margin category, grew ~15.1% organically in Q4, fueled by the demand for specialized plungers and seals for injectable obesity drugs.
Management noted a significant uptick in ‘Annex 1’ related projects. New EU regulatory requirements for sterile drug manufacturing are forcing pharma companies to upgrade from standard components to West’s HVP offerings (like Westar and Envision), creating a multi-year growth runway.
Annex 1 related projects are initiatives that pharma/biotech manufacturers run to comply with the revised European Union GMP Annex 1. EU GMP Annex 1 sets detailed GMP requirements for sterile medicinal products, covering design and control of facilities, equipment, systems, and procedures to avoid microbial, particulate, and pyrogen contamination.
It applies to finished sterile products, sterile active substances, relevant packaging, and any technology or scale used to achieve sterility.
Annex 1‑related projects are generally:
- Gap assessments and remediation plans
- Facility and HVAC upgrades
- Barrier technology implementation
- Contamination Control Strategy (CCS)
- Cleaning, disinfection, and residue management
- Process and sterilization changes
- Environmental and process monitoring enhancements
- Documentation, validation, and training
Many firms run Annex 1 programs as multi‑year, multi‑workstream projects with distinct phases:
- initial assessment;
- detailed design;
- implementation (facility/equipment changes, qualification); and
- ongoing performance verification.
Deliverables typically include a site‑level remediation plan, updated CCS, revised validation master plans, and evidence of successful media fills and environmental and process monitoring of the performance under the new expectations.
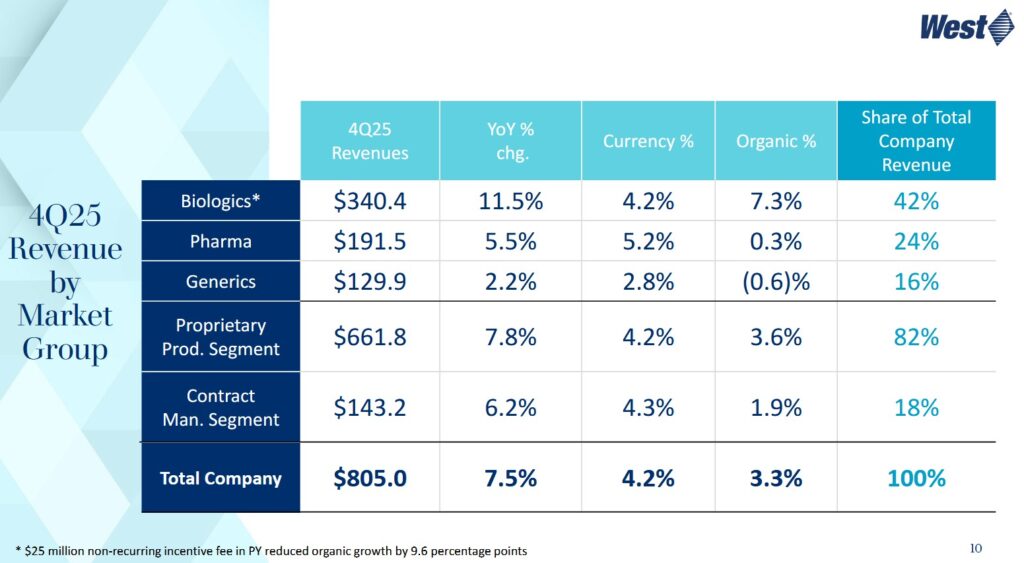
The broader Biologics unit (which includes biosimilars) grew 11.5%. This signals that WST’s recovery is broad-based and not just dependent on a single drug class (ie. GLP-1).
Conventional And Modified Free Cash Flow (FCF) Calculations (FY2019 – FY2025)
FCF is a non-GAAP measure, and therefore, the manner in which it is calculated is inconsistent. Many investors deduct CAPEX from OCF to arrive at FCF. In my How Stock Based Compensation Distorts Free Cash Flow post, I explain why I now also deduct stock based compensation (SBC) that is found in the Consolidated Statements of Cash Flows to determine FCF.
The following table reflects WST’s FCF without/with the deduction of SBC.
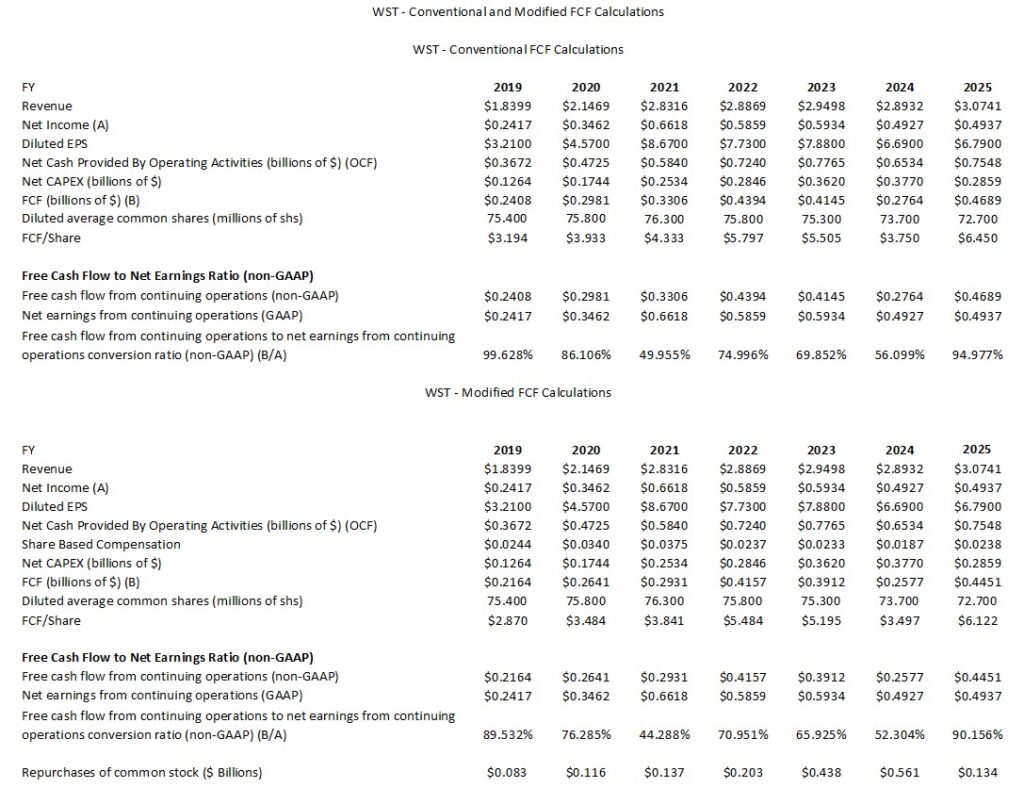
WST’s CAPEX/Sales ratio was ~7%, ~8%, ~9%, ~10%, ~12.3%, ~13%, and ~9.3% of annual revenue in FY2019 – FY2025. WST has been investing heavily in recent years to expand its manufacturing facilities and upgrade equipment to meet rising global demand for proprietary, high-margin drug containment and delivery components. The expansion particularly supports the fast-growing biologics and GLP-1 (glucagon-like peptide-1) markets, which require advanced, high-quality packaging solutions. Examples of these expansion initiatives include the buildout of new manufacturing plants and the addition of state-of-the-art production lines in the U.S. and Europe.
On the Q4 2025 earnings call, management states:
Capital expenditures for the year of $0.286B are down $91 million YoY, and we expect another step down in 2026 to a range of $0.25B – $0.275B as we move back to the construct of spending 6% – 8% of sales in CAPEX.
This CAPEX normalization is because the company’s CAPEX in previous years has put it in a strong position. The company is now moving into a ‘harvest period’.
Q1 and FY2026 Guidance
The following reflects WST’s current guidance.
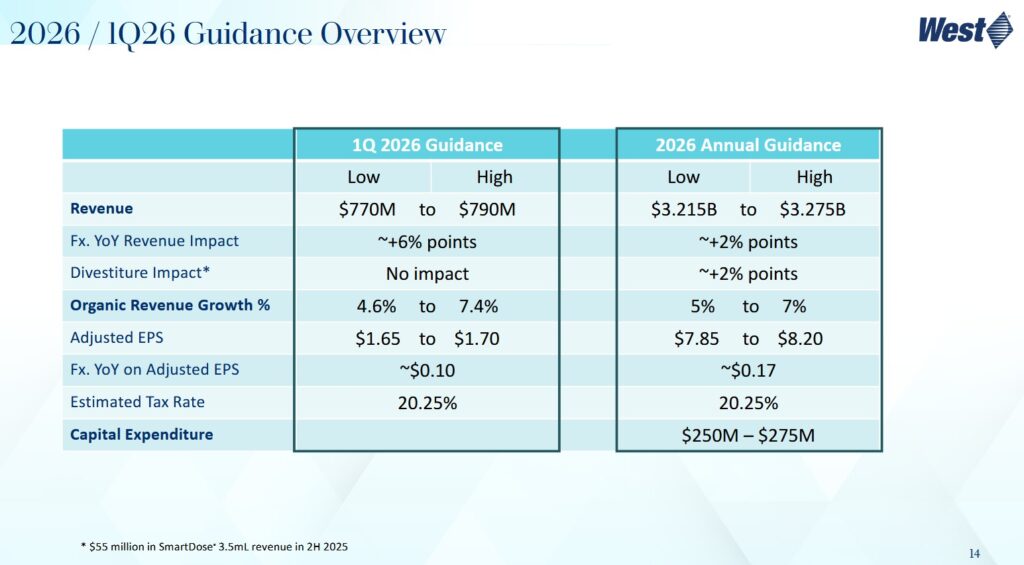
WST’s guidance anticipates the injectable market to continue to improve throughout 2026. The expectation is that the tariff landscape will remain at the current levels globally.
Since WST’s end markets remain dynamic and there could be a range of outcomes, it is being prudent with its forecasts.
In January 2026, WST announced that it had reached a definitive agreement to sell all manufacturing and supply rights for SmartDose® 3.5mL On-Body Delivery System and associated facilities to AbbVie (ABBV) for total consideration of $112.5 million at close, subject to working capital and other adjustments. This sale allows WST to exit a lower-margin, capital-intensive manufacturing area and focus on its core high-margin component business.
The definitive agreement, which is subject to certain closing conditions, is expected to close in mid-2026. This line of business generated $55 million in SmartDose sales in the second half of 2025 and WST has adjusted its FY2026 expected organic revenue growth to account for this loss of revenue.
Management expects HVP components to be the primary driver of WST’s revenue growth. The expectation is for this segment to grow high single digit to low double digits organically for the year, accounting for just over 5 points of total company growth at the midpoint of guidance.
WST expects to expand margins over 100 bps, with margins increasing over the course of the year, driven by HVP components and the SmartDose divestiture. Management is confident in continued gross margin expansion, citing a 130 bps improvement in Q4 2025 alone.
Adjusted diluted EPS is forecast to be $7.85 – $8.20, representing double-digit growth at the midpoint.
WST’s assumptions include ~$10 million in net interest income, a 20.25% tax rate for the full year, and 72.7 million diluted shares outstanding for the full year.
ROIC and WACC
Return on Invested Capital (ROIC) provides an indication of a company’s efficiency. In essence, is a company actually creating value or ‘burning’ cash for the sake of growth?
A company with a higher ROIC is mathematically worth more because it requires less reinvestment to achieve that growth.
A good indication of how well a company is performing is to compare ROIC to the Weighted Average Cost of Capital (WACC). WACC, however, is not a metric officially reported by WST but it can be roughly estimated based on the company’s credit profile and market conditions.
The generally accepted high-level formula used by Wall Street is:
ROIC = NOPAT/Average Invested Capital
with the Net Operating Profit After Tax (NOPAT) formula being Operating Income (EBIT) x (1-tax rate)
This shows how much profit the core business makes while ignoring how much debt the company has.
The Average Invested Capital is the total money tied up in the business.
- The Operating Approach formula is
- The Financing Approach is
One shortcoming with ROIC is that it is a non-GAAP metric meaning the input data plugged into the ROIC formula is inconsistent.
During the FY2019 – FY2025 period, WST has demonstrated exceptional capital efficiency by consistently maintaining a significant ‘spread’ between its ROIC and WACC. The data reveals a company that transitioned from a steady grower to a high-performance ‘pandemic winner’ followed by a stabilization phase as it pivoted toward the booming GLP-1 (obesity/diabetes) market.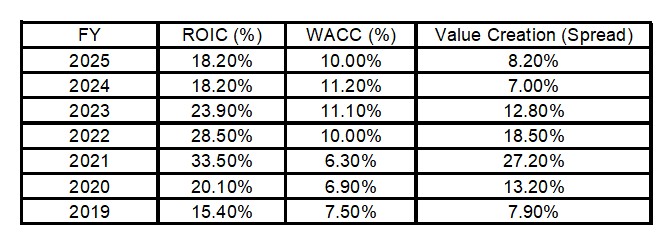 During the COVID pandemic (2020 – 2021), WST’s ROIC surged because of extraordinary demand for vaccine components. During this time, WST benefited from high ‘asset turnover’ and massive operating leverage. Meanwhile, WACC was at historical lows due to the low-interest-rate environment and a soaring stock price that lowered the cost of equity.
In 2022 – 2024, the world moved past the pandemic and WST faced a period in which its customers were inventory destocking. This pressured ROIC at the same time as the US Federal Reserve’s rate hikes pushed WACC from ~6% to ~11%.
Its ROIC hit a multi-year low of ~18.2% as sales of COVID-related products vanished. Even at this low point, WST was still creating substantial value, with an ROIC well above its cost of capital.
In 2025, ROIC stabilized as the company successfully pivoted to High-Value Products (HVP) for GLP-1 drugs. The shift to HVP, which carries higher margins than standard components, has helped protect ROIC even as the company invests heavily in new capacity.
As interest rates began to plateau and the stock price recovered, WACC trended slightly lower to ~10%.
Risk Assessment
No rating agency rates WST’s debt. WST’s cash flow and balance sheet metrics, however, reflect a prudent use of debt.
The Form 10-K is currently unavailable, however, WST’s long-term debt was $202.8 million at FYE2025. This is relatively similar to WST’s long-term debt at the end of Q3 2025 (see below).
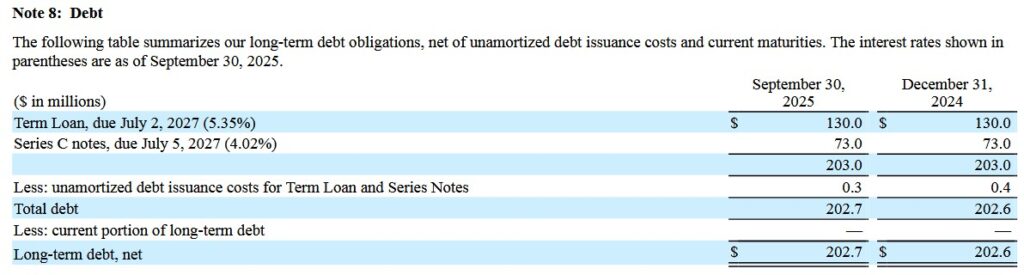
At September 30, 2025, the borrowing capacity available under WST’s $0.5B multi-currency revolving credit facility, including outstanding letters of credit of $2.3 million, was $497.7 million. This is likely very similar to FYE2025.
The debt agreements contain customary covenants, none of which management considers restrictive to business operations. At September 30, 2025, and undoubtedly at FYE2025, WST was in compliance with all debt covenants.
Dividends, Share Repurchases, and Stock Splits
Dividend and Dividend Yield
Looking at WST’s dividend history, we see that a WST investment is typically not made for dividend income. The majority of any possible total long-term investment return is likely to continue to be in the form of capital appreciation.
Share Repurchases
WST’s weighted average shares outstanding in FY2013 and Q3 2025 was (in millions of shares) 71.4 and 72.6.
In FY2022 – FY2025, WST repurchased $202.8, $438.3, $560.9, and $134.0 million of its outstanding shares. It repurchased no shares in Q4 2025, and therefore, I reflect below what is extracted from the Q3 2025 Form 10-Q.
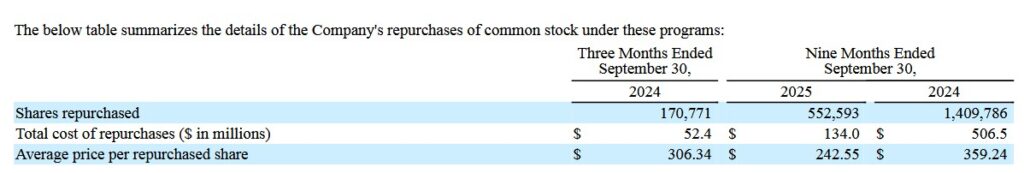
WST repurchased ~$561 million in shares during 2024 to take advantage of a lower stock price. The 2025 share repurchases were more measured at $134 million as WST redirected more capital toward HVP (High-Value Product) capacity expansion to meet GLP-1 demand.
On the Q4 2025 earnings call, management’s response to an inquiry about share repurchases was:
Returning cash to shareholders is something that we’re actively discussing. I view that as upside to our, our plan. It’s one of the beauties of this business is that we’ve got, a tremendous cash flow business here, and, I just leave it at that.
The Board approved a share repurchase program in December 2024 under which WST was able to repurchase up to 550,000 shares of common stock on the open market or in privately-negotiated transactions. Completion of this program was during April 2025. I anticipate that WST’s Board will approve another share repurchase program within the next few months.
Stock Splits
WST initiated a 2-for-1 stock split in September 2013.
Valuation
At the February 12, 2026 market close, WST’s share price is $243.61.
Management’s FY2026 adjusted diluted EPS guidance is $7.85 – $8.20 thus giving us a forward adjusted diluted PE range of ~29.7 – ~31.
Using the currently available broker estimates, WST’s forward-adjusted diluted PE levels are:
- FY2026 – 17 brokers – a forward-adjusted diluted PE of ~31 using a mean of $7.88 and low/high of $7.39 – $8.38.
- FY2027 – 16 brokers – a forward-adjusted diluted PE of ~27.7 using a mean of $8.81 and low/high of $8.42 – $9.42.
- FY2028 – 10 brokers – a forward-adjusted diluted PE of ~24.3 using a mean of $10.03 and low/high of $9.25 – $10.72.
Revisions to these estimates are likely over the coming days given the recent earnings release.
The annual FCF conversion ratio is typically below 100% (see table in the Conventional And Modified Free Cash Flow (FCF) Calculations (FY2019 – FY2025)) section of this post. In addition, diluted EPS is generally lower than adjusted diluted EPS. If we try to gauge WST’s valuation on a FCF/diluted EPS basis, the P/FCF level will be well above the forward-adjusted diluted PE levels reflected above.
My assessment of WST’s valuation at the time of my October 24, 2025 post was:
In the first 9 months of FY2025, WST generated $4.97 and $5.25 of diluted EPS and adjusted diluted EPS. Management has revised its FY2025 adjusted EPS outlook to $7.06 – $7.11 ($7.085 mid-point) from $6.65 – $6.85 ($6.75 mid-point).
Using the current ~$307.25 share price, I estimate a forward adjusted diluted PE of ~43.4 ($307.25/$7.085).
Using the currently available broker estimates, WST’s forward-adjusted diluted PE levels are:
- FY2025 – 15 brokers – a forward-adjusted diluted PE of ~44.5 using a mean of $6.90 and low/high of $6.74 – $7.13.
- FY2026 – 15 brokers – a forward-adjusted diluted PE of ~40.7 using a mean of $7.55 and low/high of $6.77 – $8.21.
- FY2027 – 11 brokers – a forward-adjusted diluted PE of ~35.8 using a mean of $8.59 and low/high of $8.04 – $9.36.
Revisions to these estimates are likely over the coming days given the recent earnings release.
Management does not provide FCF guidance. We can, however, estimate FY2025 FCF. In the first 3 quarters of FY2025, WST reports $0.2937B and $0.2766B of FCF (conventional and modified calculation methods).
If it generates ~$0.6716B of OCF for the year ($0.5037B in the first 9 months) and we deduct FY2025 CAPEX guidance of ~$0.275B, we get ~$0.3966B of FCF (conventional calculation method).
In the first 9 months of FY2025, SBC was $17.1 million. Erring on the side of caution, I estimate SBC of ~$23 million for FY2025. Deduct this and we get ~$0.3943B of FCF (modified calculation method).
If the diluted weighted average shares outstanding for the year are 72.6 million, we get FCF/share values of ~$5.46 and ~$5.43. Divide the current ~$307.25 share price by these values and the P/FCF is ~56.3 and ~56.6. These are well in excess of the ~43.4 FY2025 forward-adjusted diluted PE estimate. This is not surprising given that WST’s FCF conversion ratio has been considerably under 100% the last few years.
For comparison, this is my valuation commentary in my July 25, 2025 post.
In the first half of FY2025, WST generated $3.05 and $3.29 of diluted EPS and adjusted diluted EPS. Management has revised its FY2025 adjusted EPS outlook to $6.65 – $6.85 from $6.15 – $6.35 ($6.25 mi-point).
Using the current ~$279 closing share price on July 24, I estimate an adjusted diluted PE of ~41.3 ($279/$6.75).
Using the currently available broker estimates, WST’s forward-adjusted diluted PE levels are:
- FY2025 – 14 brokers – a forward-adjusted diluted PE of ~43.5 using a mean of $6.41 and low/high of $6.24 – $6.81.
- FY2026 – 13 brokers – a forward-adjusted diluted PE of ~38.5 using a mean of $7.25 and low/high of $6.75 – $7.67.
- FY2027 – 7 brokers – a forward-adjusted diluted PE of ~33.3 using a mean of $8.39 and low/high of $7.41 – $9.36.
I envision adjustments to these estimates over the coming days.
Management does not provide FCF guidance. We can, however, estimate FY2025 FCF. In the first half of FY2025, WST generated $0.16B and $0.1513B of FCF calculated using the conventional and modified calculation methods.
If it generates ~$0.62B of OCF for the year ($0.3065B in the first half) and we deduct FY2025 CAPEX guidance of ~$0.275B, we get ~$0.345B of FCF (conventional calculation method).
In the first half of the year, SBC was $8.7 million. Erring on the side of caution, we can estimate SBC of ~$18 million for FY2025. Deduct this and we get ~$0.327B of FCF (modified calculation method).
If the diluted weighted average shares outstanding for the year are 72.8 million, we get FCF/share values of ~$4.74 and ~$4.50. Divide the current ~$279 share price by these values and the P/FCF is ~59 and ~62. These are well in excess of the FY2025 forward-adjusted diluted PE estimate (~41.3 and ~43.5). This is not surprising given that WST’s FCF conversion ratio has been considerably under 100% the last few years.
Final Thoughts
In both the California (1849) and Klondike (1897) gold rushes, the ‘picks and shovels’ strategy was a highly successful business model. Roughly 1% of miners struck it rich but the merchants who supplied the miners often built enduring fortunes.
Similarly, ~90+% of drugs in clinical trials fail. Even if a drug makes it to the point where it receives regulatory approval, this does not mean it will be highly profitable. In addition, drug patents face expiry at which time generic drugs can step into the picture.
WST is somewhat similar in that it focuses on the delivery and packaging infrastructure of the biotech world rather than the risky development of the drugs themselves.
The miners are biotech companies trying to find the next ‘blockbuster’ drug. These drugs, however, are useless unless they can be safely stored or injected. WST produces the stoppers, seals, and syringe components. Because of strict FDA regulations, drug makers can’t just swap these out so WST’s components. They are essentially a requirement and not an option.
When the gold ran out during the gold rushes, many miners went home broke. The merchants, however, had already diversified or built enough capital to move into other industries. In the case of WST, if a specific category of medicine (like a certain type of gene therapy) loses favor, it simply sells its delivery systems to the next big thing in medicine. Their ‘shovels’ work for cancer drugs, weight-loss shots (GLP-1s), and vaccines.
When I completed my 2025 Year-End Investment Holdings Review, shares were trading at ~$275 and WST was my 26th largest holding. On January 22, 2026, however, I acquired an additional 100 shares @ $248.6401 in a ‘Core’ account in the FFJ Portfolio bringing my exposure to 600 shares.
WST’s total rate of return has been less than impressive over the past 5 years. This, however, is because the 2020 COVID pandemic was a ‘blessing’ for WST. Furthermore, WST ramped up its annual CAPEX in recent years so as to properly position itself for long-term growth. The heavier than usual CAPEX period is now complete and I anticipate FCF will surge in the next few years. If this happens, I anticipate WST will fall back into investors’ good graces.
From WST’s CFO’s comments on the Q4 2025 earnings call, WST is actively reviewing share repurchases as as part of its capital allocation. If WST starts repurchasing shares, I want an improvement in the company’s valuation because the current valuation is approaching a ~$260 ‘fair value’.
I wish you much success on your journey to financial freedom!
Note: Please send any feedback, corrections, or questions to finfreejourney@gmail.com.
Disclosure: I am long WST.
Disclaimer: I do not know your circumstances and do not provide individualized advice or recommendations. I encourage you to make investment decisions by conducting your research and due diligence. Consult your financial advisor about your specific situation.
I wrote this article myself and it expresses my own opinions. I do not receive compensation for it and have no business relationship with any company mentioned in this article.