![]()
I last reviewed Intact Financial (IFC.to) in this October 20, 2025 post, at which time the Q3 and YTD2025 results (as of September 30, 2025) were the most current. In that post, I disclose the purchase of 100 shares @ $259.85 in a ‘Core’ account in the FFJ Portfolio.
On January 19, 2026, I increased my exposure with the purchase of 100 shares @ $263 in the same ‘Core’ account.
IFC is to hold its Q4 and FY2025 earnings call on February 11. I, therefore, I dispense with a review of the Q3 and YTD2025 results as of September 30, 2025. IFC’s Q3 and YTD2025 financial results are accessible here if you wish to review them.
Return On Invested Capital (ROIC)
I pay particularly close attention to a company’s ROIC over time because this metric indicates a company’s efficiency. In essence, how much profit is generated for every dollar invested in the company – is a company actually creating value or ‘burning’ cash for the sake of growth?
A company with a higher ROIC is mathematically worth more because it requires less reinvestment to achieve that growth.
The ROIC metric, however, is not pertinent to the evaluation of insurance companies. This is because the fundamental nature of their business makes the standard ROIC formula, which relies on a clear distinction between operating and financing activities, mathematically and conceptually misleading.
ROIC does not work for insurers for the following reasons:
- The ‘Capital’ is the Product
ROIC as a measurement tool is practical for companies in other sectors where ‘invested capital’ refers to the money spent on factories, equipment, and inventory. In the insurance sector, the ‘capital’ is largely a pool of cash (the float) used to pay future claims. ROIC tries to strip out ‘non-operating’ items like cash and debt. For an insurer, cash and investments ARE the operation. These cannot be separated without stripping away the core of how an insurance company makes money.
- Debt vs. Liabilities
ROIC treats ‘Debt’ as a financing choice made by management. In insurance, the largest ‘liabilities’ on the balance sheet are not, for example, bank loans. The largest liabilities are claims reserves (money owed to policyholders). ROIC would treat these reserves as ‘interest-free debt’ or would ignore these claims reserves entirely thus making the ‘invested capital’ denominator look artificially small. This would lead to nonsensical, sky-high return percentages that do not reflect actual performance.
- Operating Income (NOPAT) is Undefined
ROIC is calculated using Net Operating Profit After Tax (NOPAT). The problem is that NOPAT excludes interest income and interest expense. An insurance company’s profit, however, is a mix of underwriting (premiums minus claims) and investment income from their portfolio. To exclude interest income to find ‘operating’ profit requires an investor to ignore a massive portion of the insurer’s business model.
Preferred Metrics For Analysis Purposes
Since ROIC is not a useful metric to assess an insurance company, the following metrics are typically used to measure efficiency and value creation.
Return On Equity (ROE)
The formula is Net Income/Shareholder’s Equity.
Since leverage is a core part of an insurer’s model, these metrics are used to determine what the company earns on the actual capital owners have at risk.
Operating ROE (OROE)
The formula is Operating Earnings/Average Equity
This strips out volatile one-time items (like a massive hurricane or a stock market crash) to show the “run-rate” profitability of the core business.
Adjusted Return On Equity (AROE)
The formula is Adjusted Net Income/Adjusted Average Common Shareholders’ Equity.
AROE is a non-GAAP metric used to evaluate the core profitability of an insurance company by stripping out volatile, non-recurring, or non-operating items that impact the standard ROE calculation.
This metric allows investors to compare a year with heavy catastrophes or a market crash to a ‘normal’ year.
Most insurance executives are evaluated based on AROE/Operating ROE because they can control underwriting and expenses. They cannot, however, control stock market or interest rate behavior.
Combined Ratio
The formula is (Losses + Expenses)/Earned Premiums
This measures underwriting efficiency. A ratio under 100% means the company is profitable before even touching its investment portfolio.
Book Value Per Share (BVPS)
The formula is Total Equity/Shares Outstanding
For insurers, growth in BVPS (plus dividends) is the best proxy for long-term ‘total return’ to shareholders.
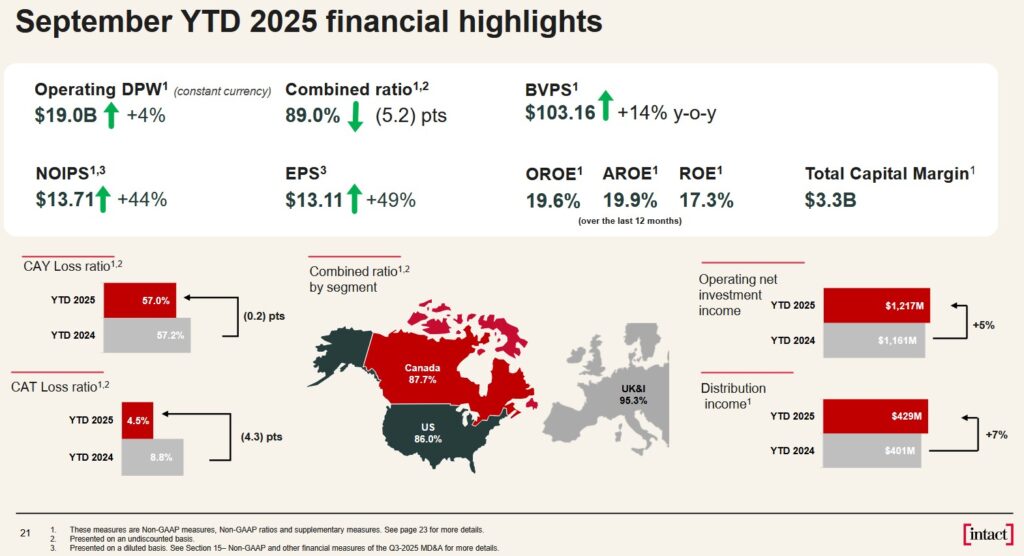
The following reflects IFC’s YTD2025 results for these metrics. These metrics should be reviewed and compared over a period of several years. My analysis of these metrics over the past decade reassure me that IFC is a worthwhile long-term investment.
Risk Assessment
My investor profile is such that I pay particularly close attention to the risk aspect of my investments.
The following is extracted from IFC’s Q3 2025 Earnings presentation.
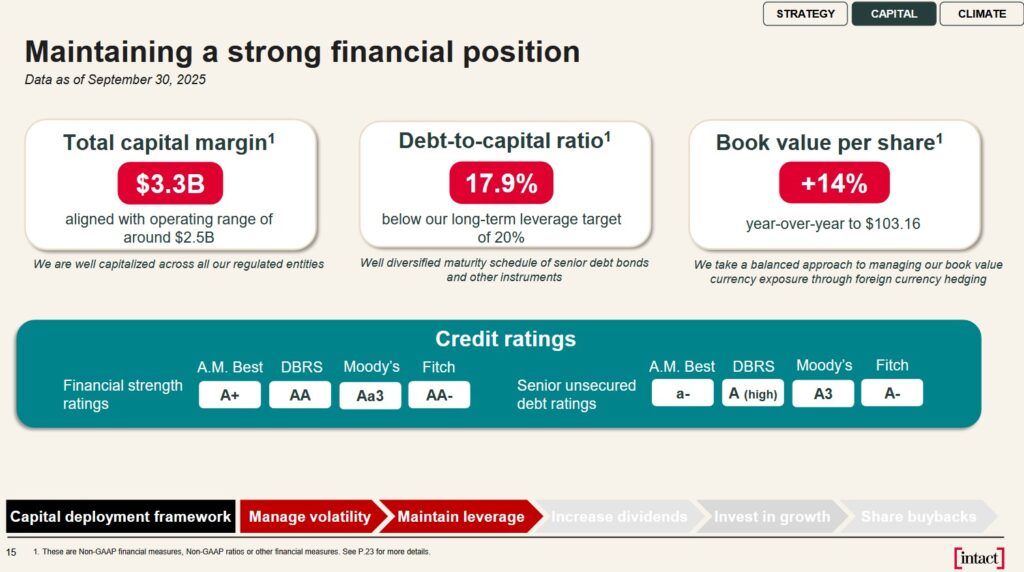
We see that IFC’s 17.9% debt-to-capital ratio at the end of Q3 2025 is below IFC’s conservative 20% long-term leverage target.
Credit rating agencies periodically err when evaluating a company’s risk. I do, however, compare their risk ratings relative to my assessment of a company’s risk.
As an equity investor, my risk exposure is greater than that of senior unsecured debt holders. While IFC’s current ratings classify this form of debt as ‘upper medium grade’ investment grade, I view my risk exposure as the upper tier of the lower medium grade investment grade category. At this level, I consider IFC to have adequate capacity to meet its financial commitments. Adverse economic conditions or changing circumstances, however, are more likely to lead to a weakened capacity of IFC to meet its financial commitments.
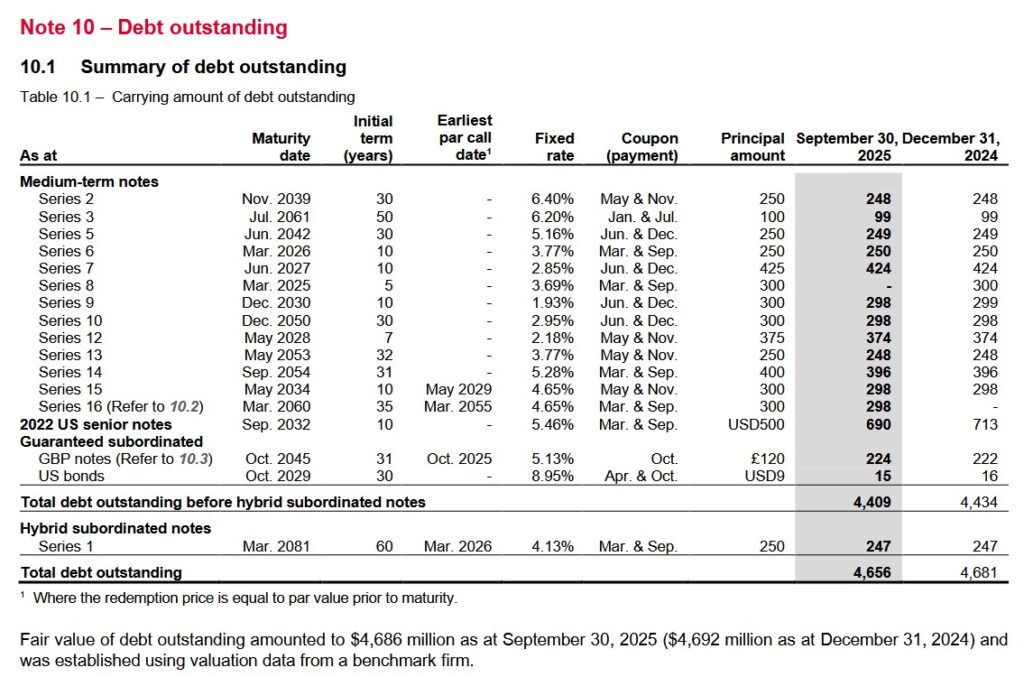
I also look at a company’s debt schedule where I can see the breakdown of a company’s long-term debt (eg. amounts, interest rates, maturities). Looking at the following schedule, we see that the maturity dates of IFC’s debt are well dispersed with ~$0.25B maturing in 2026, ~$0.424B in 2027, ~$0.374B in 2028, and ~$0.298B in 2030. IFC should easily be able to meet its obligations.
In a nutshell, I consider my risk exposure to be at a level where the probability is remote of getting a ‘sudden and nasty surprise’.
Dividends and Share Repurchases
The following is from IFC’s Q3 2025 earnings presentation.
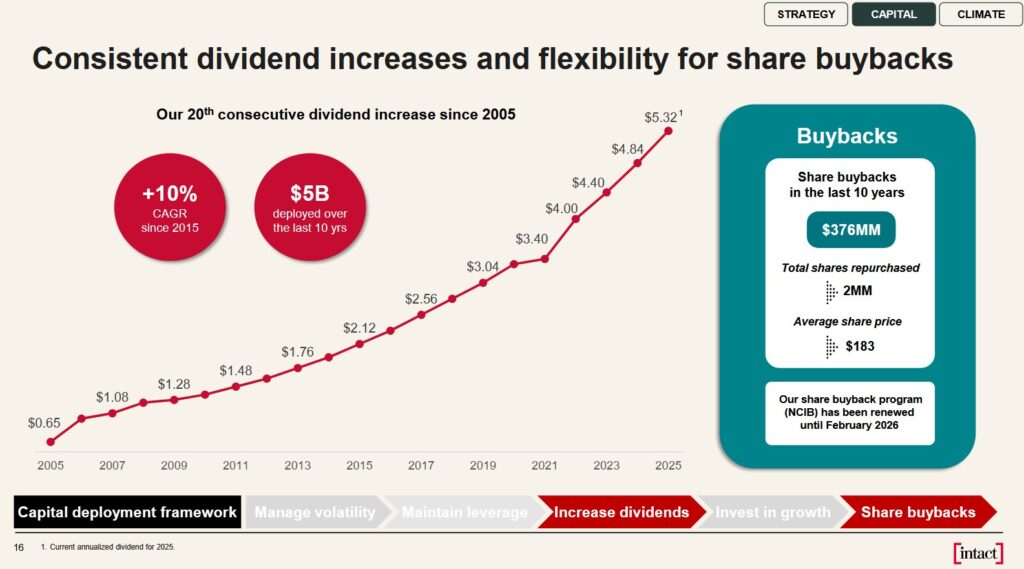
IFC distributed its 4th consecutive $1.33/share quarterly dividend on December 31, 2025. Looking at IFC’s dividend history, I anticipate that it will declare a ~$1.42 dividend when it releases its Q4 and FY2025 results in February.
Valuation
Using my ~$263 purchase price and current forward-adjusted diluted EPS broker estimates, the forward-adjusted diluted PE levels are:
- FY2025 – 13 brokers – mean of $18.34 and low/high of $18.04 – $18.90. The forward adjusted diluted PE is ~14.34.
- FY2026 – 13 brokers – mean of $17.49 and low/high of $16.79 – $18.04. The forward adjusted diluted PE is ~15.04.
- FY2027 – 11 brokers – mean of $18.68 and low/high of $17.33 – $19.76. The forward adjusted diluted PE is ~14.08.
At the time of my October 20, 2025 post, I used my ~$259.85 purchase price and current forward-adjusted diluted EPS broker estimates giving me the following forward-adjusted diluted PE levels:
- FY2025 – 13 brokers – mean of $17.65 and low/high of $16.70 – $18.56. The forward adjusted diluted PE is ~14.7.
- FY2026 – 13 brokers – mean of $17.35 and low/high of $16.70 – $17.90. The forward adjusted diluted PE is ~15.
- FY2027 – 8 brokers – mean of $18.64 and low/high of $17.71 – $19.29. The forward adjusted diluted PE is ~13.9.
Final Thoughts
My long-term outlook for the company is the same as that reflected in my July 30 post.
When I completed my 2025 Mid-Year Portfolio Review, IFC was my 28th largest holding. In my recent 2025 Year-End Investment Holdings Review, IFC had become my 24th largest holding. At the time of that review, IFC’s share price was CDN~$285.73.
I currently hold 307 shares in a ‘Core’ account and 624.4287 shares in another ‘Core’ account.
I wish you much success on your journey to financial freedom!
Note: Please send any feedback, corrections, or questions to finfreejourney@gmail.com.
Disclosure: I am long IFC.
Disclaimer: I do not know your circumstances and do not provide individualized advice or recommendations. I encourage you to make investment decisions by conducting your research and due diligence. Consult your financial advisor about your specific situation.
I wrote this article myself and it expresses my own opinions. I do not receive compensation for it and have no business relationship with any company mentioned in this article.