![]()
I last reviewed Mastercard (MA) in this November 3, 2024 post at which time the most currently available financial results were for Q3 and YTD2024. I, however, subsequently disclosed the purchase of additional shares in this April 7, 2025 post.
In my 2025 Year-End Investment Holdings Review I disclose that MA remains my second largest holding after Visa (V).
Within the first few days of January 2026, MA’s share price has pulled back ~5%-~6% following Trump’s proposal to cap credit card interest rates at 10%.
Whether this threat amounts to anything is subject to debate. Furthermore, financial institutions are the card issuers…not MA. MA does not dictate what rate(s) will be levied.
The financial industry has generally pushed against measures to limit interest rates, saying such actions would cut some consumers off from the credit option and force others to pay more through fees or alternative services. I suspect this pushback will likely continue, and therefore, think the probability of capping credit card interest rates is remote.
As a long-term investor, I welcome share price weakness. For the sake of full disclosure, I acquired an additional 45 shares @ ~$535.7467 in a ‘Core’ account in the FFJ Portfolio on January 13, 2026.
Business Overview
The best way to learn about MA is to review ‘Item 1. Business’ and ‘Item 1A. Risk Factors’ found at the beginning of MA’s FY2024 Form 10-K.
Financials
Q3 and YTD2025 Results
Refer to MA’s October 30, 2025 Earnings Release, Earnings Presentation, and Supplemental Materials that are accessible through the company’s website.
Conventional And Modified Free Cash Flow (FCF) Calculations (FY2019 – YTD2025 (9 Months))
FCF is a non-GAAP measure, and therefore, its method of calculation is open to debate. Most companies subtract capital expenditures (CAPEX) from Net Cash Provided by Operating Activities found in the Consolidated Statement of Cash Flows.
The ‘conventional’ calculations do not deduct share-based compensation (SBC) while the ‘modified’ calculations deduct SBC. In several prior posts, I touch upon why I deduct SBC when analyzing a company’s FCF.

Return On Invested Capital (ROIC)
High quality companies often generate a high ROIC. If a company generates a high ROIC, it needs to invest less to achieve a certain growth rate thus reducing the need for external capital.
When a company consistently generates a high ROIC over the long term and it is growing its revenue, it can reinvest a portion of its profits under favorable conditions thereby leading to a compounding effect. I would much rather invest in a growing company that can reinvest to create greater shareholder value than to invest in a company that has limited growth opportunities and thus chooses to distribute a growing dividend.
MA has consistently demonstrated some of the highest ROIC figures in the financial services industry, reflecting its asset-light business model and high operating margins.
Below is the ROIC performance for MA from FY2019 through Q3 FY2025.
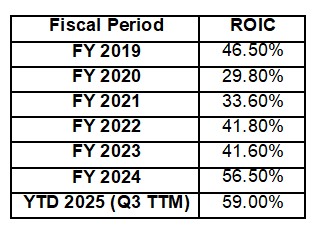
Note: The dip in FY2020 reflects the global impact of the COVID-19 pandemic on cross-border travel and consumer spending. The subsequent increase highlights the recovery and expansion into value-added services.
The key drivers in the recent growth of MA’s ROIC are:
- Value-Added Services: Revenue from services like cyber-security and data analytics grew by 22% in 2025, which carries high margins and requires little incremental capital.
- Operating Leverage: MA’s ability to process higher transaction volumes without a proportional increase in fixed costs continues to expand its return profile.
ROIC is generally calculated by dividing Net Operating Profit After Tax (NOPAT) by Invested Capital.
Calculation for Fiscal Year 2024
In FY2024 (FYE December 31, 2024), the calculation was driven by a significant increase in operating income.
ROIC=Average Invested Capital/NOPAT
- NOPAT (~$13.82B): Calculated as Operating Income ($15.58B) multiplied by (1 – Effective Tax Rate).
- Invested Capital (~$24.48B): Sum of average total debt and average shareholders’ equity over the period.
- Result: 56.5%
The YTD2025 calculation (end of Q3) uses Trailing Twelve Month (TTM).
- NOPAT (~$15.57B): Reflects the TTM operating profit through September 30, 2025, adjusted for the current tax rate (~19 – ~20%).
- Invested Capital (~$26.38B): Growth in invested capital is primarily driven by an increase in long-term debt used to fund share repurchases and acquisitions.
- Result: 59.0%
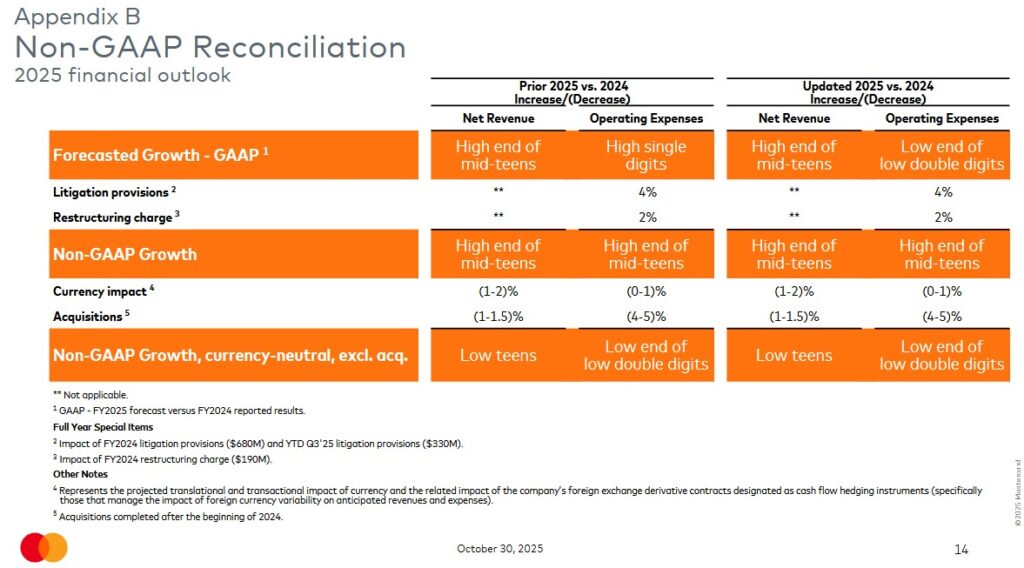
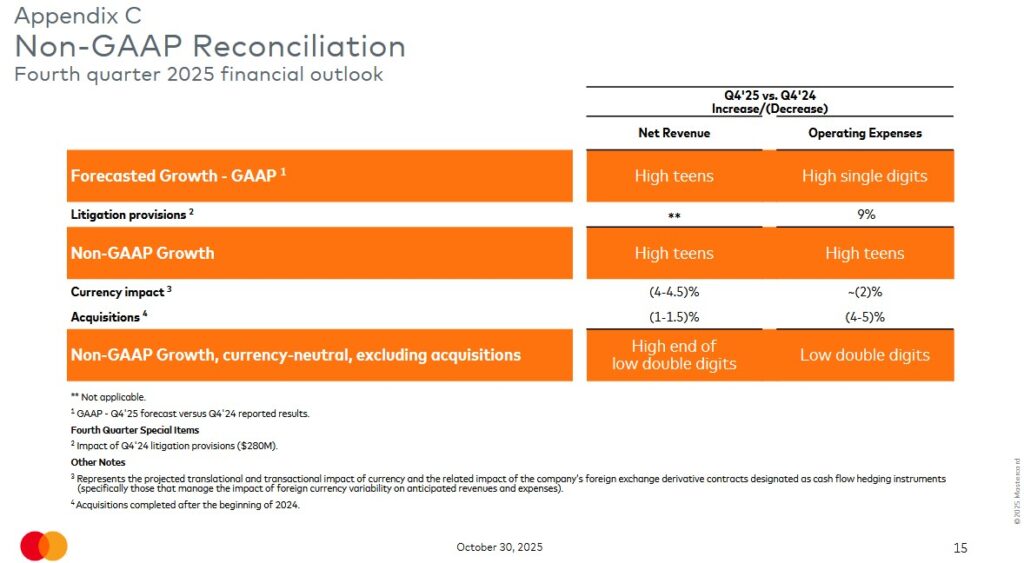
FY2025 and FY2026 Outlook
MA will issue its Q4 and FY2025 results and Q1 and FY2026 outlook within the next few weeks. Until such time, I provide MA’s Q4 and FY2025 outlook.
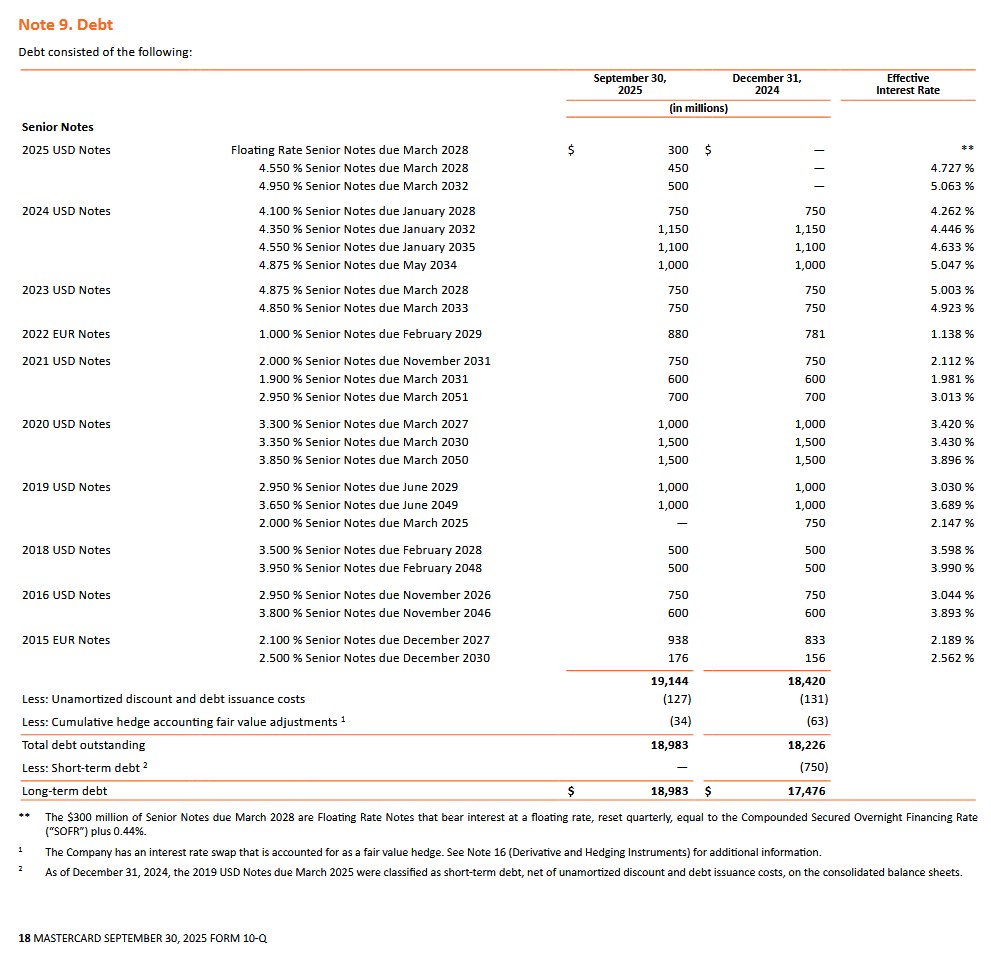
Risk Assessment
The following debt schedule is found on page 18 of 52 in MA’s Q3 Form 10-Q.
Moody’s currently assigns an Aa3 rating to MA’s senior unsecured long-term domestic debt; this rating was upgraded on November 16, 2022 from A1.
This rating is the lowest tier of the high-grade investment grade category. It defines MA as having a very strong capacity to meet its financial commitments; the rating differs from the highest-rated obligors only to a small degree.
S&P Global currently assigns an A+ rating to MA’s senior unsecured long-term domestic debt; this rating has been in effect since November 2018 and is one level below that assigned by Moody’s.
This rating is the highest tier of the upper-medium-grade investment grade category. It defines MA as having a strong capacity to meet its financial commitments. However, MA is somewhat more susceptible to the adverse effects of changes in circumstances and economic conditions than obligors in higher-rated categories.
MA’s credit risk suits my conservative investor profile.
Dividends and Share Repurchases
Dividend and Dividend Yield
MA distributes a quarterly dividend as evidenced by the dividend history. MA’s annual dividend yield has historically been under 1% and is likely to remain under 1% going forward.
The bulk of MA’s future total investment return is likely to be derived from capital appreciation.
Share Repurchases
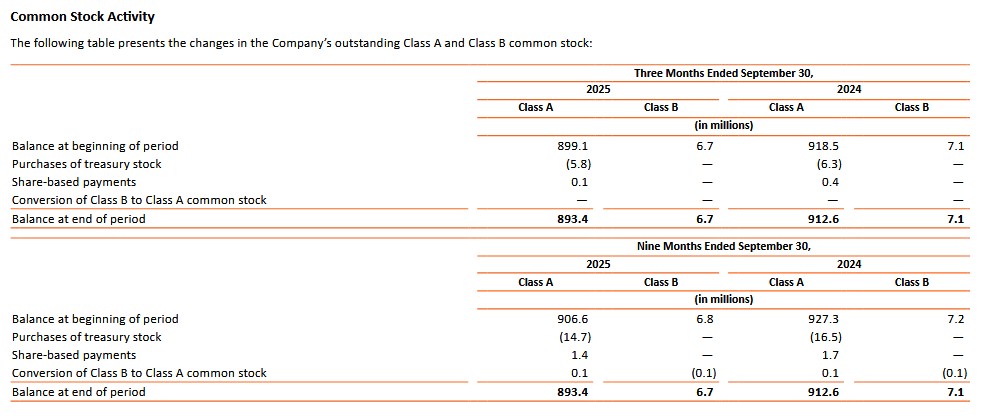
In FY2019, the weighted average number of Class A diluted common stock outstanding (in millions of shares) was 1,022. In the first 9 months of FY2025, it was 909 million and in Q3 2025 it was 905 million.
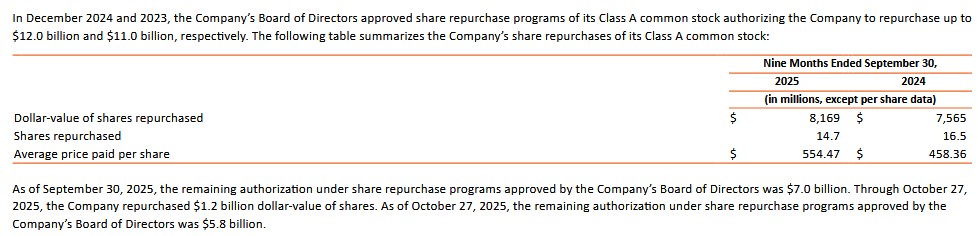
On December 9, 2025, MA announced that its Board of Directors had approved a new share repurchase program, authorizing the company to repurchase up to $14B of its Class A common stock. The new share repurchase program will become effective at the completion of the company’s previously announced $12B program that was announced in December 2024.
As of December 5, 2025, MA had ~$4.2B remaining under the current approved share repurchase program.
The following is found in MA’s Q3 2025 Form 10-Q.
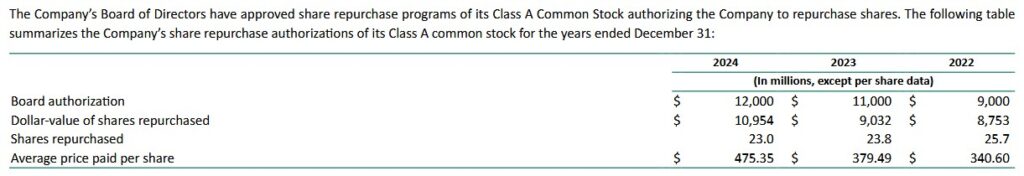
The following, provided for comparison, summarizes MA’s share repurchase authorizations of its Class A common stock for the years ended December 31 2022 – 2024.
Valuation
Using my January 13 ~$535.75 purchase price and the current adjusted diluted EPS broker guidance, we get:
- FY2025 – 34 brokers – mean of $16.50 and low/high of $16.29 – $16.69. Using the mean, the forward adjusted diluted PE is ~32.5.
- FY2026 – 34 brokers – mean of $19.15 and low/high of $18.79 – $19.67. Using the mean, the forward adjusted diluted PE is ~28.
- FY2027 – 28 brokers – mean of $22.28 and low/high of $21.67 – $22.92. Using the mean, the forward adjusted diluted PE is ~24.
Revisions to these estimates are likely following the forthcoming release of Q4 and FY2025 results.
MA has a new $14B share repurchase program. I, therefore, anticipate the weighted average diluted shares outstanding in FY2026 could be ~898 – ~900 million. MA’s annual share based compensation, on the other hand, will likely only be ~$0.52B.
Earnings are subject to distortion. Cash generated from normal business operations, however, is much more difficult to manipulate. I, therefore, like to gauge a company’s valuation based on my forward FCF estimates.
MA’s annual FCF/Net Earnings from continuing operations hovers around 100%. MA’s valuation based on P/FCF per share will, in my opinion, be roughly similar to the forward adjusted diluted PE for FY2025.
Final Thoughts
I currently hold 709 shares in ‘Core’ accounts and 300 shares in a ‘Side’ account in the FFJ Portfolio. Young investors I am helping on their journey to financial freedom also own MA shares. I do not, however, disclose details regarding their holdings.
As an investor with a very long-term investment time horizon (ie. beyond my lifespan), I view the current rhetoric from the Trump administration to be merely ‘noise’. Despite MA already being my 2nd largest holding, I plan to increase my exposure should there be further share price weakness.
I wish you much success on your journey to financial freedom!
Note: Please send any feedback, corrections, or questions to finfreejourney@gmail.com.
Disclosure: I am long MA.
Disclaimer: I do not know your circumstances and do not provide individualized advice or recommendations. I encourage you to make investment decisions by conducting your research and due diligence. Consult your financial advisor about your specific situation.
I wrote this article myself and it expresses my own opinions. I do not receive compensation for it and have no business relationship with any company mentioned in this article.