 I last reviewed Rollins (ROL) in this June 27, 2025 post in which I state:
Rollins (ROL) may not appeal to some investors because the nature of its business is not ‘sexy’. Sometimes, however, ‘ho hum’ businesses can offer investors the potential for very reasonable long-term total shareholder returns.
Through its family of brands, ROL provides pest control, termite services and wildlife removal to residential and commercial customers.
At the time, ROL’s Q1 2025 results were the most current.
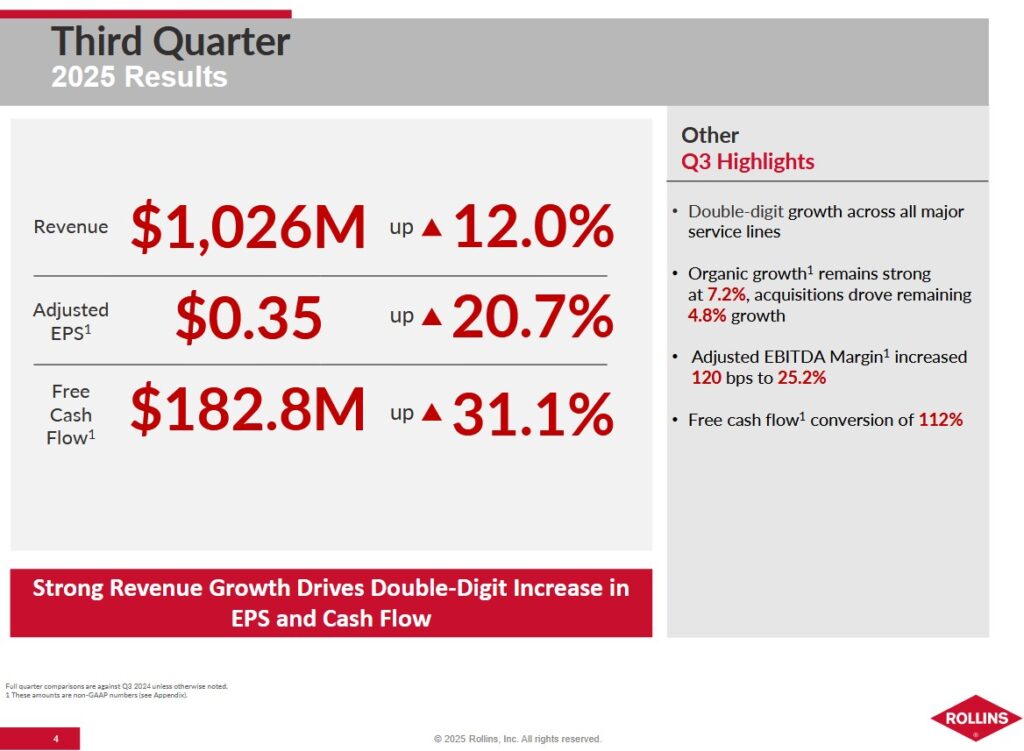
With the release of ROL’s Q3 and YTD2025 results on October 29, 2025, this is a good time to revisit this existing holding.
Business Overview
I reference my prior post in which I provide a high level business overview. The best way to learn about the company, however, is to review its website and Item 1 and 1-A in Part 1 in ROL’s FY2024 Form 10-K.
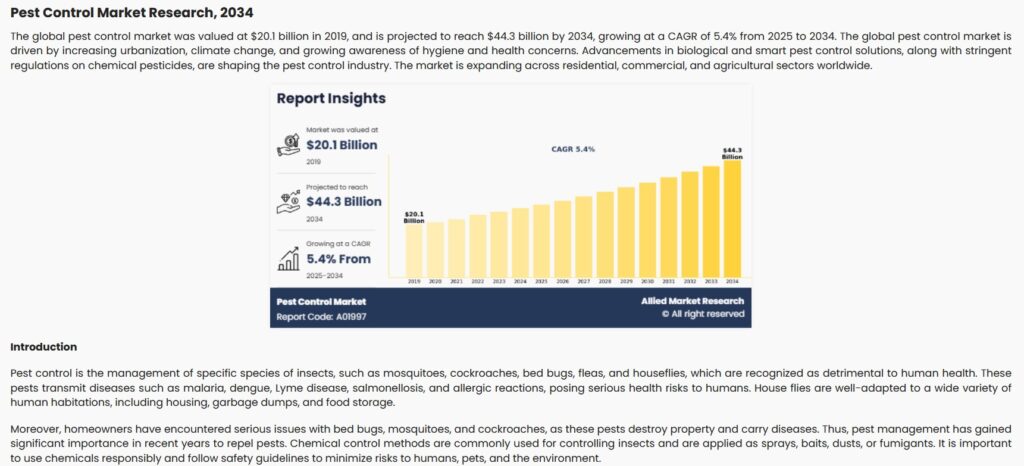
The pest control market’s growth trajectory in the US points toward robust expansion. While there are various projections, I reference Allied Market Research ‘Pest Control Market Research, 2023′ by Type (Chemical, Mechanical, Biological, Others), by Pest Type (Insects, Termites, Rodents, Mosquitoes, Birds, Wildlife, Others), by Application (Commercial, Residential, Agriculture, Industrial, Others): Global Opportunity Analysis and Industry Forecast, 2019-2034’. According to the report, the pest control market was valued at $20.1B in 2019 and is estimated to reach $44.3B by 2034.
According to Statista, the U.S. pest control industry was estimated to have a market value of over $24B in USD in 2023. This is a considerable increase from the market’s value of $14.3B USD in 2012. A city’s climate greatly influences how vulnerable it is to pest infestations. Cities in warmer regions face more cases of infestations from insects, as the warm climate allows them to live longer than they would in colder climates.
The industry is highly fragmented with some companies consisting of one vehicle and one technician. At the other end of the spectrum, we have companies such as ROL, Rentokil/Terminix, and Ecolab.
Statista’s analysis indicates there are over 34,000 pest control businesses in the US in 2025. This presents ROL with ample acquisition opportunities.
Profitability is heavily dependent on the number of service calls by pest control technicians. Route density, therefore, is critically important. It is far more logical for a technician to perform back to back service calls in a tight geographical area versus driving long distances between calls.
Reducing technician downtime is also critically important. ROL employs its Business Operations Support System (BOSS). This is a branch operating system in the form of a smartphone application that puts technology directly into the hands of the company’s pest control technicians. It enables them to improve efficiency and customer service by allowing them to:
- Take payments immediately via credit card.
- Provide customers with copies of service tickets digitally.
- Facilitate direct communication between customers and administrative staff for scheduling, billing, and other service-related queries.
BOSS is part of ROL’s broader suite of technology tools aimed at enhancing operational efficiency, improving customer satisfaction, and reducing costs. It supports the company’s technician workforce in the field, helping streamline both administrative and service delivery functions.
Financials
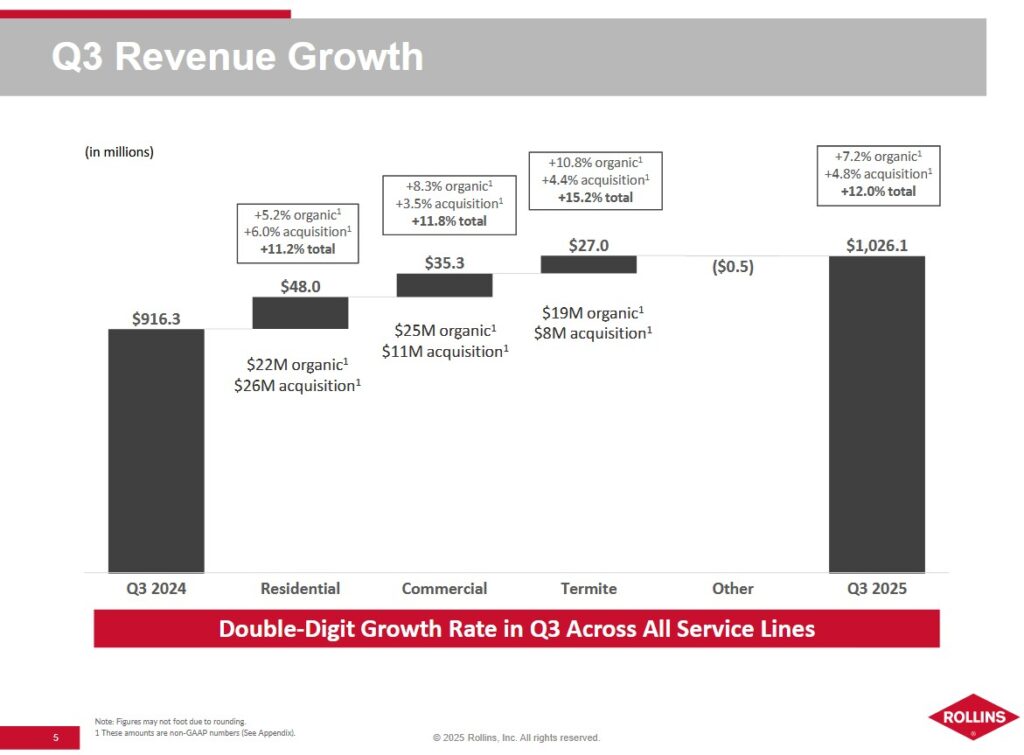
Q3 and YTD2025 Results
Material related to ROL’s Q3 and YTD2025 results is accessible here.
In some prior posts I express my reservation about relying on stock screeners to make investment decisions. Reading the SEC Filings is a far superior method by which to analyze a company.
ROL is a good example.
At the end of Q3 2025, ROL’s total current assets were ~$550.71 million and its total current liabilities were ~$712.8 million. Of the total current assets, ~$43.482 million were materials and supplies.
Dividing total current assets by total current liabilities leads to a 0.773 current ratio. Subtract materials and supplies from total current assets and then divide this amount by total current liabilities. This gives us a 0.71 quick ratio which is what stock screeners reflect. These ratios suggest ROL could experience short-term cash flow issues.
Within the company’s current liabilities at the end of Q3 2025, however, there is $200.215 million of unearned revenue reflected as a current liability. This unearned revenue represents funds received in advance from clients before ROL renders its services. As ROL renders services, it makes adjusting entries that include a reduction in unearned revenue.
The unearned revenue requires ROL to incur expenses to perform the contractual services before it can recognize this revenue as earned. ROL, however, will not be required to disburse $200.215 million.
When analyzing ROL’s liquidity, I exclude the unearned revenue to determine its current and quick ratios. In doing so, ROL’s current liabilities change to ~$512.629 million. This leads to the current ratio being ~1.07 and the quick ratio being ~0.99 ((~$550.71 – ~$43.482)/~$512.629).
Operating Cash Flow (OCF), Free Cash Flow (FCF), and CAPEX
FCF is a non-GAAP metric, and therefore, there is no standardization in it calculation. In the vast majority of instances where companies calculate FCF, there is no deduction of share based compensation (SBC). While I calculate a company’s FCF using the ‘conventional’ method where there is no SBC is deduction, I deem it prudent to calculate FCF using a ‘modified’ method. Under the ‘modified’ method, I deduct SBC. The deduction of SBC might not have a material impact on the FCF calculations where SBC is a relatively insignificant component of employee compensation. Where SBC is a significant component of employee compensation, however, the variance in the FCF results calculated using both methods can be very significant!
The following table reflects ROL’s FCF using the conventional method and the modified methods.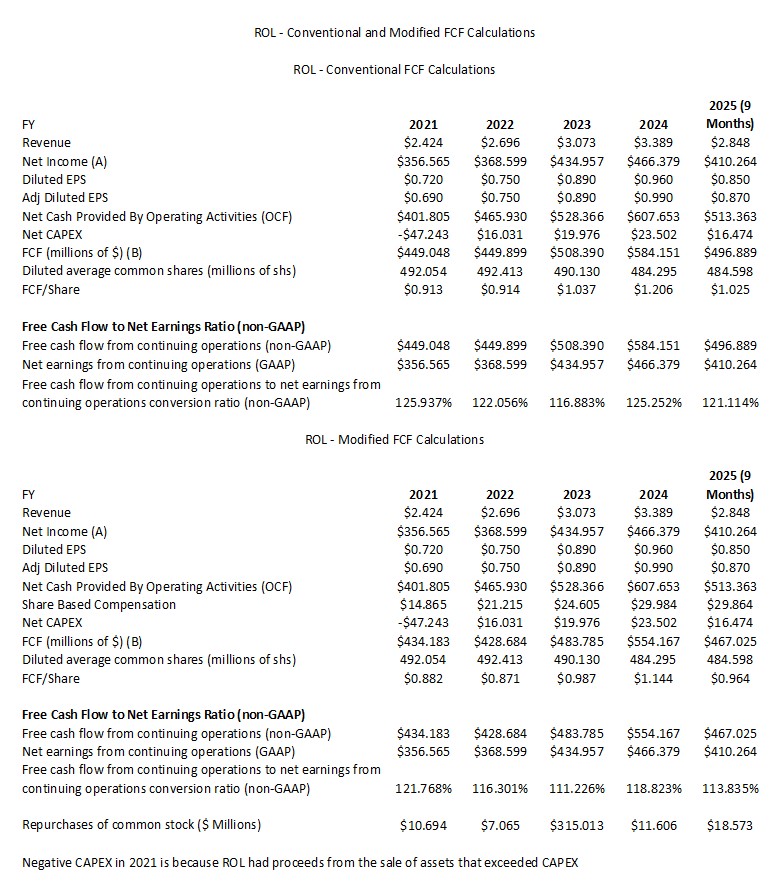
My FCF calculation using the conventional method differs slightly from that calculated by ROL. The difference is that I use NET CAPEX where I include the ‘Proceeds from sale of assets’. YTD2025, this amounts to $5.886 million.
Tariffs
ROL does not see a major issue with tariffs. ROL’s cost structure is primarily ‘people’. ‘Fleet and material’ (both being ~3% of sales) is the second biggest component of ROL’s cost structure where tariffs are not that much of an issue. Most of the materials ROL procures are made in the US. It is not reliant upon other geographic regions for its chemical requirements.
Capital Allocation
ROL’s priorities are to:
- reinvest in the business;
- grow the dividend; and
- repurchase shares.
FY2025 Guidance
ROL is now starting to provide guidance. It does not, however, provide diluted EPS or adjusted diluted EPS guidance.
On the Q3 earnings call, management states that ROL is aiming for 3 – 4% annual price increases. They believe this approach will continue to contribute positively to margins in 2026.
Risk Assessment
ROL has ~$0.486B of long-term debt. Note 7 – Debt in the Q3 2025 Form 10-Q reflects details of the senior notes that mature in 2035. The effective interest rate was 5.6% as of September 30, 2025.
There are no changes to ROL’s credit ratings subsequent to my February 14, 2025 post.
- Fitch: BBB+ long term issuer default rating. Initiated on February 13, 2025 and affirmed on March 21, 2025
- S&P Global: BBB local currency long term debt credit rating. Initiated on February 13, 2025.
Fitch’s rating is the top tier of the lower-medium grade investment grade category. S&P assigns a rating that is one tier lower. Both ratings define ROL as having an adequate capacity to meet its financial commitments. Adverse economic conditions or changing circumstances, however, are more likely to lead to a weakened capacity for ROL to meet its financial commitments.
Management is committed to maintaining a strong investment-grade rating with leverage well under 2x supported by healthy cash flow generation and disciplined capital allocation.
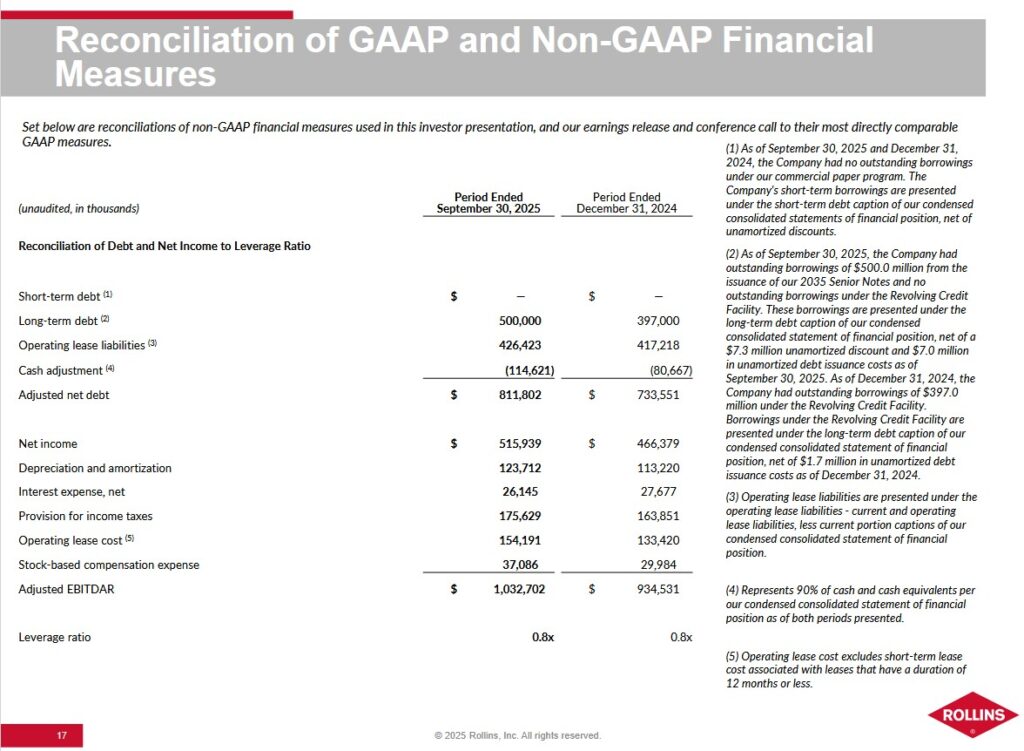
ROL’s leverage ratio is an assessment of overall liquidity, financial flexibility, and leverage. The calculation involves dividing adjusted net debt by adjusted EBITDAR (a non-GAAP metric).
- Adjusted net debt is calculated by adding operating lease liabilities to total long-term debt less a cash adjustment of 90% of cash and cash equivalents.
- Adjusted EBITDAR is calculated by adding back to net income depreciation and amortization, interest expense, net, provision for income taxes, operating lease cost, and stock-based compensation expense.
NOTE: Adjusted EBITDAR is Earnings Before Interest, Taxes, Depreciation, Amortization, and Restructuring or Rent costs. It is calculated by adding back to net income depreciation and amortization, interest expense, net, provision for income taxes, operating lease cost, and stock-based compensation expense. ROL’s management uses this ratio as an assessment of overall liquidity, financial flexibility, and leverage.
Dividends, Share Repurchases, and Stock Splits
Dividend and Dividend Yield
ROL’s dividend history is accessible here. ROL’s Board declared a ~11% increase to its regular quarterly cash dividend on its common stock of $0.1825/share payable December 10, 2025 to shareholders of record at the close of business on November 10, 2025. Focusing on dividend metrics is a fundamentally flawed way by which to assess a potential investment. It is preferable that we analyze an investment from potential total return (capital gains and dividends) and risk perspectives.
Share Repurchases
Reinvesting in the company (including mergers and acquisitions) and dividend distributions currently rank in priority to share repurchases from a capital allocation perspective.
Stock Splits
The 3-for-2 stock split in late 2020 is the most recent.
Valuation
The high amortization expense related to multiple acquisitions makes it impractical to value ROL using Earnings per Share (EPS). Depreciation and Amortization are significant components of the ‘Adjustments to reconcile net income to net cash provided by operating activities’ in the Consolidated Statement of Cash Flows.
In the first 3 quarters of FY2025, ROL generated $0.85 and $0.87 of diluted EPS and adjusted diluted EPS, respectively. If it produces ~$0.29 of adjusted diluted EPS in Q4 2025 (33.33% of YTD2025 adjusted diluted EPS), we should expect FY2025 adjusted diluted EPS to approach ~$1.16. Using the current ~$57.61 share price, the forward adjusted diluted PE is ~50.
Using the same share price and the current adjusted diluted EPS broker estimates, ROL’s current forward adjusted diluted PE levels are:
- FY2025 – 13 brokers – mean of $1.13 and low/high of $1.07 – $1.15. Using the mean, the forward adjusted diluted PE is ~51.
- FY2026 – 13 brokers – mean of $1.26 and low/high of $1.20 – $1.31. Using the mean, the forward adjusted diluted PE is ~45.7.
- FY2027 – 9 brokers – mean of $1.40 and low/high of $1.35 – $1.45. Using the mean, the forward adjusted diluted PE is ~41.15.
ROL’s FCF typically exceeds EPS and this is likely to continue.
The mean current adjusted diluted EPS broker estimate for FY2025 is ~$1.13; the variance between diluted EPS and adjusted diluted EPS is historically slim. If we use a ~1.14 FCF/EPS conversion ratio, ROL’s FY2025 FCF/share could be ~$1.29 ($1.13 x 1.14).
Divide $57.61 by $1.29 and the forward P/FCF is ~44.7. I continue to think a fair value is closer to the low $40s. At ~$43, the P/FCF ($43/$1.29) is ~33.3.
For comparison, this was my assessment of ROL’s valuation when I published my June 27, 2025 post:
The following are ROL’s current forward adjusted diluted PE levels using the current adjusted diluted EPS broker estimates and the current ~$55.81 share price:
- FY2025 – 12 brokers – mean of $1.11 and low/high of $1.06 – $1.14. Using the mean, the forward adjusted diluted PE is ~50.3.
- FY2026 – 12 brokers – mean of $1.25 and low/high of $1.16 – $1.30. Using the mean, the forward adjusted diluted PE is ~44.6.
- FY2027 – 9 brokers – mean of $1.39 and low/high of $1.27 – $1.47. Using the mean, the forward adjusted diluted PE is ~40.2.
My comments regarding ROL’s FCF consistently exceeding EPS remain the same. ROL reported a FCF conversion ratio of 133.1% in Q1 2025 (FCF of $140.111 million versus $105.248 million of net income). If we deduct SBC of $8.799 million, ROL’s Q1 FCF drops to $131.312. This is a ~124.76% FCF conversion ratio.
I previously estimated ROL’s FY2025 FCF conversion ratio may be ~111% when using the modified FCF calculation method. If the remaining 3 quarters in FY2025 are comparable to Q1, it is conceivable that the FCF conversion ratio could be closer to 120%. If this materializes, ROL’s FY2025 FCF/share could be ~$1.33 ($1.11 x 1.20) versus my previous ~$1.23 estimate.
Divide the current ~$55.81 share price by $1.33 and the forward P/FCF is ~42. This level is somewhat greater than my prior estimate. I think a fair value is closer to the low $40s. At ~$43, for example, the P/FCF ($43/$1.33) is ~32.3.
Final Thoughts
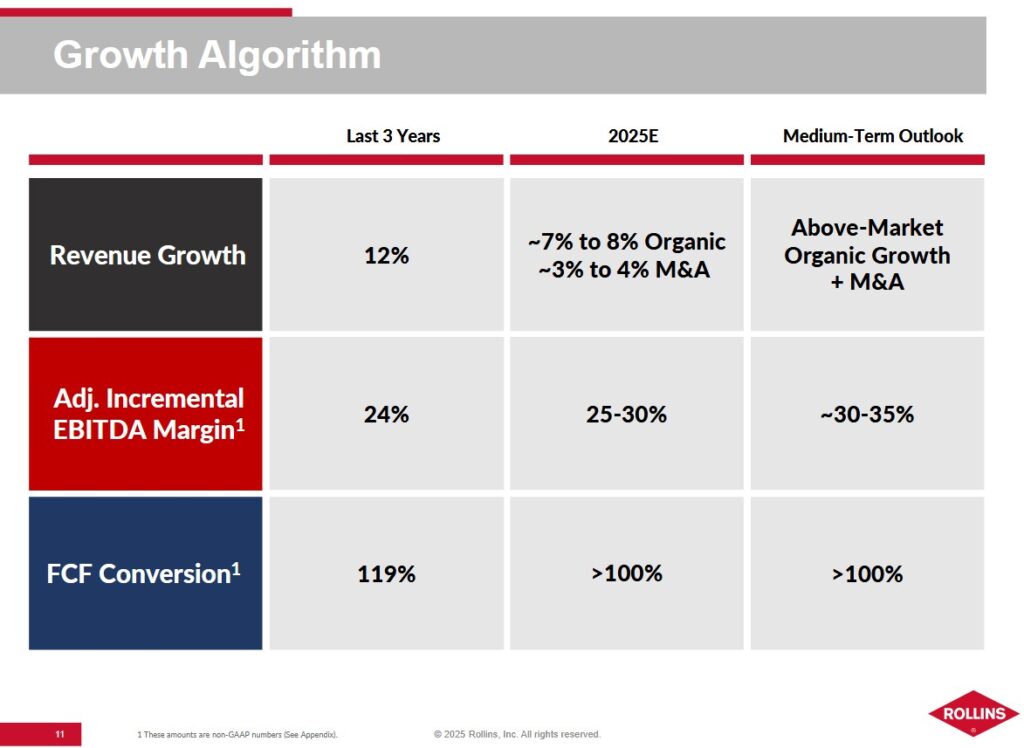
ROL combines leading brand recognition, scale advantages, and efficient cost-control initiatives. Looking at management’s growth algorithm (see above) I anticipate ROL will continue to deliver medium-term revenue growth.
Fortunately one of ROL’s largest competitors, Rentokil Initial plc (RTO), continues to face ongoing integration challenges following its acquisition of Terminix Global Holdings, Inc. in October 2022. This has led to weak short-term financial performance and operational efficiency.
Moody’s does not rate RTO but Fitch and S&P Global do.
- Fitch: BBB long term issuer default rating. Initiated on October 27, 2023 and most recently affirmed on September 19, 2025
- S&P Global: BBB long term issuer default rating. Most recently affirmed on June 18, 2025
Poor execution and poor employee and customer retention following the Terminix acquisition have negatively affected RTO’s lead generation and organic sales growth. Management states the full completion of the integration may not occur until the end of 2026.
Much like ROL, bolt-on acquisitions are a key component of RTO’s growth strategy; the firm completes 40-50 acquisitions yearly to bolster route density in its regional markets. It is critical that ROL and RTO increase route density because adding a new customer to an existing route incurs no additional fixed costs.
My final thoughts are the same as in my prior post.
I prefer to analyze ROL’s valuation from a FCF perspective versus EPS because of the significant annual depreciation and amortization.
We also need to consider in our analysis that:
- ROL is a leader in the highly fragmented pest control industry; and
- management plans to double the company’s revenue over the coming decade.
The following are some additional considerations.
- The pest control business is relatively steady;
- ROL focuses heavily on efficiency and cost control;
- The FCF conversion ratio is consistently above 100%;
- Management quality has improved considerably and the level of financial reporting continues to improve;
- Investment-grade corporate credit ratings now provide ROL with an important access point to the capital markets; and
- 75+% of business is recurring.
The pest control industry may not have the same appeal as some other ‘sexy’ industries. If you have a pest issue, however, you want a solution to your problem…quickly!
Climate change favors growth in the pest control industry. Without the efficient use of technology and route density, however, business can be challenging. It is essential to maximize the productive use of a technician’s time; traveling long distances between service calls is inefficient. Many smaller industry participants, however, do not have the resources to fund the implementation of the technology ROL uses.
In such a highly fragmented business, ROL has a long list of acquisition opportunities. Acquiring competitors such as the Saela acquisition in Q1 has become accretive to ROL’s results.
On the Q3 earnings call, management states the M&A pipeline remains strong. Despite increased competition from private equity, ROL continues to be an acquirer of choice due to its fair pricing and focus on employee integration.
ROL was not a top 30 holding when I completed my 2025 Mid-Year Portfolio Review and is unlikely to ever become a top 30 holding. Unless ROL’s valuation significantly improves, I intend to merely increase my exposure through the automatic reinvestment of dividend income.
I wish you much success on your journey to financial freedom!
Note: Please send any feedback, corrections, or questions to finfreejourney@gmail.com.
Disclosure: I am long ROL.
Disclaimer: I do not know your circumstances and do not provide individualized advice or recommendations. I encourage you to make investment decisions by conducting your research and due diligence. Consult your financial advisor about your specific situation.
I wrote this article myself and it expresses my own opinions. I do not receive compensation for it and have no business relationship with any company mentioned in this article.