 I last reviewed Thermo Fisher (TMO) in this July 24, 2025 post. In that post I express disappointment in the share price surge. The share price had risen to ~$475 at the July 24 market close yet as recently as July 7, 2025, I purchased 75 shares @ $421.9667 share in a ‘Core’ account in the FFJ Portfolio. Furthermore, in April 2025 I was purchasing shares in the ~$420 – ~$430 range. As I compose this post, however, TMO’s share price is ~$565.
This is an opportune time to revisit this existing holding given the October 22, 2025 release of Q3 and YTD2025 results and revised FY2025 outlook.
Business Overview
TMO has multiple brands (eg. Thermo Scientific, PPD, Patheon, Applied Biosystems, etc). I encourage you to access the websites of these brands to see the magnitude of TMO’s product offering. I also recommend reviewing the company’s website and Part 1, Item 1 in the FY2024 Form 10-K.
It is arguably the premier life science supplier. Its portfolio of products, resources, and manufacturing capabilities is unmatched thus enabling it to increase its ‘share of wallet’ across all channels.
A large portion of TMO’s business mix is consumables and services (~82% of sales) much of which is recurring business.
TMO’s annual revenue has grown from ~$17B in FY2015 to ~$43B in FY2024 and ~$32.3B in the 9 months of FY2025. Organic growth and several acquisitions have fueled this impressive growth. The company’s more notable acquisitions in recent years are accessible here. As I compose this post, this web page does not yet include the recent announcement of TMO’s planned acquisition of Clario Holdings.
TMO Completes The Solventum’s Purification and Filtration Business Acquisition
In my prior post I reflect the following:
On February 25, 2025, TMO announced that it had entered into a definitive agreement with Solventum (SOLV) to acquire Solventum’s Purification & Filtration business for ~$4.1B in cash; SOLV was spun off from 3M (MMM) on April 1, 2024.
When the acquisition was announced, the transaction was expected to be completed by the end of 2025.
In June 2025, TMO disclosed that it is no longer including Solventum’s drinking water filtration business in its plan to acquire the medical-device company’s filtration and purification segment. This revision reduces the cash consideration to $4B. Under the terms of the acquisition agreement, TMO will be entitled to receive up to $75 million from Solventum upon a sale of the water business or after an agreed-upon three-year period. According to Solventum, removing the water filtration business makes the deal less complicated and speeds up the timeline for closing the transaction, which was previously scheduled to happen by the end of 2025. This is disclosed in Solventum’s June 25, 2025 Form 8-K.
Once the transaction closes, SOLV’s Purification & Filtration business will become part of TMO’s Life Sciences Solutions segment.
On September 2, 2025, TMO announced the completion of its acquisition of the Purification & Filtration business of Solventum for ~$4B in cash. This business is now TMO’s Filtration and Separation business and is part of the Life Sciences Solutions segment.
Proposed Acquisition of Clario Holdings, Inc.
On October 29, 2025, TMO announced its intent to acquire Clario Holdings for $8.875B in cash at close plus potential additional earnout and other payments in the future, largely dependent on performance. TMO has also agreed to pay $0.125B in January 2027 and up to $0.4B in payments based on the performance of the business in 2026 and 2027.
The transaction is expected to be completed by the middle of 2026, subject to customary closing conditions and regulatory approvals. To fund the transaction, TMO intends to use proceeds from debt financing and cash on hand. Upon closing, Clario will become part of TMO’s Laboratory Products and Biopharma Services segment.
The Press release states:
Clario integrates clinical trial endpoint data from devices, sites and patients enabling pharma and biotech customers to collect, manage and analyze clinical evidence digitally across every phase of drug development, supporting faster, more confident trial decisions. The company’s platform has supported approximately 70% of FDA drug approvals over the past decade.
Clinical trial endpoint data refers to the specific outcomes or events that are measured to determine whether the treatment or intervention being studied is effective and safe. Pharma and biotech customers increasingly depend on high-quality endpoint data to evaluate therapeutic safety, efficacy, and value—both during drug development and after approval. This data is essential for regulatory success, evidence-based pricing and reimbursement decisions, as well as R&D pipeline development.
The industry-leading solutions offered by Clario include electronic clinical outcome assessments (eCOA), medical imaging, cardiac solutions, respiratory assessments, and wearable data capture technologies designed to ensure the scientific integrity and regulatory compliance of clinical trial outcomes. Clario operates globally and has approximately 4,000 colleagues. For the full year 2025, Clario is expected to generate approximately $1.25 billion of revenue.
Clario is expected to complement TMO’s existing clinical research services, and to drive costs out of the drug development process for customers.
While this impending acquisition is large, TMO has completed two larger acquisitions. PPD, Inc. was acquired in 2021 for ~$17.4B and Life Technologies was acquired in 2014 for ~$13.6B.
Financials
Q3 and YTD2025 Results
The Q3 and YTD2025 Earnings Materials are accessible here. In addition, I recommend reviewing the Q3 2025 GAAP/Non-GAAP Reconciliation & Financial Information.
Conventional And Modified Free Cash Flow (FCF) Calculations (FY2019 – FY2024 and YTD2025 (9 Months))
FCF is a non-GAAP measure, and therefore, the manner in which it is calculated is inconsistent. Many investors deduct CAPEX from OCF to arrive at FCF. In my How Stock Based Compensation Distorts Free Cash Flow post, I explain why I now also deduct stock based compensation (SBC) that is found in the Consolidated Statements of Cash Flows to determine FCF.
The following table reflects TMO’s FCF without/with the deduction of SBC.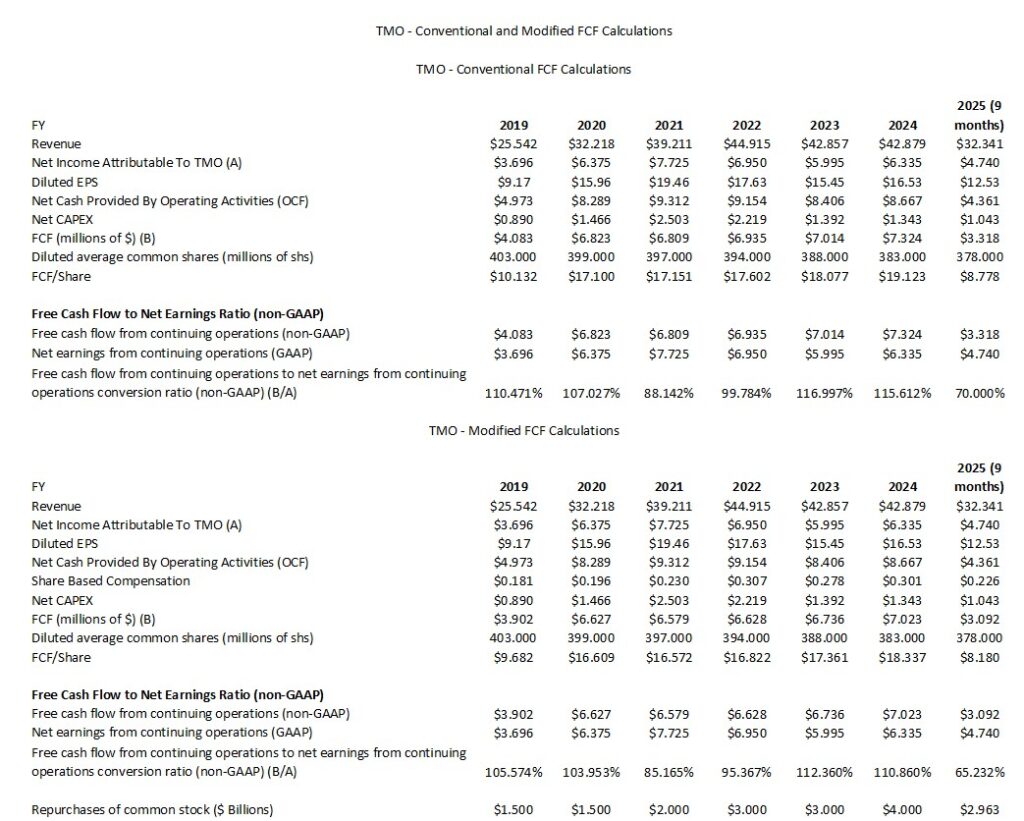
NOTE: The annual Net CAPEX figures deducts any ‘proceeds from sale of property, plant and equipment’ from ‘purchases of property, plant and equipment’.
The YTD2025 results are distorted because we only have Revenue, Diluted EPS, OCF, CAPEX, SBC, and FCF for the first 3 quarters of FY2025.
Return On Invested Capital (ROIC)
High quality companies often generate a high ROIC. If a company generates a high ROIC, it needs to invest less to achieve a certain growth rate thus reducing the need for external capital.
A company that generates $0.15/profit for every $1 invested, for example, achieves a ROIC of 15%. I consider a ~15%+ ROIC to be a reasonable minimum threshold because most of the time, a company’s cost of capital will be lower than this level. TMO’s ROIC falls short of this level but, for the most part, the adjusted ROIC has been in the low double digits over the past decade.
When a company consistently generates a high ROIC over the long term and it is growing its revenue, it can reinvest a portion of its profits under favorable conditions thereby leading to a compounding effect. I would much rather invest in a growing company that can reinvest to create greater shareholder value than to invest in a company that has limited growth opportunities and thus chooses to distribute a growing dividend.
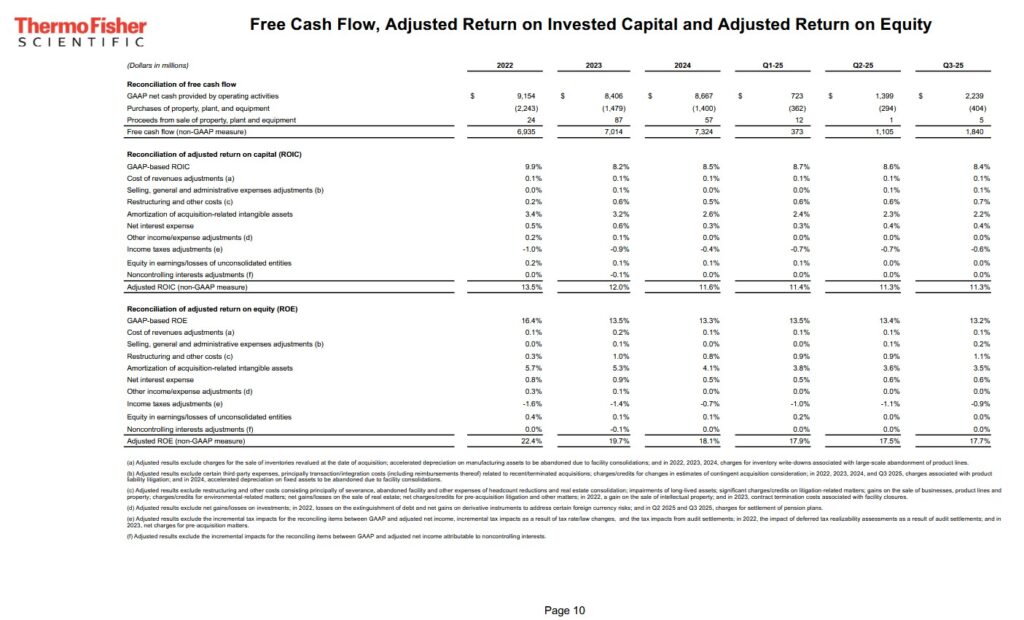
TMO makes various adjustments (see schedule below) to arrive at its adjusted ROIC (%).
FY2025 Guidance
The following is TMO’s updated guidance:
- Revenue guidance is now $44.1B – $44.5B. Prior guidance was ~$43.6B – ~$44.2B. Organic revenue growth at the midpoint of the guide continues to be 2% for the full year. This guidance continues to include a 1 point of headwind from the run-up of pandemic-related revenue.
- Adjusted EPS guidance is $22.60 – $22.86. Prior guidance was $22.22 – $22.84. The increase at the midpoint of the guidance range reflects $420 million higher revenue than the prior guide, driven by the benefit of our recent acquisitions and an increase in the tailwind from FX. The increase in the midpoint also reflects 20 bps of improved adjusted operating margin expansion and $0.20 of higher adjusted EPS. This change includes $0.05 of dilution from TMO’s recent acquisitions.
- Adjusted operating margin guidance is 22.7% – 22.8%. Prior guidance was 22.5% – 22.7%.
On the Q3 earnings call, management states:
Guidance now includes the impact of the recently closed acquisitions. These deals added $0.26B to revenue to our prior full year guide, $20 million adjusted operating income, and $0.05 of adjusted EPS dilution.
In terms of tariffs, guidance reflects the tariffs that are currently in place as of today. This includes the increase in tariff rates between the U.S. and Europe that occurred since the time of our last guidance. The changes in tariffs and trade policy once again caused intra-quarter volatility in FX rates in Q3. As a result, FX in Q3 was $0.22B revenue tailwind to our prior guide and a $0.10 adjusted EPS headwind.
For the full year, we now expect FX to be a YoY tailwind to revenue of $0.23B and a headwind to adjusted operating income and adjusted EPS of $0.11B and $0.37, respectively.
We now expect net interest expense to be ~$0.44B in 2025, and we continue to expect an adjusted tax rate of 10.5% for the full year.
We expect $1.4B – $1.7B of net capital expenditures and ~$7B of free cash flow for the year.
In terms of capital deployment, guidance now assumes that we deploy $7.6B of capital in 2025, $4B on the recently closed acquisitions, $3B on already completed share buybacks and $0.6B of capital returned to shareholders through dividends.
The full year average diluted share count will be ~378 million shares.
Risk Assessment
There are no changes to TMO’s domestic unsecured long-term debt ratings from the time of my prior review.
- Moody’s continues to assign an A3 rating with a stable outlook. Last reviewed June 18, 2024.
- S&P Global continues to assign an A- rating with a stable outlook. Last reviewed June 24, 2025.
- Fitch continues to assign an A- rating with a stable outlook. Last reviewed May 28, 2025.
All three ratings are the bottom tier of the upper medium grade investment grade category. They define TMO as having a strong capacity to meet its financial commitments. TMO, however, is somewhat more susceptible to the adverse effects of changes in circumstances and economic conditions than obligors in higher-rated categories.
The following schedule reflects TMO’s net debt/adjusted trailing 12 month EBITDA ratio for FY2022 – FY2024 and Q1 – Q3 2025.
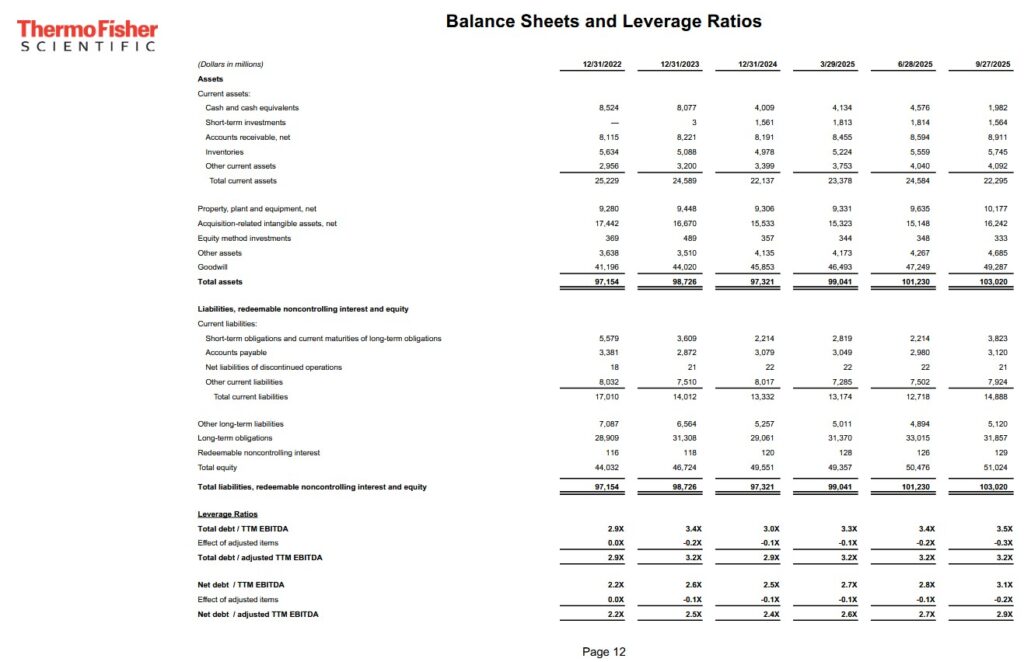
TMO’s debt maturity schedule reflects ~$2.214B of short-term debt.
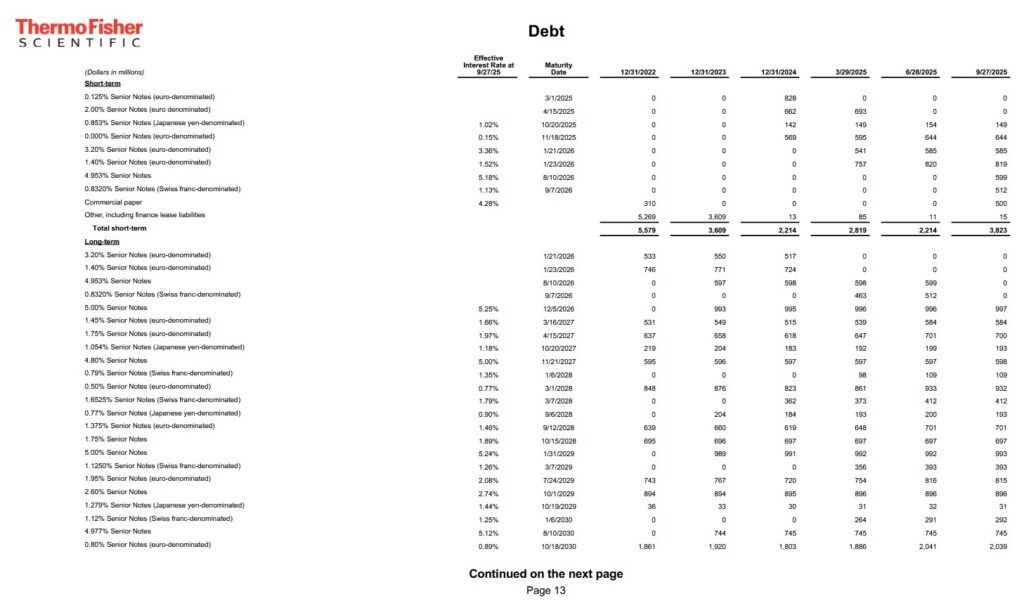
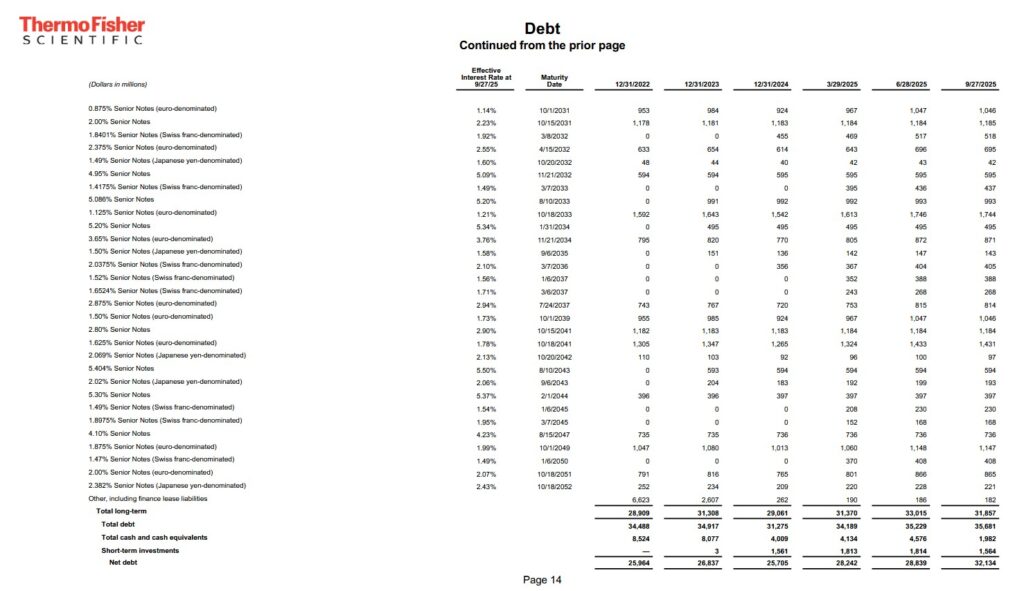
NOTE: TMO will need to issue debt to finance the Clario acquisition. We can, therefore, expect its leverage ratios to increase over the coming quarters. The acquisition announcement is very recent, and therefore, the credit rating agencies have not updated TMO’s profile to indicate the ratings are under review. Even though TMO will be taking on additional debt for the Clario acquisition, I do not foresee a problem in TMO repaying its obligations.
Dividend and Dividend Yield
TMO’s dividend history is accessible here.
Past performance is not necessarily indicative of future performance. Dividends, however, are a low capital allocation priority. This is unlikely to change in the foreseeable future.
When considering TMO as a potential investment, disregard the dividend metrics. They are irrelevant.
I rely on management being able to appropriately increase my total shareholder return. This includes repurchasing shares at attractive valuations when optimal.
A company incurs an excise tax from share repurchases. I, however, prefer share repurchases over dividend income. This is because dividend income is added to my annual income on which I incur a tax liability. Furthermore, as a Canadian resident I incur a 15% dividend withholding tax on dividends from US companies on all shares held in taxable accounts.
Until such time as I sell shares, I need not report any share price appreciation on my personal tax return.
As indicated earlier in this post, in April 2025 I was purchasing shares in the ~$420 – ~$430 range. As I compose this post, TMO’s share price is ~$565. Should TMO’s $0.43 quarterly dividend really influence my investment decision making process?
On November 15, 2024, TMO announced that its Board authorized the repurchase of $4B of common shares in the open market or in negotiated transactions. The authorization has no expiration date and replaced the company’s existing repurchase authorization, of which $1B was remaining.
The following table reflects TMO’s share buybacks in FY2022 – FY2024 and Q1 – Q3 2025.
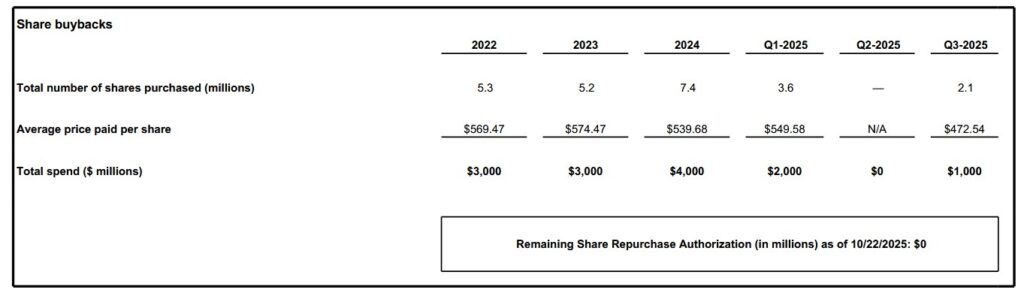
A great time to repurchase shares was in Q2 2025 (April – June 2025) when TMO’s share price was ‘in the dumper’. TMO, however, repurchased no shares! This is likely because of the elevated uncertainty in the business environment.
In July – September, TMO’s share price increased from the Q2 lows and it only repurchased ~$1B at an average price of $472.54. This pales in comparison to the average prices and total spend in FY2022 – FY2024 and Q1 2025.
The weighted average diluted shares outstanding in FY2013 (in millions) was 366. TMO, however, issued equity to assist to aid in the funding of some of its acquisitions. This explains why 378 million shares were outstanding in Q3 2025 despite a considerable level of share repurchases in recent years.
Stock Splits
TMO had three 3 for 2 stock splits in the 1990s (1993, 1995, and 1996).
Valuation
I endeavor to invest in great companies at favorable valuations. At the time of various previous posts, we had the good fortune of TMO falling out of favor thus providing an opportunity to acquire undervalued shares.
We can not rely entirely on PE and adjusted PE ratios to gauge a company’s valuation. These metrics should merely form part of our assessment.
In the first 3 quarters of FY2025, TMO generated $12.53 and $16.30 of diluted EPS and adjusted diluted EPS. The revised FY2025 adjusted EPS is $22.60 – $22.86. The new $22.73 midpoint implies TMO needs to generate ~$6.43 of adjusted diluted EPS in Q4. This is well in excess of the $5.15, $5.36, and $5.79 it generated in Q1 – Q3 2025.
Management provides no GAAP guidance. I, therefore, continue to estimate that FY2025 diluted EPS will be ~$17.
Using the current ~$565 share price, I estimate a diluted PE of ~33.2 ($565/$17). On an adjusted basis we get ~24.7 – ~25 when using management’s revised adjusted EPS guidance of $22.60 – $22.86.
Using the currently available broker estimates, TMO’s forward-adjusted diluted PE levels are:
- FY2025 – 22 brokers – a forward-adjusted diluted PE of ~24.9 using a mean of $22.73 and low/high of $22.51 – $22.81.
- FY2026 – 22 brokers – a forward-adjusted diluted PE of ~23 using a mean of $24.67 and low/high of $24.00 – $25.87.
- FY2027 – 17 brokers – a forward-adjusted diluted PE of ~21 using a mean of $26.93 and low/high of $26.05 – $28.41.
- FY2028 – 6 brokers – a forward-adjusted diluted PE of ~18.5 using a mean of $30.49 and low/high of $29.39 – $32.31.
Management’s FY2025 FCF outlook is $7B. YTD2025 SBC is ~$0.226B so I will continue to estimate $0.3B for FY2025 SBC. This lowers TMO’s FY2025 FCF to ~$6.7B using the modified method of determining FCF.
The diluted share count is now expected to be ~378 million shares.
Dividing ~$7B by ~378 million of diluted shares outstanding leads to ~$18.52 of FCF using the conventional calculation method.
Dividing ~$6.7B by ~378 million of diluted shares outstanding leads to ~$17.72 of FCF using the modified calculation method.
With shares trading at ~$565, TMO’s P/FCF is ~30.5 and ~31.9 calculated using the conventional and modified calculation methods.
At the time of my prior post, I estimated TMO’s valuation as follows:
In the first half of FY2025, TMO generated $8.26 and $10.51 of diluted EPS and adjusted diluted EPS. Management has revised its FY2025 adjusted EPS to $22.22 – $22.84, a $0.23 increase at the midpoint; the new midpoint is $22.53 meaning expectations are for TMO to generate ~$12.02 adjusted diluted EPS in the second half.
Management provides no GAAP guidance, and therefore, I am conservatively estimating that FY2025 diluted EPS will be ~$17. This is slightly above double the first half’s diluted EPS. My estimate assumes TMO will repurchase no shares in the second half thus leading to a marginal increase in diluted shares outstanding because of shares issued as part of the company’s SBC programs.
Using the current ~$475 share price, I estimate a diluted PE of ~28 ($475/$17). On an adjusted basis we get ~20.8 – ~21.4 when using management’s revised adjusted EPS guidance.
Using the currently available broker estimates, TMO’s forward-adjusted diluted PE levels are:
- FY2025 – 28 brokers – a forward-adjusted diluted PE of ~21.1 using a mean of $22.46 and low/high of $21.99 – $22.70.
- FY2026 – 29 brokers – a forward-adjusted diluted PE of ~19.4 using a mean of $24.44 and low/high of $23.50 – $25.87.
- FY2027 – 21 brokers – a forward-adjusted diluted PE of ~17.6 using a mean of $27.05 and low/high of $25.68 – $28.42.
- FY2028 – 7 brokers – a forward-adjusted diluted PE of ~15.8 using a mean of $30.15 and low/high of $29.22 – $31.78.
I envision adjustments to these estimates over the coming days.
As noted earlier, management’s FY2025 FCF outlook is $7B – $7.4B. I assume SBC will be ~$0.3B since management provides no outlook on this line item. Deduct ~$0.3B from ~$7.2B (the midpoint of management’s guidance) and TMO’s FY2025 FCF should be ~$6.9B calculated using the modified method where we deduct SBC to determine FCF.
Divide ~$7.2B by ~379 million of diluted shares outstanding and we get ~$19 of FCF using the conventional calculation method.
Divide ~$6.9B by ~379 million of diluted shares outstanding and we get ~$18.2 of FCF using the modified calculation method.
With shares trading at ~$475, TMO’s P/FCF is ~25 and ~26.1 calculated using the conventional and modified calculation methods.
Final Thoughts
As recently as April 2025, I was acquiring TMO shares in the ~$420 – ~$430 range. Following those purchases I held 383 shares and it was my 21st largest holding when I completed my 2025 Mid-Year Portfolio Review. The share price at the time of that review was ~$428.65.
In my July 7, 2025 post, I disclose the purchase of an additional 75 shares @ $421.9667 share in a ‘Core’ account in the FFJ Portfolio bringing my exposure to 458 shares (358 in ‘Core’ accounts and 100 in a ‘Side’ account).
Fast forward to the end of October 2025 and TMO’s current valuation is less attractive. The company, however, is high quality and is growing. If you have a 10+ year investment time horizon, acquiring shares at the current valuation will likely lead to a reasonable long-term shareholder return.
Using the ~$22.73 midpoint of management’s $22.60 – $22.86 adjusted EPS guidance for FY2025 and a ~$610 share price, the forward adjusted diluted PE is ~26.8.
Using this share price and my FY2025 FCF estimates:
- ~$18.52 of FCF using the conventional calculation method
- ~$17.72 of FCF using the modified calculation method
TMO’s forward P/FCF is ~33 and 34.4.
As much as I like TMO as a long-term investment, I am will remain on the sidelines in the hope of a broad market implosion. Should this occur, I will likely add to my TMO exposure.
I wish you much success on your journey to financial freedom!
Note: Please send any feedback, corrections, or questions to finfreejourney@gmail.com.
Disclosure: I am long TMO.
Disclaimer: I do not know your circumstances and do not provide individualized advice or recommendations. I encourage you to make investment decisions by conducting your research and due diligence. Consult your financial advisor about your specific situation.
I wrote this article myself and it expresses my own opinions. I do not receive compensation for it and have no business relationship with any company mentioned in this article.