![]()
My last RTX Corporation (RTX) review was in this in this July 29, 2024 post at which time my conclusion was that shares were no longer on sale. At the time of that post, the Q2 and YTD2024 results were the most current.
With the release of Q4 and FY2025 results on January 27, I view this as an opportunity to revisit this existing holding.
Business Overview
RTX has 3 business segments (Collins Aerospace, Pratt & Whitney, and Raytheon). Investors unfamiliar with RTX should review the company’s website and Part 1 Item 1 within the 2024 Form 10-K.
Baird Global Industrial Conference – November 13, 2025
During his presentation on November 13, 2025, RTX’s CFO detailed a strong financial trajectory for the company, largely driven by a massive defense backlog, a strategic ‘pension risk transfer’, and the company’s continuing priority to return to pre-merger debt levels. Once RTX achieves this, the plan is to resume more aggressive share buybacks.
As a part of RTX’s strategic decision to de-risk is long-term pension liabilities, it has transferred $2.5B in gross pension obligations to The Prudential Insurance Company of America. This affects ~60,000 retirees and beneficiaries (roughly one-third of the total plan participants).
The following is the financial impact of this transfer:
- The transfer is funded entirely by assets already held within the pension trust. RTX will not, therefore, be required to make a new cash contribution.
- In Q4, RTX took a one-time, non-cash pre-tax settlement charge of ~$0.3B.
- There will be a ~$0.2B decline in ‘non-service pension income’ in FY2026.
On the supply chain front, while Pratt & Whitney original equipment production is up (projected 8–10% growth), they are still meeting demand rather than exceeding it. There continues to be a heavy focus on the SAP system upgrade to improve internal flow.
RTX’s CFO specifically mentioned that the US Department of Defense is looking for commercial-speed innovation, which RTX is facilitating by moving commercial technology into military missions.
He highlighted that while the current record backlog is massive, it is only just beginning to reflect a significant surge in U.S. and NATO procurement cycles.
Financials
Q4 and FY2025 Results
I dispense with a review of Q4 and FY2025 results and recommend reviewing the Form 8-K and Earnings Presentation and earnings call transcript.
Operating Cash Flow (OCF), CAPEX, and Free Cash Flow (FCF)
FCF is a non-GAAP measure, and therefore, its method of calculation is open to debate. Most companies merely subtract capital expenditures (CAPEX) from Net Cash Provided by Operating Activities found in the Consolidated Statement of Cash Flows.
The following reflects RTX’s annual FCF for the FY2020 – FY2025 time frame. The ‘conventional’ calculations do not deduct share-based compensation (SBC) while the ‘modified’ calculations deduct SBC.
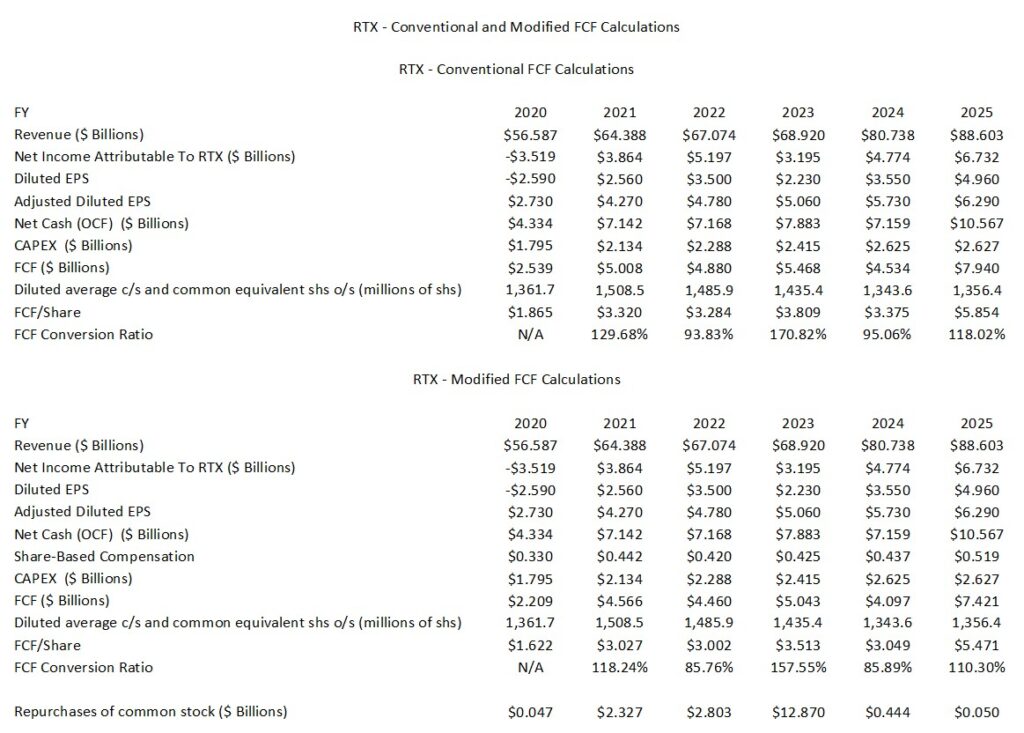
In its January 27 Earnings Release, RTX reports OCF of $10.6B and FCF of ~$7.9B. The company, however, does not deduct SBC. In several posts, I touch upon why I deduct SBC when analyzing a company’s FCF.
Deducting SBC is hotly debated in the world of valuation. Standard accounting says SBC should not be deducted but most sophisticated investors and valuation experts say it should be.
If we want to determine the intrinsic value of a business, we should absolutely deduct SBC. If we do not, we are pretending that labor has no cost.
To get to the ‘truth’ of a company’s earning power, treat SBC as a real expense, even if no cash is being immediately disbursed.
Under GAAP rules, SBC is added back to Net Income to arrive at OCF because there is no exchange of cash. This, however, makes capital-intensive or high-growth tech companies look much healthier than they actually are.
Warren Buffett, Charlie Munger and many top-tier analysts argue that SBC is a real operating cost. This is because if a company does not grant stock to its employees, it would have to give them higher cash salaries to attract and retain them. Ignoring SBC means investors are ignoring a massive part of the company’s labor costs.
In essence, SBC is a ‘delayed’ cash expense. Eventually, the company will likely spend cash on share buybacks to prevent dilution. If we do not deduct SBC, we are essentially saying that employee labor is ‘free’.
Let’s look at two identical companies:
- Company A: Pays $100M in cash salaries. FCF = $50M.
- Company B: Pays $0 in cash salaries but $100M in stock matches. FCF = $150M.
On paper, Company B looks 3x more valuable. In reality, Company B is just diluting its shareholders. Over time, our ownership stake in Company B will shrink while our ownership stake in Company A remains the same.
There are 2 options to account for this so we do not overpay for a stock.
- The ‘Adjusted/Modified’ FCF Method where we manually subtract the SBC expense to determine FCF. This gives us a ‘Cash-to-Cash’ FCF that reflects the true cost of running the business.
- The Dilution Method calls for leaving in FCF, but increasing the share count in our model by 2% – 3% every year to account for the new shares being printed.
I find option #1 to be cleaner and easier to calculate.
Return On Invested Capital (ROIC)
High quality companies often generate a high ROIC. If a company generates a high ROIC, it needs to invest less to achieve a certain growth rate thus reducing the need for external capital.
When a company consistently generates a high ROIC over the long term and it is growing its revenue, it can reinvest a portion of its profits under favorable conditions thereby leading to a compounding effect. I would much rather invest in a growing company that can reinvest to create greater shareholder value than to invest in a company that has limited growth opportunities and thus chooses to distribute a growing dividend.
RTX’s ROIC leaves a lot to be desired. Other factors which I have covered in prior posts, however, justify my investment in this company.
RTX’s (ROIC) is slowly recovering from the lows of the 2020 merger and pandemic period.
In FY2020, RTX’s ROIC was ~1.5% as a result of COVID-19 and merger integration costs.
ROIC improved to ~5.2% and 5.7% in FY2021 and FY2022 with the initial recovery in commercial aerospace and realized merger synergies (2021) and growth in Collins Aerospace aftermarket and stabilization of the Geared Turbofan (GTF) program.
Its ROIC dipped in FY2023 to ~4.3% due to the $3B+ powder metal charge for GTF engines. This decline was primarily a non-operational accounting event. RTX took a significant pre-tax charge related to the Pratt & Whitney GTF engine inspections, which lowered Net Operating Profit After Tax (NOPAT) for that cycle.
ROIC rose to ~6.7% in FY2024 with a rebound driven by record defense backlog and margin expansion.
A further improvement occurred in FY2025 with ROIC in the high single digits (~7.5%) driven by the company’s defense war portfolio and:
- the completion of the $10B share repurchase program in 2024 which reduced the equity base.
- RTX’s prioritization of debt reduction which reduces the denominator in the ROIC formula).
- Collins Aerospace moving into ‘high-teens/low-20%’ operating margins, which significantly boosted NOPAT.
RTX appears to be on the path to ‘value creation’ territory where its returns exceed its cost of funding. I have no allusion that RTX’s ROIC will reach 20% or greater. I would be happy will low double digits (on the condition that this exceeds RTX’s WACC).
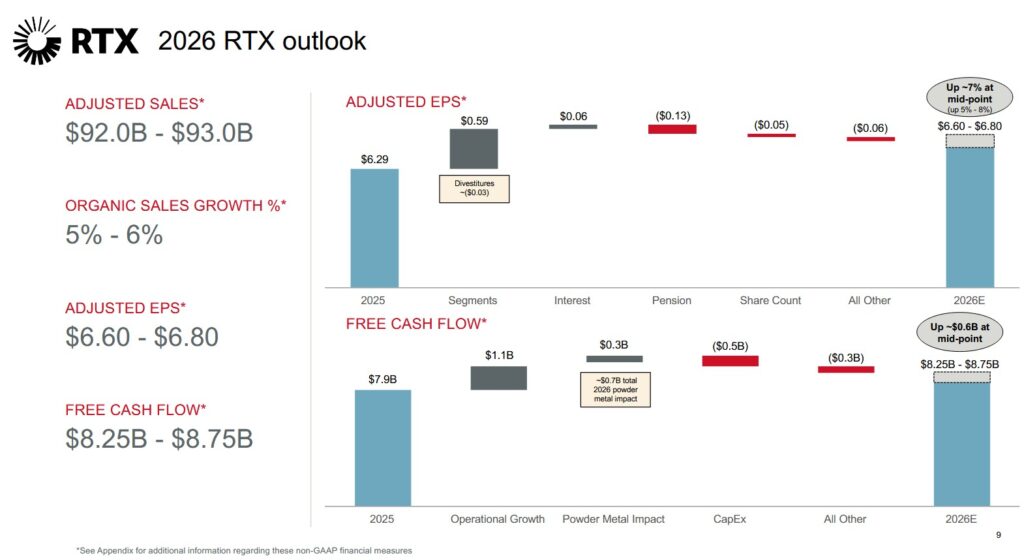
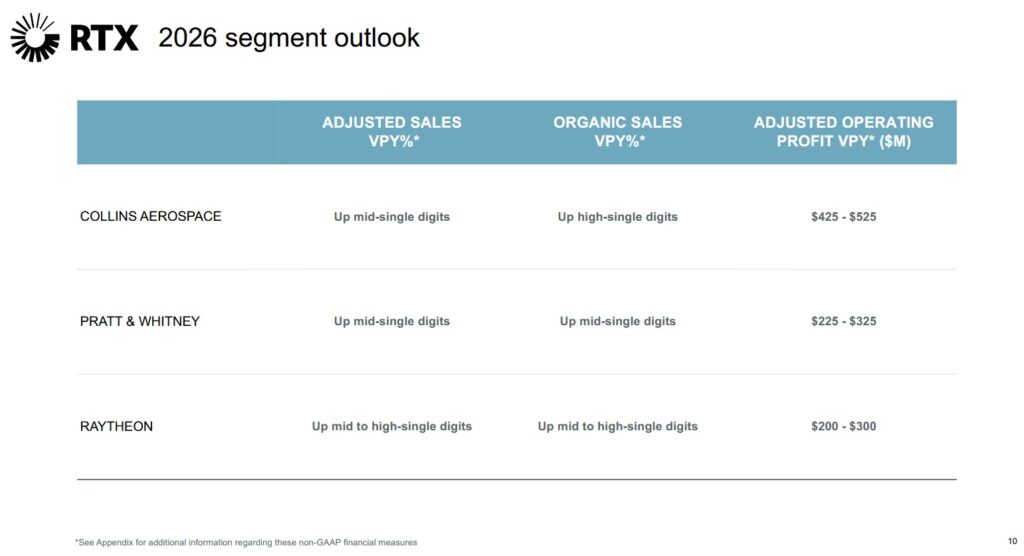
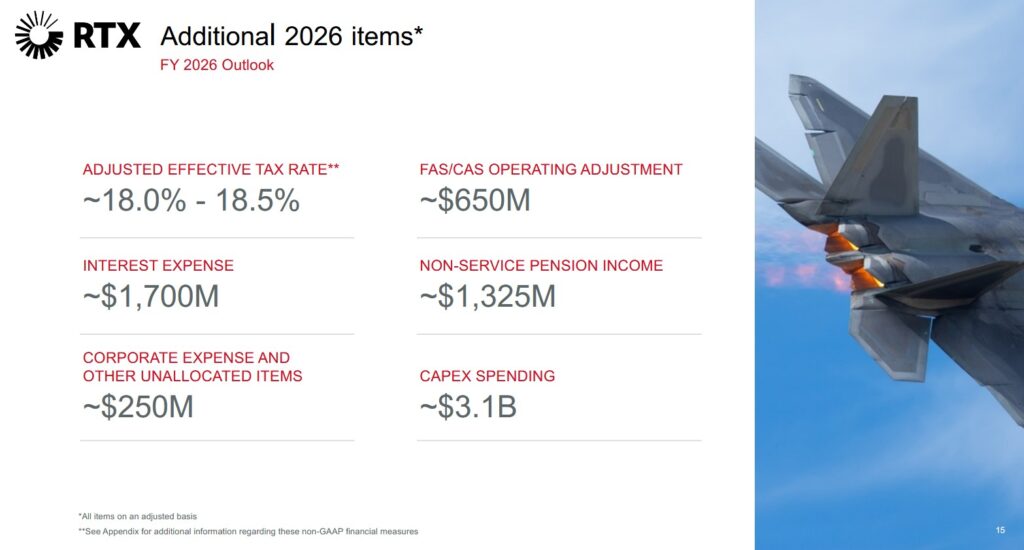
FY2026 Outlook
The following reflect RTX’s FY2026 outlook.
Risk Assessment
A detailed listing of RTX’s long-term debt arrangements will be provided in the FY2025 Form 10-K. Until such time as this SEC Filing becomes available, we can refer to RTX’s ‘Borrowings and Lines of Credit’ section within the Q3 2025 Form 10-Q commencing on page 12 of 83.
At the end of Q3 2025, RTX had ~$38.260B of LTD and ~$0.584B of STD for a total of $38.844B. At FYE2025, LTD was ~$34.288B and STD was ~$3.412B for a total of ~$37.630B. The FYE2025 Consolidated Statement of Cash Flows shows that RTX repaid ~$3.429B of LTD in FY2025.
At the end of Q3 2025, the average maturity of RTX’s LTD was ~12 years.
Looking at the LTD maturity dates in the schedule of debt in the Q3 2025 Form 10-Q, I expect RTX will be able to easily meet its obligations.
- Moody’s assigns a Baa1 rating to RTX’s senior unsecured domestic currency debt with a stable outlook. It was last reviewed on March 26, 2025.
- S&P Global assigns a BBB+ to RTX Corp.’s senior unsecured notes with a stable outlook. This rating is equivalent to that assigned by Moody’s. It was last reviewed on September 17, 2025.
Both ratings are the top tier of the lower medium-grade category and define RTX as having an ADEQUATE capacity to meet its financial commitments. However, adverse economic conditions or changing circumstances are more likely to lead to a weakened capacity to meet its financial commitments.
Both ratings are investment grade and are acceptable for my purposes.
Dividend and Dividend Yield
The company’s website reflects RTX’s dividend history.
I am interested in an investment’s total potential shareholder return. Dividend metrics, therefore, are of little relevance in my investment decision making process.
Raytheon Company and United Technologies completed their merger in April 2020. In the quarter ending on June 30, 2020, there were 1,501.3 million diluted shares outstanding. In Q4 and FY2025, the diluted weighted average outstanding shares were 1,361.7 million and 1,356.4 million.
SBC in FY2025 was $0.519B but share repurchases were only $0.050B as RTX continues to prioritize a return to pre-merger debt levels. Once it achieves this, the plan is to resume more aggressive share buybacks.
Valuation
Shares now trade at ~$200 as I compose this post on January 27. Management’s FY2026 Adjusted diluted EPS outlook is $6.60 – $6.80. This gives us a forward adjusted diluted PE of ~29.4 – ~30.3.
RTX’s valuation using the current broker forward-adjusted diluted earnings estimates is:
- FY2026 – 23 brokers – mean of $6.71 and low/high of $6.50 – $6.97. Using the current mean, the forward adjusted diluted PE is ~29.8.
- FY2027 – 18 brokers – mean of $7.45 and low/high of $6.83 – $8.08. Using the current mean, the forward adjusted diluted PE is ~26.8.
- FY2028 – 8 brokers – mean of $8.00 and low/high of $7.22 – $8.36. Using the current mean, the forward adjusted diluted PE is ~25.
NOTE: Upwards revisions to these estimates are likely over the coming days given that RTX has just released its Q4 and FY2025 results and FY2026 outlook.
Management’s FY2026 FCF outlook is ~$8.25B – ~$8.75B. This outlook, however, does not deduct SBC to arrive at its FCF outlook. Looking at the annual SBC in recent years, I estimate that FY2026 SBC could be ~$0.085B greater than in FY2025. If this assumption is reasonably accurate, SBC in FY2026 could be ~$0.604B. If we deduct this amount from RTX’s FY2026 FCF outlook, the revised FCF range becomes ~$7.646B – ~$8.146B.
Share repurchases are currently not a priority so the diluted weighted average shares outstanding in FY2026 could increase from 1,361.7 million in Q4 2025 to ~1.375 million.
If we divide my estimated FY2026 modified FCF range by ~1.375 million shares, RTX’s forward FCF per share should be ~$5.62 – ~$5.92. With shares trading @ ~$200, the forward P/FCF is ~33.8 – ~35.6.
For the sake of comparison, the following reflects my assessment of RTX’s valuation at the time of prior posts.
My January 24, 2024 post reflects RTX’s valuation at the time of prior posts.
When I wrote my April 24 post, shares were trading at ~$101.40 and there was no change to RTX’s $5.25 – $5.40 FY2024 adjusted diluted EPS outlook; the forward adjusted diluted PE range was ~18.8 – ~19.3.
RTX’s valuation using the current broker forward-adjusted diluted earnings estimates was:
- FY2024 – 23 brokers – mean of $5.39 and low/high of $5.17 – $5.55. Using the current mean, the forward adjusted diluted PE is ~18.8.
- FY2025 – 23 brokers – mean of $6.13 and low/high of $5.24 – $6.78. Using the current mean, the forward adjusted diluted PE is ~16.6.
- FY2026 – 15 brokers – mean of $6.83 and low/high of $5.38 – $7.40. Using the current mean, the forward adjusted diluted PE is ~14.8.
Looking at RTX’s valuation from a FCF perspective, it repurchased $10.283B of its shares by way of an ASR in late 2023, and therefore, I expected no significant share repurchases in FY2024.
The weighted average number of shares outstanding in Q1 2024 was 1,337.3 million versus 1,474.2 million in Q1 2023. Additional shares may be issued as part of the company’s stock based compensation arrangements so I estimated a weighted average of 1,340 million shares for FY2024.
Dividing RTX’s ~$5.7B FY2024 FCF outlook by 1,340 million shares gave us ~$4.25 FCF/share. Using the ~$101.40 share price and my ~$4.25 FCF/share estimate resulted in a forward P/FCF of ~23.9. RTX’s P/FCF in FY2014 – FY2023 was 13.81, 14.16, 19.81, 20.84, 12.46, 15.83, 16.99, 24.53, 26.62, and 15.84; United Technologies and Raytheon merged on April 3, 2020 so we can’t make a direct comparison between the current P/FCF and levels prior to the merger.
Shares now trade at ~$114 following the July 26 market close. RTX has also raised its FY2024 adjusted diluted EPS to $5.35 – $5.45 from $5.25 – $5.40. This gives us a forward adjusted diluted PE of ~20.9 – ~21.3.
RTX’s valuation using the current broker forward-adjusted diluted earnings estimates is:
- FY2024 – 20 brokers – mean of $5.43 and low/high of $5.19 – $5.54. Using the current mean, the forward adjusted diluted PE is ~21.
- FY2025 – 21 brokers – mean of $6.09 and low/high of $5.48 – $6.40. Using the current mean, the forward adjusted diluted PE is ~18.7.
- FY2026 – 17 brokers – mean of $6.83 and low/high of $6.02 – $7.40. Using the current mean, the forward adjusted diluted PE is ~16.7.
The weighted average number of shares outstanding in Q1 2024 was 1,342.1 million and 1,339.7 million for the first half of FY2024.
The ~$4.7B FY2024 FCF outlook has been lowered from the prior ~$5.7B outlook. Dividing $4.7B by ~1,340 million shares we get~$3.50 FCF/share. Divide the current ~$114 share price by ~$3.50 we get a ~32.6 forward P/FCF. Following the ~$1B reduction in the FY2024 FCF outlook, RTX’s valuation based on FCF is much less attractive than the forward P/FCF of ~23.9 I calculated just a few months ago.
Final Thoughts
My RTX exposure currently consists of 957 shares in 2 ‘Core’ accounts within the FFJ Portfolio versus 941 at the time of my July 29, 2024 post. The slight increase is solely the result of the automatic reinvestment of dividend income.
My most recent RTX lump sum purchases have been:
- 300 shares on October 1, 2020 @ $58/share
- 100 shares on July 25, 2023 @ $85.6712/share
- 100 shares on September 11, 2023 @ $78.0181/share
When I completed my 2024 Mid Year FFJ Portfolio Review, RTX was my 29th largest holding. This review was prepared using the June 28, 2024 ~$102 closing share price.
When I completed my 2025 Year-End Investment Holdings Review, RTX had risen to my 23rd largest holding. This review was prepared using the December 31, 2025 ~$183.40 closing share price.
As recently as December 1, 2025, RTX’s share price was ~$168. Now ~$200. Is RTX really worth $32/share more than a little over 1.5 months ago?
I like RTX as a long-term investment. Currently, however, I think its valuation is much too high. I, therefore, think it may be difficult to generate an attractive total annual rate of return over the next few years. The time to invest in great companies is when they temporarily fall out of favor with the broad investment community. RTX’s valuation suggests we are witnessing a period of ‘investor irrational exuberance’.
Suppose RTX’s share price retraces to ~$170. If we use the $6.70 mid-point of management’s adjusted diluted EPS estimate, the forward adjusted diluted PE is ~25.4.
Using my FY2026 forward FCF per share range of ~$5.62 – ~$5.92 and a ~$170 share price, the forward P/FCF is ~28.7 – ~30.2.
Even at this lower share price, RTX is not a bargain. RTX, however, has a very wide moat so investors will likely have to ‘pay up’ (just not too much) to invest in this high quality company.
Once RTX returns to pre-merger debt levels, the plan is to resume more aggressive share buybacks. My hope is that RTX’s share price plunges before it starts aggressively repurchasing shares.
I do not intend to immediately acquire additional shares.
I wish you much success on your journey to financial freedom!
Note: Please send any feedback, corrections, or questions to finfreejourney@gmail.com.
Disclosure: I am long RTX.
Disclaimer: I do not know your circumstances and am not providing individualized advice or recommendations. I encourage you not to make investment decisions without conducting your research and due diligence. You should also consult your financial advisor about your specific situation.
I wrote this article myself and it expresses my own opinions. I am not receiving compensation for it and have no business relationship with any company whose stock is mentioned in this article.