
On August 2, 2022 I added to my The Home Depot (HD) exposure with the purchase of shares @ $301.64. Following this recent purchase and the automatic reinvestment of dividends, there are currently 252 HD shares in a ‘Side’ account within the FFJ Portfolio.
I last reviewed HD in my August 16, 2022 post in which I conclude that in recent years, HD’s share price has exhibited wild swings. Following my August 2 purchase, HD’s share price surged. There was, however, nothing I could identify for the justification of this share price increase when I reviewed Q2 and YTD2022 results and FY2022 guidance.
Following this mid-August earnings release, HD’s share price fell to the mid $260s by late September. I had purposely set aside funds to take advantage of attractive valuations; I would have added to my HD exposure. However, I was thrown a ‘curve ball’ in mid-September when we acquired a second home with the use of my liquidity.
Now, with HD having released Q3 and YTD2022 results and FY2022 guidance on November 15 I take this opportunity to revisit HD.
Overview
You are undoubtedly familiar with HD to some extent. However, if you want a good overview of the company that includes the Risk Factors, Part 1 in the FY2021 Form 10-K is a good source of information.
Financials
Q3 and YTD2022 Results
HD’s Q3 and YTD2022 earnings-related material is accessible here.
In Q3 and the first 3 quarters of FY2022, HD generated $43.8B and $82.7B in revenue. In comparison, it generated ~$110.2B, ~$132.1B, and ~$151.2B in FY2019 – FY2021.
HD’s ~34% gross margin was a decrease of ~10 basis points from last year. This was primarily driven by supply chain investments.
Operating expenses as a percent of sales decreased 18 basis points to 18.2% which is in line with management’s expectations which reflected continued wage investments as well as planned investments designed to drive efficiency in HD’s store environment.
The ~$80 million increase to $0.406B in interest and other expenses for Q3 is due primarily to higher long-term debt levels than one year ago.
At the end of Q3, HD’s inventory amounted to $25.7B, a $5.1B increase compared to Q3 2021. Inventory turns were 4.3 times, down from 5.4 times the prior year. The growth in the value of HD’s inventory primarily reflects product cost inflation and strategic decisions in response to continued global supply chain disruption.
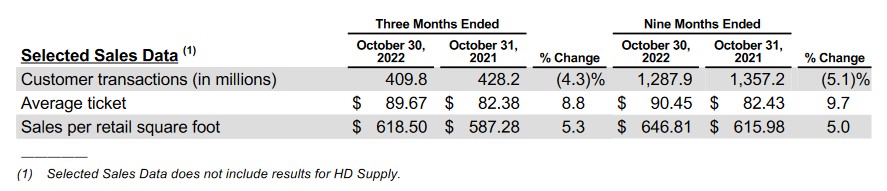
Looking at the selected sales data, we see a decline in the number of customer transactions relative to the same timeframe in FY2021. The average ticket, however, has increased. This suggests HD’s growth is being driven by inflation rather than a jump in unit sales.
On the Q3 earnings call, HD’s EVP, Merchandising states:
’11 of our 14 merchandising departments posted positive comps. Building materials, plumbing, lumber, millwork, paint and hardware had comps above the company average. All other departments, with the exception of appliances, flooring, and indoor garden, were positive, but below the company average.‘
‘The growth in our comp average ticket was driven primarily by inflation across our product categories as well as demand for new and innovative products. Inflation from core commodity categories positively impacted our average ticket growth by ~200 basis points during the third quarter, driven by inflation in building materials, lumber, and copper.’
While HD’s YTD2022 results have benefitted from a backlog of contracted jobs that piled up during the pandemic, its results are closely intertwined with those of the US housing market. In recent months US home sales have slowed as US policymakers have sought to blunt the highest inflation in decades by raising interest rates.
Despite the full impact of these rate increases having yet to be felt, US household debt climbed at the fastest annual pace since 2008 in Q3. Credit-card balances are surging even as the interest rates lenders charge to consumers hit a multi-decade high.
According to data released by the Federal Reserve Bank of New York on November 15, 2022, US households added $351B in overall debt in Q3 taking the total to $16.5T. This is an increase of 8.3% from a year earlier, the most since a 9.1% jump in Q1 2008; the debt figures are not adjusted for inflation.
Most of the latest increase is in mortgages, historically the largest form of household debt. This form of debt now comprises 71% of outstanding household debt balances, up from 69% in Q4 2019. It rose by $282B in Q3 and by $1T from a year earlier to $11.7T. Mortgage and home-equity debt combined are up by $2T since the pandemic began.
Credit card debt also increased by the most in 20 years, with balances rising by 15% from a year earlier. This surge is despite the average interest rates on card borrowing having climbed above 19%; this is the highest in data going back to the mid-1980s.
Delinquency rates are currently low by historical standards as many households saw their finances cushioned by pandemic stimulus and savings during the COVID lockdown. However, the rapid increase in debt levels suggests to me that far too many (homeowners included) are ‘soaring with the eagles while the pigeons are doing a number on their head’.
Add in the increasing number of companies which have very recently announced job eliminations and Q4 statistics are likely to be worse. This may well lead to a pullback in home renovations over the coming months.
On a positive note, HD is the industry leader and is likely to continue to capture market share over the long term. In addition, there is a housing shortage in the US and Canada and the aging of homes is a favourable catalyst in the medium to long term. In some cases, higher mortgage rates may also lead some homeowners to stay put in their homes and start new improvement projects.
Return on Invested Capital (ROIC)
ROIC is used to assess a company’s efficiency in allocating capital to profitable investments. It gives investors a sense of how well a company is using its capital to generate profits.
A company is thought to be creating value if its ROIC exceeds its weighted average cost of capital (WACC).
Computed on the average of beginning and ending long-term debt and equity for the trailing 12 months, HD’s return on invested capital was ~43.3%. Despite this slight deterioration from the prior trailing 12 months’ results, we know that HD’s WACC is well below ~43%.


FY2022 Outlook
On the Q3 earnings call, HD’s President and CEO states:
‘While the business performed very well, and our consumer remains resilient, we are navigating a unique environment. We can’t predict how the evolving macroeconomic backdrop will impact our customer going forward.’
HD has reaffirmed its FY2022 outlook provided when it released Q2 2022 results.
- Sales growth and comparable sales growth of ~3%;
- Operating margin of approximately 15.4%;
- Net interest expense of approximately $1.6B;
- The tax rate will be ~ 24.6%; and
- Diluted EPS growth will be in the mid-single digits.
Operating Cash Flow (OCF) Free Cash Flow (FCF)
The Condensed Consolidated Statement of Cash Flows in the FY2011 – FY2021 Form 10-Ks reflect OCF of (in $B) 6.65, 6.98, 7.63, 8.24, 9.37, 9.78, 12.03, 13.17, 13.69, 18.84, and 16.57.
Back out capital expenditures (CAPEX) in FY2011 – FY2021 and FCF (in $B) is 5.43, 5.66, 6.24, 6.80, 7.87, 8.16, 10.13, 10.72, 11.01, 16.38, and 14.
In Q3, HD’s CAPEX was $0.77B.
HD’s YTD OCF is $10.021B. Deduct $2.216B in YTD CAPEX and YTD FCF is ~$7.805B.
Credit Ratings
There is no change to HD’s senior unsecured domestic currency credit ratings following my August 16, 2022 post. The ratings and outlook remain:
- Moody’s: A2 and stable;
- S&P Global: A and stable; and
- Fitch: A and stable.
These ratings are the middle tier of the upper-medium grade category and define HD as having a STRONG capacity to meet its financial commitments. However, it is somewhat more susceptible to the adverse effects of changes in circumstances and economic conditions than obligors in higher-rated categories.
These investment-grade ratings are acceptable for my purposes.
Dividends and Share Repurchases
Dividend and Dividend Yield
When I wrote my June 7, 2021 post, shares were trading at ~$311 and the annual $6.60 dividend yielded ~2.1% (see HD’s dividend history); the $1.65 quarterly dividend was increased to $1.90 in early 2022.
At the time of my April 4, 2022 post, HD was trading at ~$303 and the $1.90 quarterly dividend yield was ~2.5%. The dividend yield was similar when I purchased more shares on August 2 @ ~$301.64.
When I wrote my August 16 post, shares were trading at ~$330.50 and the dividend yield was ~2.3%.
Shares now trade at ~$312 and HD is to declare its 4th consecutive $1.90 quarterly dividend within days. While the trailing dividend yield is ~2.4% we can likely expect HD to declare a dividend increase in the second half of February 2023. If the past few dividend increases are an indication of the increase we can expect, we may see a ~$0.10 – ~$0.15 increase. Using the $0.125 mid-point, the new quarterly dividend payable in March might be ~$2.03.
During FY2016 – FY2021, HD’s dividend distributions were $3.404B, $4.212B, $4.704B, $5.958B, $6.451B, and $6.985B for a total of ~$31.7B. HD YTD2022 dividend distribution is $5.856.
HD distributed ~$1.9B in dividends in Q3 and I do not foresee an issue with HD’s ability to service ongoing dividend distributions.
Share Repurchases
In FY2016 – FY2021, HD repurchased $6.88B, $8B, $9.963B, $6.965B, $0.791B, and $14.809B of issued and outstanding shares for a total of ~$47.41B. The dramatic drop in the value of shares repurchased in FY2020 is because HD suspended share repurchases in March 2020 when COVID-19 hit North America. HD resumed share repurchases in Q1 2021.
The diluted weighted average common shares outstanding for the 9 months ended October 30, 2022 is 1,028 million. In comparison, the diluted weighted average common shares outstanding in FY2019 – FY2021 (in millions) are 1,097, 1,078, and 1,058.
In Q3, HD’s share repurchases were ~$1.2B. and YTD share repurchases amount to $5.136B. This is partially offset by $146 million in proceeds from the sale of common stock. It has also incurred ~$286 million in YTD stock-based compensation expenses.
Valuation
HD’s FY2011 – FY2021 historical PE levels based on diluted EPS are 18.04, 21.93, 22.25, 23.86, 24.77, 21.73, 26.29, 18.76, 21.71, 22.96, and 19.27.
At the time of my June 7, 2021 post, HD had generated $11.94 of diluted EPS in FY2020 and $3.86 in Q1 2021. Management provided no guidance but I felt that FY2021 diluted EPS of ~$13.50 – ~$14 was not unreasonable. Using the current ~$311 share price, the forward diluted PE range was ~22.2 – ~23 and ~22.6 using the $13.75 midpoint.
Using this midpoint and a forward diluted PE of 20 that I deemed to be a reasonable earnings multiple, I considered ~$275 to be a level at which I would consider initiating a position.
HD’s adjusted diluted EPS guidance from 32 brokers was a mean of $14.16 and a range of $13.44 – $15.37 when I wrote my June 7, 2021 post. With shares trading at ~$311, the forward adjusted diluted PE range was ~20 – ~23 and ~22 using the mean guidance.
When I disclosed that I had initiated an HD position in my April 4 post, HD had reported $15.53 of diluted EPS in FY2021. Using a 20 PE, a ~$310 share price seemed to be a reasonable level at which to initiate a position. Shares, however, were trading at ~$303 so the PE was ~19.5 based on FY2021’s diluted EPS of $15.53.
The valuation based on the ~$303 share price and adjusted diluted EPS broker estimates at the time were:
- FY2023 – 31 brokers – mean of $16.10 and low/high of $15.65 – $16.85. Using the mean estimate, the forward adjusted diluted PE is ~18.8.
- FY2024 – 30 brokers – mean of $17.32 and low/high of $16.50 – $18.50. Using the mean estimate, the forward adjusted diluted PE is ~18.4.
- FY2025 – 12 brokers – mean of $18.54 and low/high of $17.73 – $19.21. Using the mean estimate, the forward adjusted diluted PE is ~16.34.
When I wrote my August 16, 2022 post, HD has just reported YTD2022 diluted EPS of $9.13 and shares are trading at ~$330.50. Assuming similar results over the remainder of FY2022, I anticipated that HD would generate dilute EPS of ~$18.26. This gave me a forward diluted PE of ~18.1.
Using adjusted diluted earnings estimates from the brokers which cover HD, I arrived at the following valuations.
- FY2023 – 34 brokers – mean of $16.46 and low/high of $16.05 – $16.85. Using the mean estimate, the forward adjusted diluted PE is ~20.1.
- FY2024 – 34 brokers – mean of $17.33 and low/high of $16.29 – $18.66. Using the mean estimate, the forward adjusted diluted PE is ~19.1.
- FY2025 – 17 brokers – mean of $18.34 and low/high of $16.30 – $19.93. Using the mean estimate, the forward adjusted diluted PE is ~18.
HD has now reported a YTD diluted EPS of $13.37. My prior FY2022 diluted EPS estimate of ~$18.26 was too high which slightly distorted my forward diluted PE. Based on HD’s YTD results, I do not think it will generate diluted EPS of $4.89 ($18.26 – $13.37) in Q4. If it generates $4.20 of diluted EPS in Q4 (Q3 diluted EPS was $4.24) then FY2022 diluted EPS of $17.57 is not unreasonable. With shares trading at ~$312, the forward diluted PE based on GAAP results is ~17.76.
The brokers which cover HD will likely be amending their adjusted diluted EPS estimates over the coming days. For now, however, HD’s forward adjusted diluted PE levels are:
- FY2023 – 35 brokers – mean of $16.59 and low/high of $16.33 – $16.63. Using the mean estimate, the forward adjusted diluted PE is ~18.8.
- FY2024 – 35 brokers – mean of $16.99 and low/high of $15.10 – $18.36. Using the mean estimate, the forward adjusted diluted PE is ~18.4.
- FY2025 – 2 brokers – mean of $17.97 and low/high of $14.50 – $19.84. Using the mean estimate, the forward adjusted diluted PE is ~17.4.
Final Thoughts
The swoon in HD’s share price witnessed from mid-September to mid-October was short-lived. However, HD acknowledges that it is operating in a unique environment. It faces a broad-based inflationary environment not seen in 4 decades and it is also managing through constrained global supply chain conditions with a shift in monetary policy intended to moderate demand.
HD is not unique in this regard. Given the quickly deteriorating macroeconomic environment, I think an economic downturn in 2023 is quite possible. Should this happen, I envision HD’s results might be weaker than the current forecast which may present an opportunity to acquire HD shares at a more favourable valuation.
I wish you much success on your journey to financial freedom!
Note: Please send any feedback, corrections, or questions to finfreejourney@gmail.com.
Disclosure: I am long HD.
Disclaimer: I do not know your circumstances and do not provide individualized advice or recommendations. I encourage you to make investment decisions by conducting your research and due diligence. Consult your financial advisor about your specific situation.