Contents
 Summary
- This Union Pacific stock analysis is based on Q4 and FY 2016 results and the outlook for fiscal 2017 released January 19, 2017.
- Union Pacific, North America’s largest railroad, reported a substantial full-year decline in volumes vs. FY2015 but declines moderated in Q4 FY2016.
- Union Pacific's operating ratio increased to 63.5 percent but UNP is committed to its G55 + 0 initiatives which it initiated in FY2015.
- Dividend and share repurchases amounted to roughly $5B or 118% of net income in FY2016.
- Since 2007, Union Pacific has repurchased just over 29% of outstanding shares.
- I view Union Pacific as being a bit too expensive at the moment and will patiently wait for it to retrace to the low $90s.
Introduction
We currently own shares in only one railroad, the TSX listed shares of Canadian National Railway (NYSE: CNI) in the FFJ Portfolio and no other shares within the Transportation sector. I would like to beef up our exposure to this sector and after a quick review of certain financial metrics for various North American Rail Freight Transport companies, decided to analyze Union Pacific Railroad (NYSE: UNP).
I have been monitoring UNP with the hope of a pullback to a more reasonable valuation level so I can add it to our investment portfolio. Today’s earnings release and the subsequent jump in price has not helped my cause. I am cautiously optimistic, however, of a correction in UNP’s valuation at some stage in 2017.
Industry Overview
The North American Rail Freight Transport industry is broken down into three classes:
- Class I railroads typically runs a large continental network; UNP is a participant within the Class I sector.
- Class II railroads are regional in nature
- Class III railroads are short line railroads
Class II and III railroads are far smaller in size and geographic coverage. Participants within these 2 classes account for 31% of U.S. freight rail mileage and 10% of employees. The more than 550 short line and regional railroads operate in every U.S. state except Hawaii and often feed traffic to Class I railroads and receive traffic from Class I railroads for final delivery.
The following is the list of publicly traded Class I railroads in North America (all market capitalization figures are expressed in US dollars and are as at the close of business January 19, 2017).
- Union Pacific Railroad (NYSE: UNP) $88.46B
- Canadian National Railway (NYSE: CNI) $52.13B
- CSX Transportation (NYSE: CSX) $41.27B
- Norfolk Southern Railway (NYSE: NSC) $33.73B
- Canadian Pacific Railway (NYSE: CP) $21.87B
- Kansas City Southern Railway (NYSE: KSU) $9.17B
Note: BNSF Railway (fka Burlington Northern Sante Fe Railway) is the second largest Class I railroad after UNP but was taken private in 2010 and is now part of Berkshire Hathaway Inc. (NYSE: BRK.A) (NYSE: BRK.B).
Rail Freight - Competitive Advantages and Disadvantages
In addition to the cost prohibitive aspect for new entrants to establish a Class I, I view the following as significant advantages when analyzing a potential investment in the North American Rail Freight Transport industry:
- Nearly half (43%) of all intercity freight transportation is handled by rail.
- Roughly two-thirds of the nation's coal is transported by rail.
- Railroads carry a sizable percentage of the bulk shipments of chemicals, grains and cars in the US and Canada.
- Railroads transport more freight than that carried by trucks, ships, or pipelines.
- Participants within this industry have better pricing power than their primary competitor, the trucking industry.
- There are only a few large companies that dominate the sector. The lower level of competition relative to the trucking industry, for example, means railroads are not under as much pressure to lower their prices.
- Transporting freight on rail is more energy efficient than transporting it by truck so it makes sense energy-wise to transport freight on rail for most mid- and long-range hauls. A train can move, on average, a ton of freight over 430 miles on a gallon of diesel so the inevitable increase in gas prices will benefit railroads.
- Railroads are far more efficient than some of the alternative freight haulers in that they link many cars in a single train and each train only requires very few operators. The trucking industry, however, requires at least one driver for every single truck.
- Rail transport offers compelling safety and efficiency advantages. Accident rates are far lower for trains than trucks.
Railroads also have their disadvantages:
- High fixed costs can work against participants when volumes or rates weaken.
- Fuel can make up about 20% of a railroad's operating expenses and in periods of rising prices.
- Railroads are not always able to fully hedge their costs or offset the risks with surcharges.
- Class I railroads are heavily unionized with compensation and benefits comprising more than a third of operating expenses.
- The average cost of a train derailment far exceeds that of a single truck accident.
- Two-thirds of the nation's coal is transported by rail. Coal production is falling off a cliff. The U.S. Energy Information Administration (EIA) has indicated that coal production is barely a third of what it was about 6.5 six years ago and they expect the worst is yet to come. The statistics are alarming if a company’s major source of revenue is in the transportation of coal.
- Railroads are extremely capital intensive. A critical metric to monitor is the average age of the railway’s fleet (locomotives, freight cars, highway revenue equipment).
The following images reflect the “Number of Cars on Line”, “Terminal Dwell”, and "Train Speed” for a 53 week period (CP Rail is excluded).
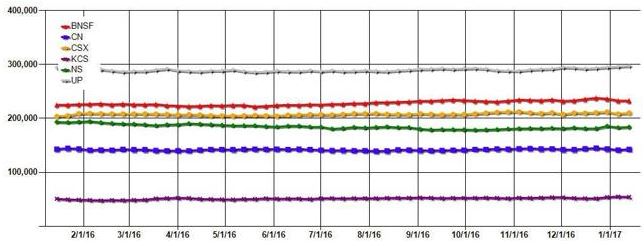
Number of Cars on Line
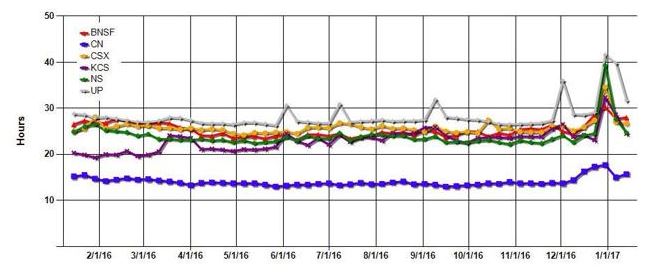
Terminal Dwell
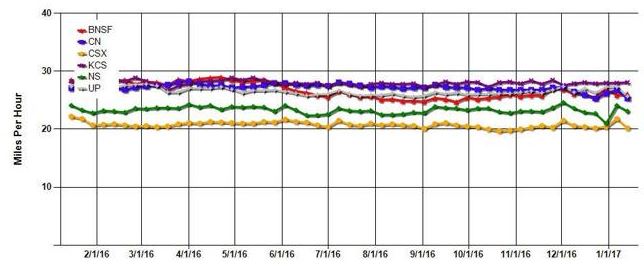
Train Speed
As you can see, UNP ranks well with number of cars on line (to be expected since it has the largest fleet), worst on terminal dwell, and middle of the pack on train speed.
While the 6 railroads use the same definitions to calculate their performance data to ensure a high degree of consistency of the measurements. These measures are most useful for examining trends and relative changes.
When reviewing these results it is important to keep in mind that the level of performance between railroads may differ sharply because each railroad is unique. Differences between railroads include terrain, physical routes, network design, traffic mix and volume, the extent of passenger operations, and operational practices. External factors such as weather and port operations can also cause variations between railroads and over time.
Business Overview
The Pacific Railway Act of July 1, 1862, created the original Union Pacific.
On May 10, 1869, after 20,000 men, working 12 to 16 hours a day, seven days a week, for six years, the Golden Spike was driven into the ground marking the completion of a transcontinental route which heralded the Industrial Revolution.
The Union Pacific of today has 44,500 employees and a fleet of more than 8,000 locomotives which travel to 23 states over 32,100 miles of track. A State by State guide which reflects a host of data including the top 5 commodities shipped and received by UNP can be found here (2015 data).
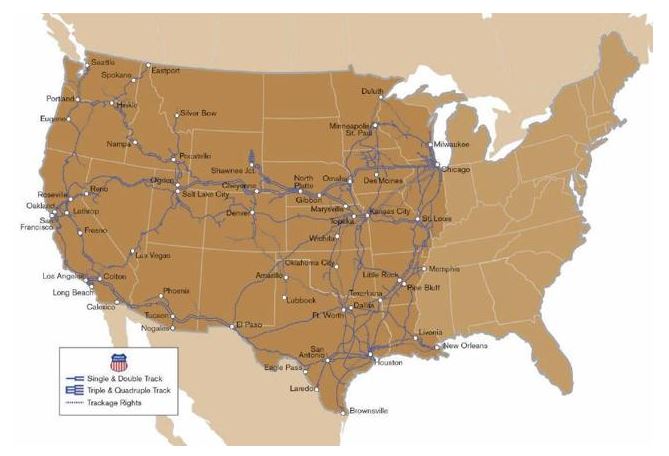
Union Pacific System Map
The most recent statistics I have been able to locate which gives an indication as to the age of UNP’s fleet is UNP’s 2015 Fact Book from which I obtained the following image.
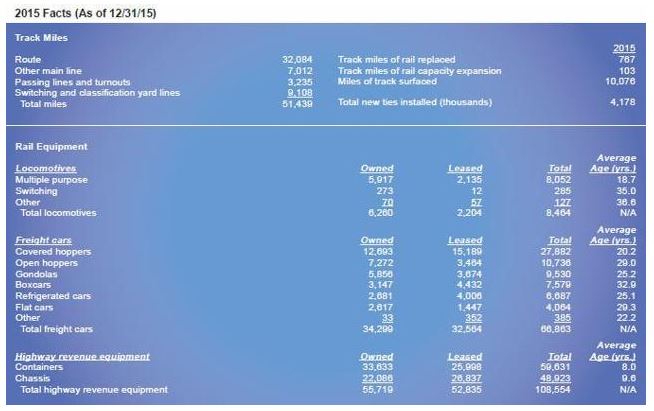
UNP Rail Fleet
2016 Results
The following is a high level overview of the information obtained from UNP’s website and from January 19, 2017 Q4 2016 Earnings Release conference call/webcast.
- UNP reported net income of $4.2B or $5.07 per diluted share in FY2016 versus $4.8B or $5.49 per diluted share in FY2015, representing 11 and 8 percent decreases, respectively.
- Operating revenue totaled $19.9 billion as compared to $21.8 billion in 2015. Operating income totaled $7.3 billion, a 10 percent decrease compared to 2015.
- Freight revenue totaled $18.6 billion, a 9 percent decrease when compared to 2015. Carloadings were down 7 percent versus 2015, with declines in the chemicals, coal, industrial products and intermodal business groups.
- Average diesel fuel prices decreased 20 percent to $1.48 per gallon in 2016 from $1.84 per gallon in 2015.
- UNP's operating ratio increased to 63.5 percent, 0.4 points higher than the full-year record set in 2015.
- Train speed, as reported to the Association of American Railroads, was 26.6 mph, 5 percent faster compared to the full year 2015.
- UNP's reportable personal injury rate of 0.75 incidents per 200,000 employee hours was a full-year record, improving 14 percent compared to 2015.
- UNP's capital program in 2016 totaled just under $3.5 billion, a decrease of approximately $800 million compared to the full year 2015.
- UNP repurchased 35.1 million shares (4% of outstanding shares) in 2016 at an aggregate cost of $3.1 billion.
- Dividends of $1.9B vs $2.3B in FY 2015 even though UNP increased its quarterly dividend from $0.55 to $0.605 in Q4. The last previous increase was with the February 27, 2015 record date.
- Dividend and share repurchases amounted to roughly $5B or 118% of net income in FY 2016.
- Since 2007, UNP has repurchased just over 29% of outstanding shares.
The following graphs were prepared using data extracted directly from UNP's 2011 - 2015 Annual Reports and from information provided in UNP's January 19, 2017 conference call/webcast presentation.
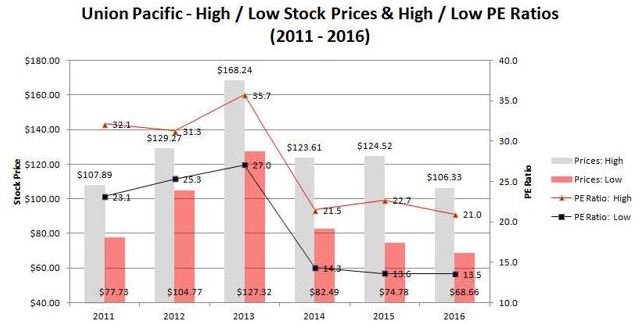
Union Pacific High/Low Stock Prices and High/Low P/E Ratios
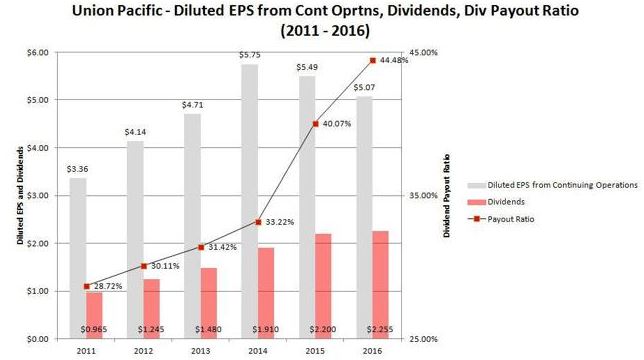
Union Pacific Diluted EPS from Continuing Operations, Dividends, and Dividend Payout Ratio Metrics
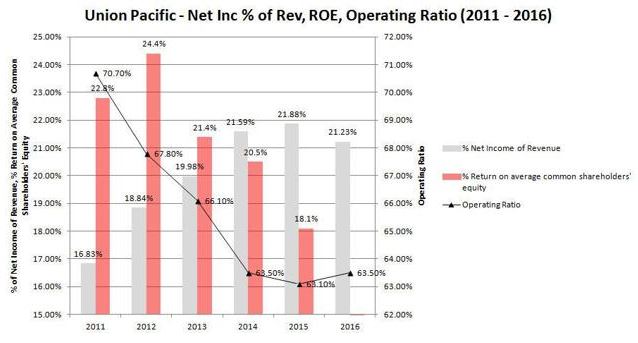
Union Pacific Net Income as a % of Revenue, ROE, and Operating Ratio Metrics
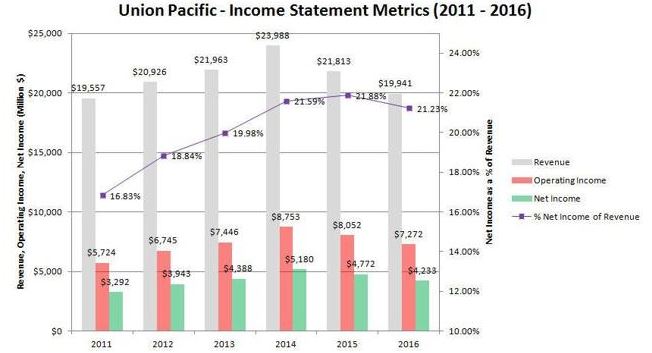
Union Pacific Income Statement Metrics
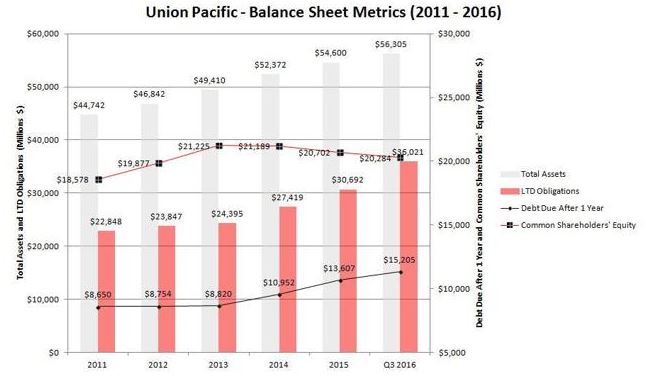
Union Pacific Balance Sheet Metrics
NOTE: UNP’s FY 2016 Balance Sheet is not yet publicly available. The Balance Sheet Metrics graph reflects Q3 2016 results.
UNP aims to increase value in 6 ways with the first being World Class Safety; it is comforting to see that Safety is ranked as UNP’s #1 priority.

Creating Value the UNP Way
Fortunately, UNP achieved a Record Safety Year in FY 2016 with a reportable injury rate improving 14% relative to FY 2015.
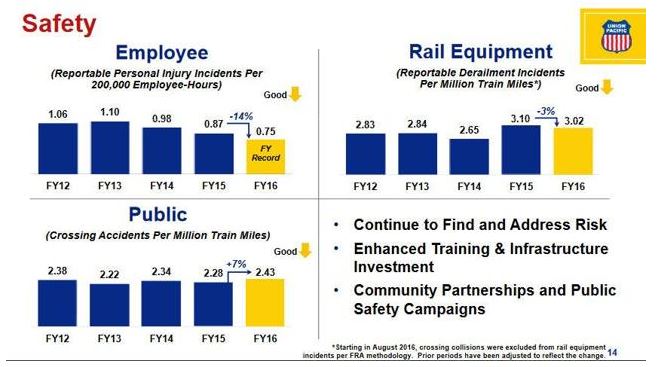
UNP and Safety
The following shows the % breakdown in freight revenue from 2011 – 2015.

UNP Freight Revenue 2011 - 2015
Note the steady erosion in the volume of business UNP generated from the Coal sector. Coal volumes have been plunging in recent years as utilities have switched to burning cheaper natural gas. In addition, the strong U.S. dollar has hurt coal exports. There was no change in this trend in 2016.
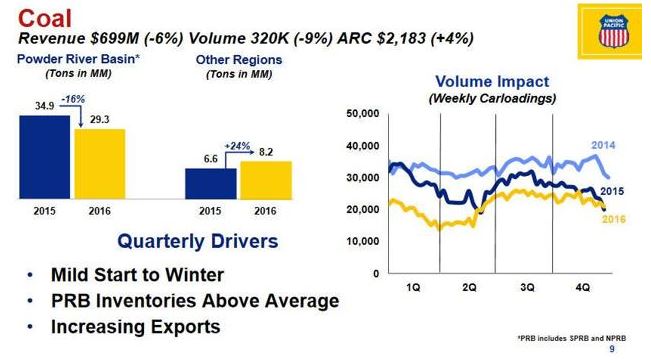
Coal Q4 2016 revenue and volume
UNP achieved an operating ratio 63.5% which is well below the 70.70% result achieved in 2011. The operating ratio is an important performance indicator used to determine the level of efficiency in this industry. It is calculated by dividing operating expenses by operating revenues.
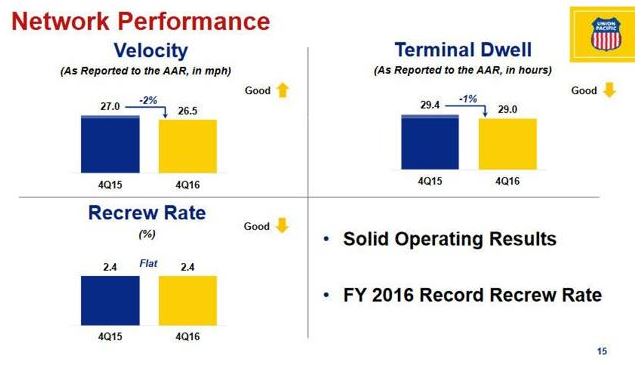
UNP Network Performance
Outlook for Fiscal 2017
As per the January 19, 2017 conference call, UNP expects:
- Volumes in Q1 FY 2017 to turn slightly positive
- Continued pricing challenges
- Momentum should pick up and full year carload growth to be in the single digit range
- More stable coal volumes
- Strengthening energy prices
- Strength in domestic intermodal and agricultural products
- Improving consumer and business confidence
- Improved productivity – plans to achieve $350MM - $400MM in savings with continued laser-like focus on G55 + 0 initiatives which it initiated in 2015 (55% Operating Ratio and 0 injuries)
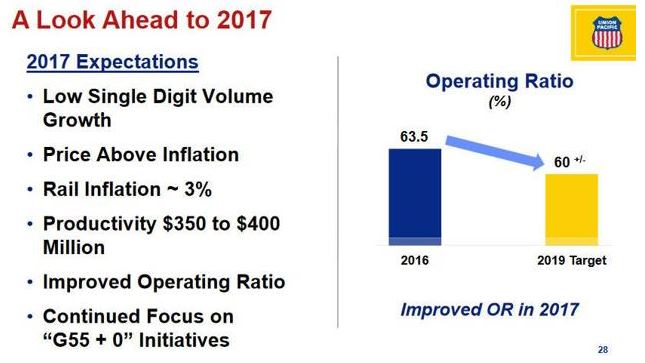
UNP 2017 Outlook
UNP has scaled back its 2017 CAPEX program which is still pending approval from UN’s Board of Directors. The plan is now to purchase 60 locomotives versus 100 with the purchase of these 40 remaining locomotives being delayed to FY 2018.
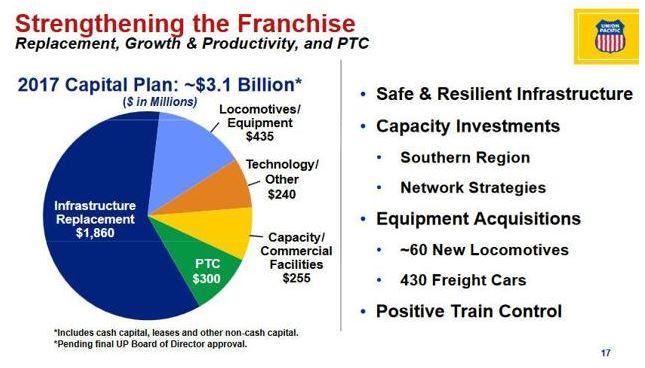
UNP 2017 Capital Plan
UNP’s management has identified the following which require close monitoring:
- changes the new Federal government may implement with respect to corporate tax reform and international trade policies.
- coal volumes – Trump’s position on fossil fuels and renewable energy is far different from that of Obama. Could there be a surge in coal volumes?
- safety concerns
- development initiatives and improvements
- pricing and capital expenditures
- potential changes in tax structures and policies which could boost trade and the bottom line of these companies.
- regulatory challenges – Reciprocal Switching, Revenue Adequacy, and the re-regulation of certain commodities* proposed by the U.S. Surface Transportation Board (“STB”) have not been welcomed by the Association of American Railroads (“AAR”).
The commodities impacted by the proposed re-regulation include crushed and broken stone, coke produced from coal, primary iron and steel products, hydraulic cement, and iron and steel scrap, wastes and tailings. AAR’s concern is the STB has failed to provide sufficient evidence to suggest market conditions of these commodities have changed adversely nor have the commodity groups petitioned for regulation.
The AAR believes the proposed Revenue Adequacy policy is a form of government price control in that Congress has asked STB to cap rates and put a price ceiling on the rates charged by railroads to shippers.
Recent News
An interesting development in the North American railroad industry is Hunter Harrison’s very recent announcement that he will be departing from CP Rail. Rumour has it that he may land at CSX.
There has been some consolidation in the rail industry over the past several years. As recently as 2016, Canadian Pacific made a run for No. 4 U.S. railroad NSC. This bid failed in the Spring of 2016 in the face of criticism from customers and lawmakers.
On January 19, 2017, UNP’s CEO reiterated that UNP remains opposed to mergers between major railroads in the United States.
Union Pacific Stock Analysis - Final Thoughts
UNP is definitely a railroad I will add to the FFJ Portfolio at some stage. Now, however, does not appear to be an opportune time given the somewhat elevated value.
Given the host of concerns railroads currently face and are expected to encounter over the upcoming quarters, I am surprised that UNP is trading at the current PE of ~21.5.
I am cautiously optimistic there will be a market correction in 2017 and will patiently bide my time hoping for a better entry point. A return to the low $90s would be wonderful; recall we were in the low $70s in early 2016.
Disclaimer: I have no knowledge of your circumstances and am not providing individualized advice or recommendations. I encourage you to conduct your own research and due diligence and to consult your financial advisor about your situation.
Disclosure: I am long CNI.
I wrote this article myself and it expresses my opinions. I am not receiving compensation for it and have no business relationship with any company mentioned.