Contents
 Summary
- This Broadridge Financial (NYSE: BR) stock anlysis is based on Q2 2017 and first half of FY 2017 results released February 8, 2017.
- Broadridge handles proxy voting services for over 90% of public companies and mutual funds in N.A. and processes more than $5T in fixed income and equity trades daily.
- In the first 6 months of FY 2017 revenue has increased 45% from the same period in FY 2016.
- Integration of the NACC business it acquired in mid 2016 is proceeding smoothly.
- Strong total revenue growth, recurring fee revenue growth, and FCF projected for remainder of the year.
- Don’t overlook BR because of its low dividend yield.
Introduction
Recently I wrote posts about ADP (NASDAQ: ADP) and CDK (NASDAQ: CDK) and whether low or no dividend yield companies belong in your portfolio. How do these posts all tie in with Broadridge Financial Solutions, Inc. (NYSE:BR)? Well...
- BR was spun off from ADP in 2007.
- CDK was spun off from ADP in 2014.
- BR, CDK, and ADP have all increased in value significantly subsequent to each respective spin-off.
- BR, CDK, and ADP all have low dividend yields.
Judging from the daily average number of shares traded (423,000), I venture to guess that BR with its sub $10B market cap is overlooked by many investors. This really is a shame since its performance subsequent to being spun off from ADP in 2007 has been impressive.
The following graph compares BR’s performance from the date it started trading as a publicly traded entity with the performance of the Dow Jones, S&P 500, Russell 1000 ETF, Russell 2000 ETF, and Russell 3000 ETF; BR’s performance relative to all these ETFs has been far superior.
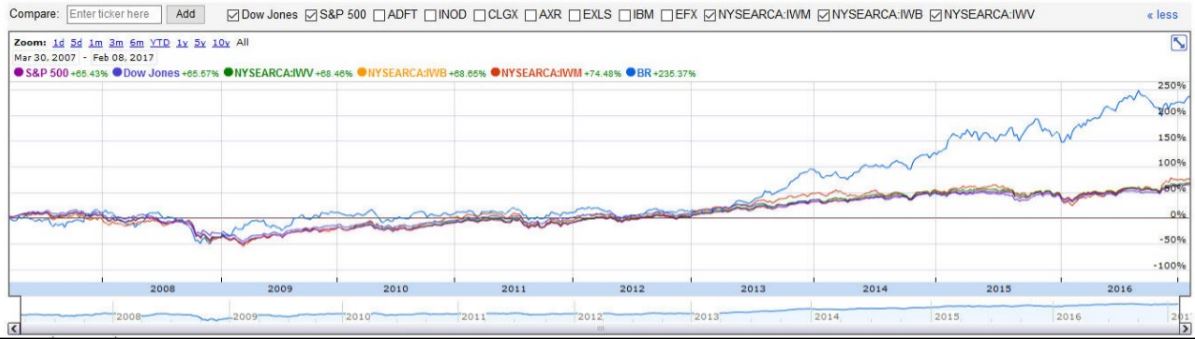
Broadridge - Stock Performance compared to indices
Industry Overview
BR is classified by Google Finance as being a member of the Professional Information Services - NEC industry within the Industrials sector. Thomson Reuters classifies BR as a member of the Professional Information Services group within the Industrials Sector. When I perform various searches within various stock screeners, the “peer groups” are composed of companies that might compete against BR in some areas of its business. I have been unable to locate any companies that compete against BR in all the areas of its business.
Business Overview
If you manage your own investments and are registered to receive Proxy Voting Material by email you likely receive emails containing an image similar to that below where BR is referenced at the bottom of the email in very small print. If that is the extent of your familiarity with BR you may wish to read up on its Strategic Vision and Journey to Drive Top Quartile Stockholder Returns.
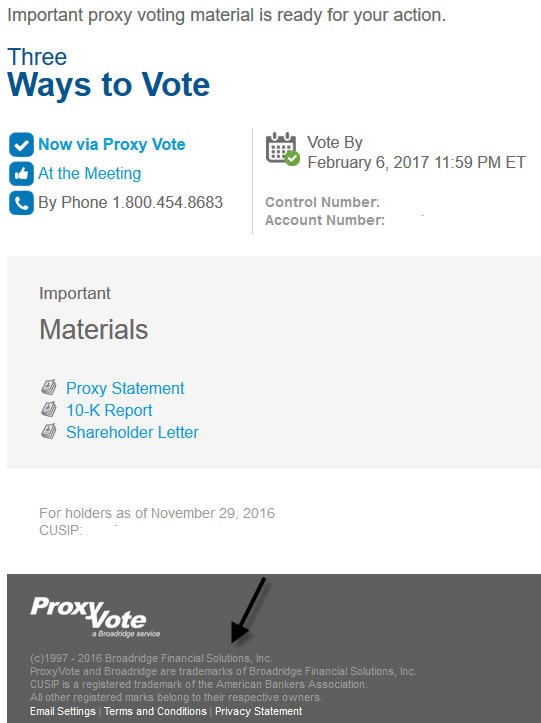
BR - Sample Important Proxy Material Email
BR has two business segments.
- Investor Communication Solutions through which it offers:
- Bank & Brokerage Investor Communication Solutions
- Customer Communication Solutions
- Corporate Issuer Solutions
- Advisor & Wealth Solutions
- Mutual Fund and Retirement Solutions
- Global Technology and Operations
BR offers a middle- and back-office securities processing platform for North American and global broker-dealers in which it provides investor and customer communications, securities processing, and data and analytics solutions. In essence, BR delivers a range of solutions that helps its clients serve their retail and institutional customers across the entire investment lifecycle, including pre-trade, trade, and post-trade processing functionality.
Looking at BR’s history you will see it began as the brokerage services division of ADP in 1962 and became a public company in 2007. During this period BR had a number of prominent achievements and notable innovations.
As you can see from BR’s history, its growth has been achieved organically and through strategic acquisitions; the link to BR’s history page does not appear to have been updated to include its most recent sizable acquisition and that completed in Q2 2017.
On July 1, 2016, BR completed the acquisition of the North American Customer Communications (“NACC”) business of DST Systems, Inc. (NSYE: DST) for $410MM in cash, subject to post-closing adjustments; in fiscal 2015 the NACC business generated $1.1B in revenue and $445MM of fee revenue.
In June 2016, when BR announced its intent to acquire NACC, it expected to achieve approximately $20MM in annualized cost synergies within 18-30 months of closing. In addition, the NACC business would be immediately accretive to its GAAP and adjusted earnings, inclusive of incremental interest expense. Based on recently announced results, BR’s expectations are materializing.
Upon acquiring this business, BR renamed the NACC business Broadridge Customer Communications and integrated it into BR’s Investor Communication Solutions segment. By doing so, BR created North America’s premier customer communications technology platform for print and digital solutions to banks, broker-dealers, mutual funds, and corporate issuers.
In Q2 2017, Broadridge completed the acquisition of M&O Systems, Inc. (“M&O”). M&O is a provider of SaaS-based compensation management and related solutions for broker-dealers and registered investment advisors. The aggregate purchase price was $25 million in cash, subject to customary working capital and other closing adjustments.
Q2 2017 and 6 Month ending December 31, 2016 Results
BR released its Q2 2017 and first half of FY 2017 results on February 8, 2017. Its Earnings release can be found here.

BR - Q2 2017 and 6 Month Ending December 31, 2016 Results
Q2 2017
- The 40% increase in Q2 revenue includes $273MM in revenue from acquisitions with the revenues of the North American Customer Communications business acquired from DST Systems, Inc. ("NACC") contributing $267MM.
- $106MM of the recurring fee revenue was from the acquisition of NACC.
- Distribution revenues rose to $346MM from $149MM, or a 76% increase. This was largely driven by the acquisition of NACC.
- Net earnings decreased 25% to $30MM compared to $40MM for Q2 2016. This was due to $410MM in acquisition costs related to the purchase of North American Customer Communications unit of DST Systems Inc. and interest payments on debt.
- Adjusted net earnings were flat at $47MM vs. $46MM for Q2 2016.
6 Months ending December 31, 2016
- The 45% increase in revenue includes revenue from acquisitions which contributed $551MM with the NACC revenue contributing $539MM.
- Adjusted operating income was $166MM, an increase of $18 million, or 12%, compared to $148MMthe prior year period.
- Adjusted operating income margin decreased to 9.3% compared to 12.0% for the prior year period. The decrease in operating income and increase in adjusted operating income was primarily due to NACC acquisition.
- Net earnings decreased 14% to $64MM compared to $74MM for the prior year period.
- Adjusted net earnings increased 5% to $91MM compared to $86MM for the prior year period.
BR’s long-term debt has definitely ballooned in the last few years as a result of its string of acquisitions and repurchase of its shares.
As at its fiscal YE 2012, LTD was $524MM, Treasury Shares was $580MM, and Goodwill and Intangible Assets was $923MM.
As at December 31, 2016, LTD was $1.081B, Treasury Shares was $1.190B, and Goodwill and Intangible Assets was $1.626B.
BR’s risk profile has changed within the last 4 years given that it has acquired a considerable number of its shares and has used debt to assist in the acquisition of various businesses for growth purposes. Despite the added level of risk, I am comfortable that BR’s debt load is not at the level to give me heartburn.
With the added annual debt service obligation, I clearly understand why management has such a focus on growing its recurring fee revenue.
Outlook for Fiscal 2017
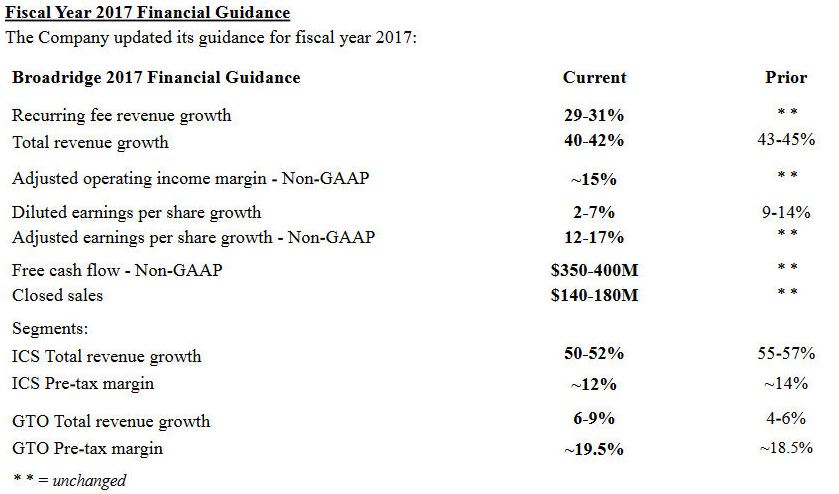
BR - Outlook for Fiscal 2017
BR has slightly revised downward its total revenue growth. There are two drivers for this revision. The first is the NACC business where it expects lower volumes from a couple of large clients; this business exhibits a high ratio of distribution to fee revenue.
The second reason is that the prospects for meaningful mutual fund proxy driven activity is strong but some of the business originally anticipated to occur in fiscal 2017 is more likely to happen in early fiscal 2018.
Diluted EPS growth has been revised downward as a result of higher non-cash related expenses and higher acquisition related expenses. Adjusted EPS excludes these expenses, and therefore, adjusted EPS and FCF projections remain unchanged.
As an investor, I view FCF as a key metric in that it provides an indication as to how much cash is generated after accounting for capital expenditures. In essence, it is what can be used for expansion, dividends, debt reduction, or the repurchase of shares.
Some investors may follow a more stringent form of FCF and will include dividend payments as a capital expenditure. I don’t follow this stringent definition.
All in all, on the February 8, 2017 conference call, management was upbeat about the remainder of FY 2017 and the outlook for 2018 as it continues to:
- focus on strengthening product leadership across its key businesses
- give high priority to capital stewardship
- be on track to achieve its 3 year financial targets
Valuation
As I compose this post, BR is trading at $68.18 and Google Finance reflects a PE of 26.89 which would imply an EPS level of $2.54. This doesn’t seem right to me given that analysts have a mean estimated EPS for FY2016 of $3.12. If I use the estimate from the analysts, I get a forward PE of 21.85.
I like to acquire shares in companies if their PE is in the mid – high teens but I know it is unrealistic to expect BR’s PE to drop to this level unless some catastrophic event occurs. I am, therefore, willing to pay up to acquire additional shares. In fact, I acquired additional shares in mid August 2016 at $68.31 which increased the average cost of our BR holdings to $34.0611.
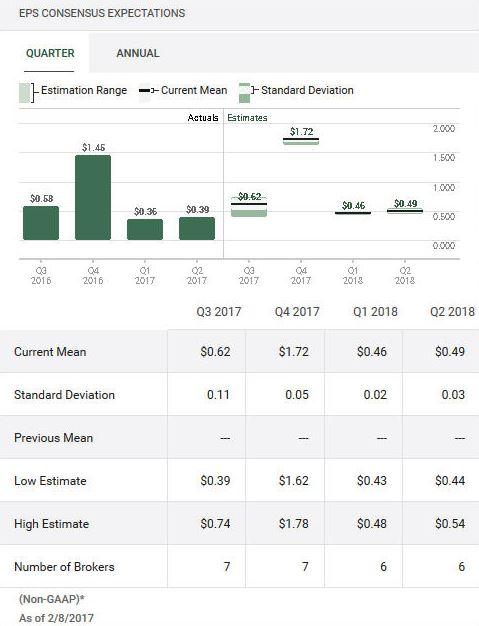
Source: TD Bank WebBroker - BR quarterly EPS forecast

Source: TD Bank WebBroker - BR annual EPS forecast
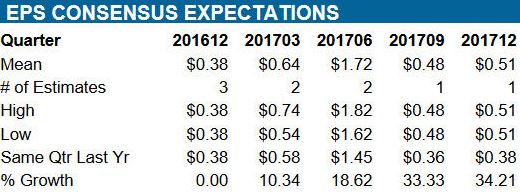
Source: ValuEngine - BR quarterly EPS forecast
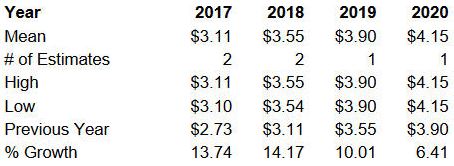
Source: ValuEngine - BR annual EPS forecast
If you are a dividend yield hungry investor, BR will likely be of no interest to you as its quarterly and annual dividend of $0.33 and $1.32 only generates a yield of 1.94%. BR, however, is consistently increasing its annual dividend. On February 2, 2017, it announced that its Board of Directors declared a quarterly cash dividend of $0.33/share payable on April 3, 2017, to stockholders of record at the close of business on March 14, 2017.
Before you completely rule out BR because of its low dividend yield you may want to read my Low or No Dividend Yield Companies Belong in Your Portfolio post.
As I noted in my recent Church & Dwight (NYSE: CHD) post, I recognize the market will likely correct at some stage. If and when it does, BR’s stock price may be caught in the downdraft. If you are inclined to think the same way, you may likely decide that you will patiently wait on the sidelines.
If you do decide to initiate a position in BR, my suggestion is that it be a small position given that market conditions just seem to be, in my humble opinion, too vulnerable for a correction. If/when there is a market correction, you can certainly decide at that point in time whether you wish to acquire more shares.
Broadridge Financial Stock Analysis - Final Thoughts
BR is a company that just quietly operates in the background and to which you never/rarely give it a second thought. It does, however, provide services that are critical to keeping bond and equity markets functioning properly and it is the leading provider of investor communications and technology-driven solutions for wealth management, asset management and capital markets firms. In essence, BR’s clients require its critical services; there are no other service providers which can provide the same suite of services to the same degree of efficiency as that provided by BR.
We currently own BR, but not in the FFJ Portfolio. As pointed out in the introduction section of this post, one quick look at BR’s stock chart from the date in which it went public (and the date we initially owned shares) shows this has definitely been a worthwhile investment.
BR is a wonderful business and that is why I was willing to acquire more shares a few months ago at a price similar to the current price. You may wish to familiarize yourself with BR so you have a good understanding of the business. This way, if there is a market correction and BR’s stock price is caught in the downdraft you will not need to start your due diligence from scratch.
Disclaimer: I have no knowledge of your circumstances and am not providing individualized advice or recommendations. I encourage you to conduct your own research and due diligence and to consult your financial advisor about your situation.
Disclosure: I am long BR.
I wrote this article myself and it expresses my opinions. I am not receiving compensation for it and have no business relationship with any company mentioned.